| Param | Original file | Final file |
|---|---|---|
| Filename | modeM0/AS1A05_156T01_9000004928_34512cztM0_level2.evt | modeM0/AS1A05_156T01_9000004928_34512cztM0_level2_quad_clean.evt |
| Size (bytes) | 182,658,240 | 30,487,680 |
| Size | 174.2 MB | 29.1 MB |
| Events in quadrant A | 1,057,732 | 193,676 |
| Events in quadrant B | 1,173,068 | 195,951 |
| Events in quadrant C | 1,318,111 | 192,646 |
| Events in quadrant D | 1,829,842 | 179,734 |
| Mode SS | |||
|---|---|---|---|
| Quadrant | BADHDUFLAG | Total packets | Discarded packets |
| A | 0 | 44 | 0 |
| B | 0 | 44 | 0 |
| C | 0 | 44 | 0 |
| D | 0 | 44 | 0 |
| Mode M0 | |||
|---|---|---|---|
| Quadrant | BADHDUFLAG | Total packets | Discarded packets |
| A | 0 | 4583 | 1 |
| B | 0 | 4924 | 1 |
| C | 0 | 5305 | 1 |
| D | 0 | 6986 | 1 |
| Mode M9 | |||
|---|---|---|---|
| Quadrant | BADHDUFLAG | Total packets | Discarded packets |
| A | 0 | 18 | 0 |
| B | 0 | 18 | 0 |
| C | 0 | 18 | 0 |
| D | 0 | 19 | 0 |
| Quadrant | Total seconds | Saturated seconds | Saturation percentage |
|---|---|---|---|
| A | 2224 | 3 | 0.134892% |
| B | 2224 | 31 | 1.393885% |
| C | 2224 | 43 | 1.933453% |
| D | 2224 | 82 | 3.687050% |
Noise dominated data is calculated using 1-second bins in cleaned event files. If a bin has >2000 counts, and if more than 50% of those come from <1% of pixels, then it is considered to be noise-dominated and hence unusable.
| Quadrant | # 1 sec bins | Bins with >0 counts | Bins with >2000 counts | High rate bins dominated by noise | Noise dominated (total time) | Noise dominated (detector-on time) | Marked lightcurve |
|---|---|---|---|---|---|---|---|
| A | 2224 | 2224 | 0 | 0 | 0.00% | 0.00% | 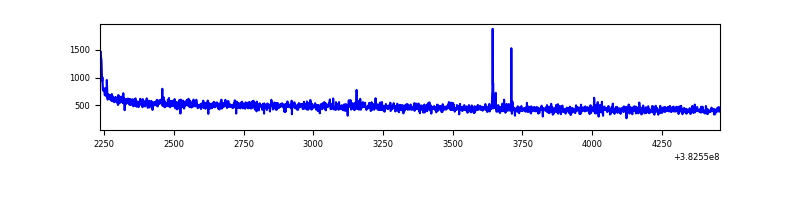 |
| B | 2224 | 2224 | 19 | 19 | 0.85% | 0.85% | 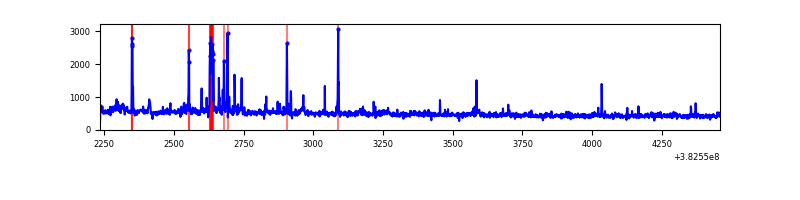 |
| C | 2224 | 2224 | 27 | 27 | 1.21% | 1.21% |  |
| D | 2224 | 2224 | 80 | 80 | 3.60% | 3.60% | 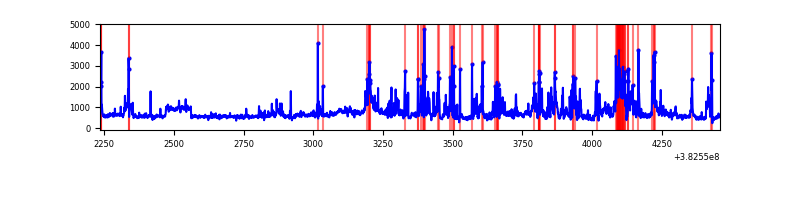 |
Top three noisy pixels from each quadrant. If the there are fewer than three noisy pixels in the level2.evt file, extra rows are filled as -1
| Pixel properties | Quadrant properties | ||||||
|---|---|---|---|---|---|---|---|
| Quadrant | DetID | PixID | Counts | Sigma | Mean | Median | Sigma |
| A | 10 | 83 | 19756 | 354.98 | 263 | 258 | 54.9 |
| A | 9 | 143 | 8315 | 146.69 | 263 | 258 | 54.9 |
| A | 13 | 6 | 5389 | 93.42 | 263 | 258 | 54.9 |
| B | 5 | 172 | 51614 | 988.43 | 263 | 258 | 52.0 |
| B | 0 | 189 | 18473 | 350.58 | 263 | 258 | 52.0 |
| B | 0 | 229 | 16238 | 307.56 | 263 | 258 | 52.0 |
| C | 0 | 10 | 109369 | 1781.43 | 259 | 261 | 61.2 |
| C | 15 | 214 | 94695 | 1541.84 | 259 | 261 | 61.2 |
| C | 14 | 67 | 92489 | 1505.82 | 259 | 261 | 61.2 |
| D | 12 | 17 | 396637 | 6108.26 | 256 | 249 | 64.9 |
| D | 8 | 195 | 225494 | 3470.98 | 256 | 249 | 64.9 |
| D | 7 | 80 | 53228 | 816.4 | 256 | 249 | 64.9 |
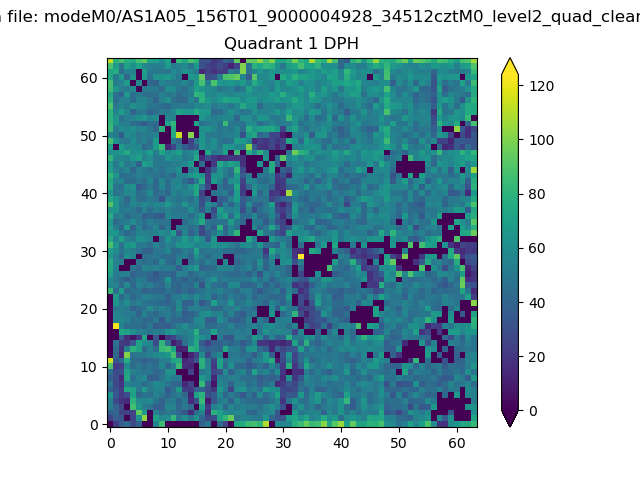
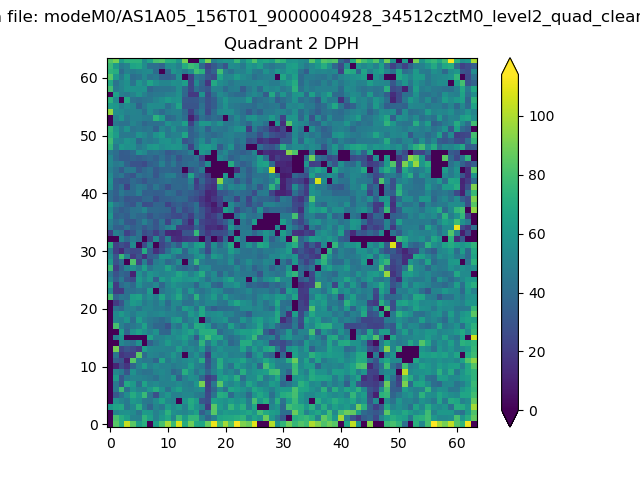
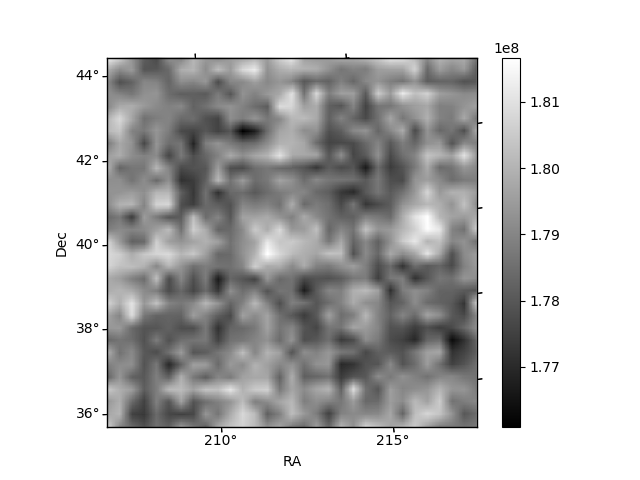
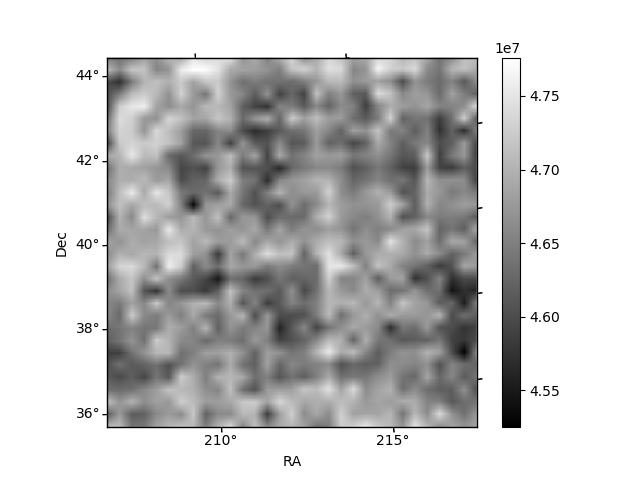
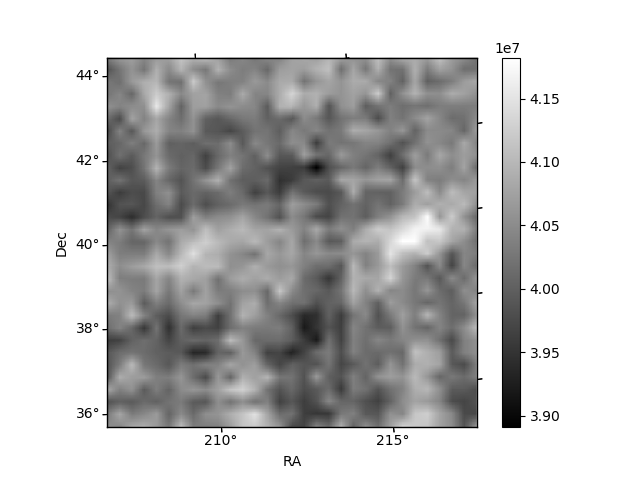
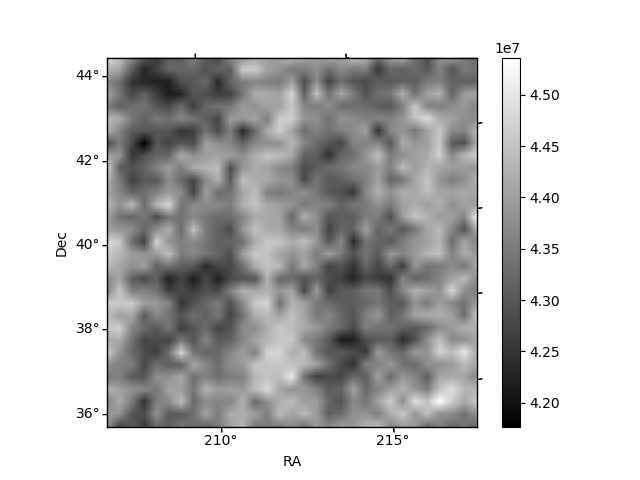
Histogram calculated using DETX and DETY for each event in the final _common_clean file
| Quadrant A | 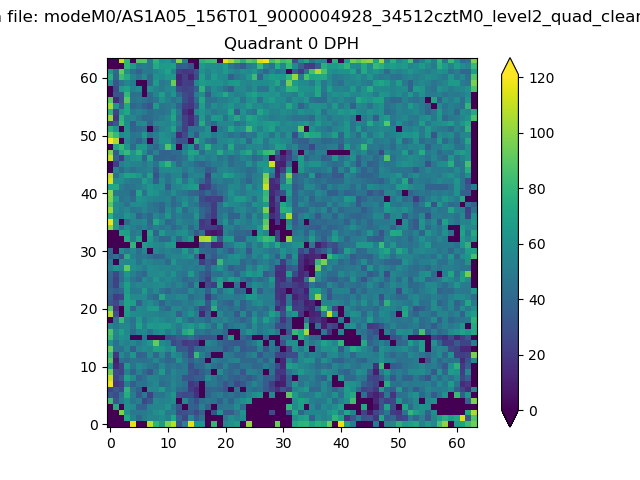 |
 |
Quadrant B |
|---|---|---|---|
| Quadrant D | 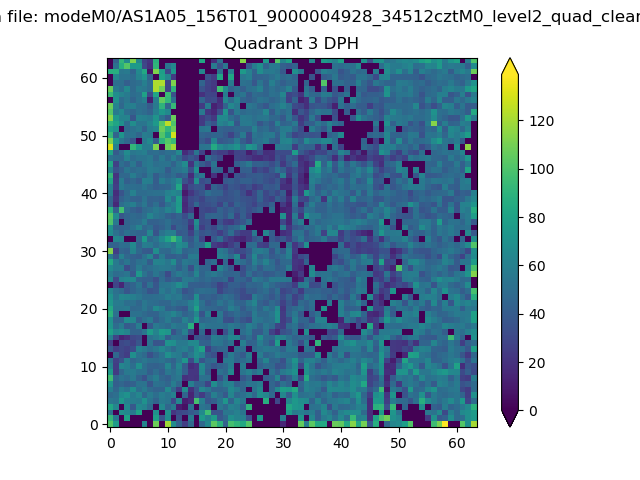 |
 |
Quadrant C |
| Plot type | Count rate plots | Images |
|---|---|---|
| Comparison with Poisson distribution Blue bars denote a histogram of data divided into 1 sec bins. Red curve is a Poisson curve with rate = median count rate of data. |
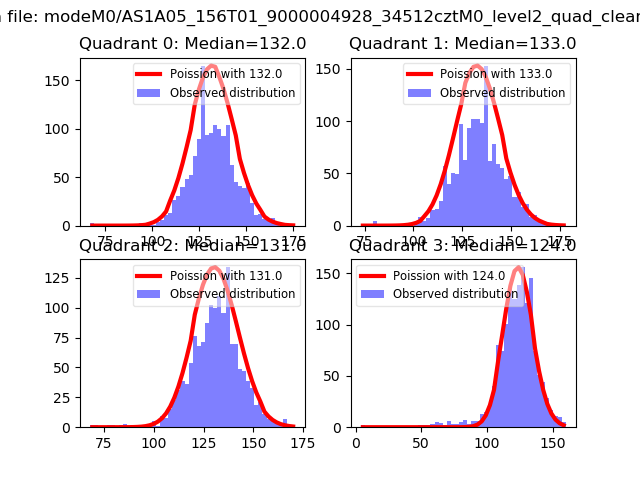 |
 |
| Quadrant-wise count rates Data is divided into 100 sec bins |
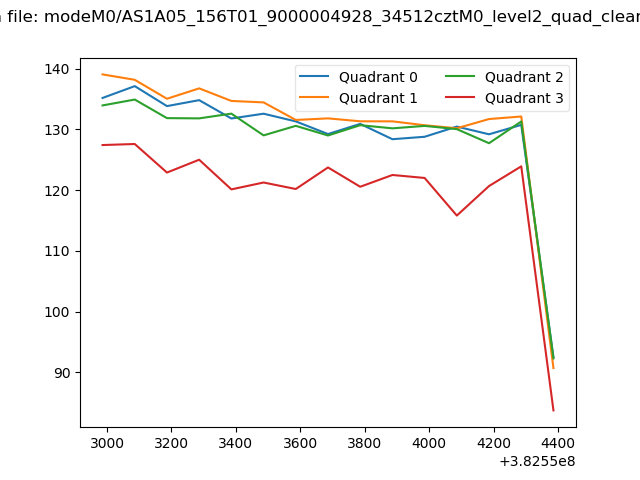 |
|
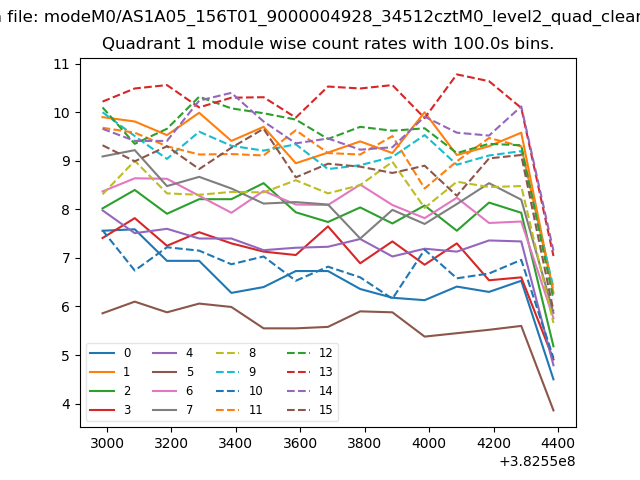
| Module-wise count rates for Quadrant A Data is divided into 100 sec bins |
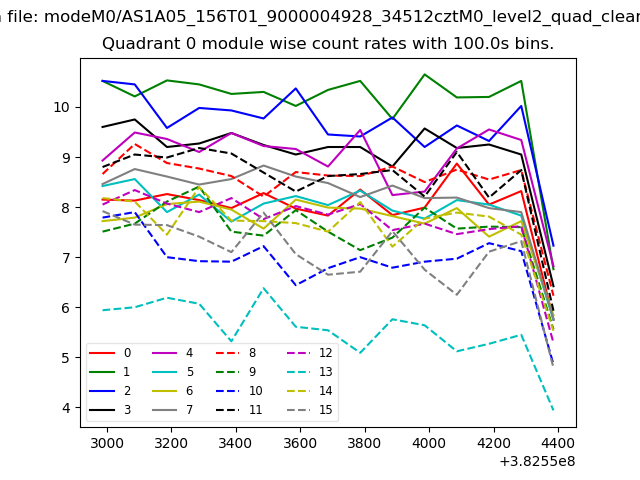 |
 |
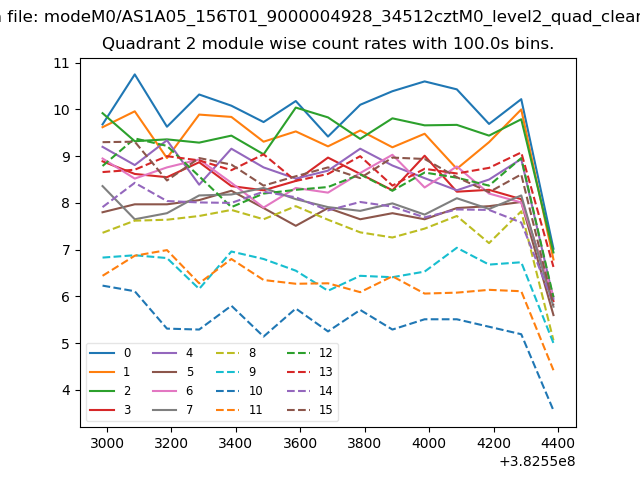
| Module-wise count rates for Quadrant B Data is divided into 100 sec bins |
 |
 |
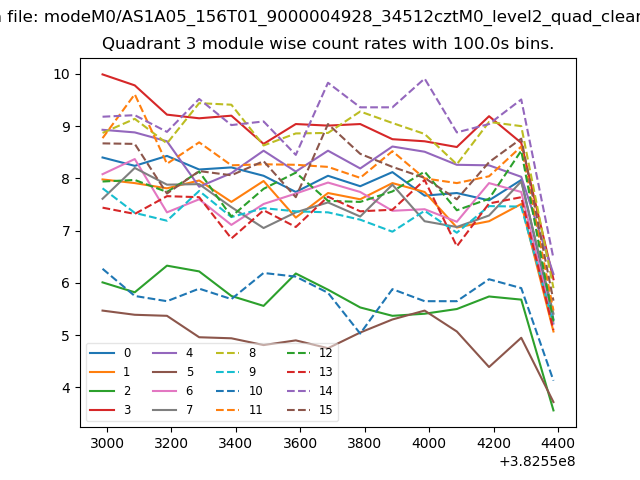
| Module-wise count rates for Quadrant C Data is divided into 100 sec bins |
 |
 |
| Module-wise count rates for Quadrant D Data is divided into 100 sec bins |
 |
 |
| Parameter | Plot |
|---|---|
| CZT HV Monitor | 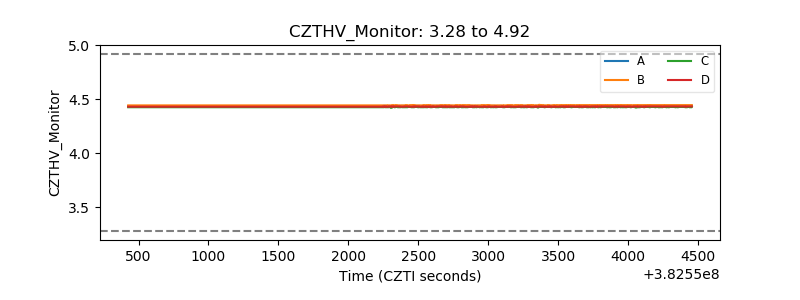 |
| D_VDD | 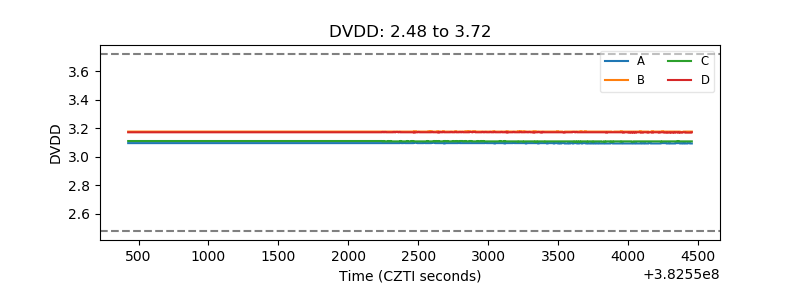 |
| Temperature 1 | 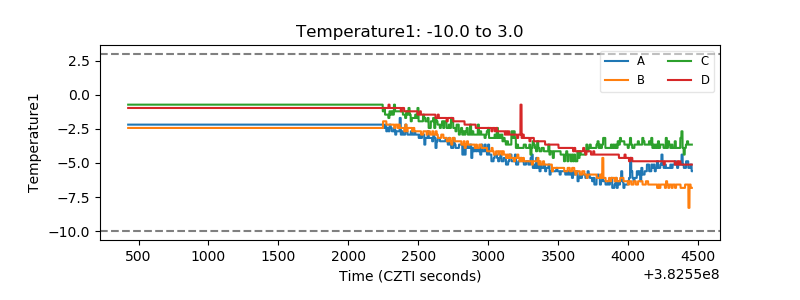 |
| Veto HV Monitor | 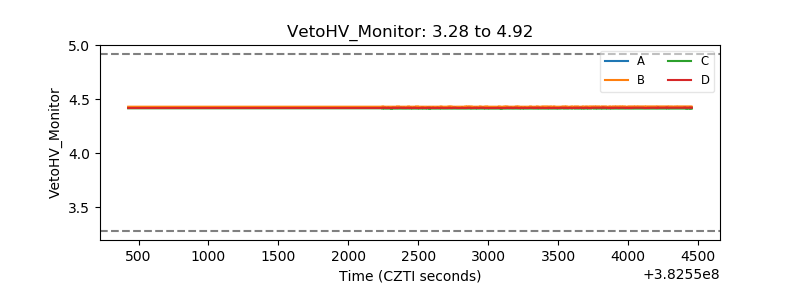 |
| Veto LLD | 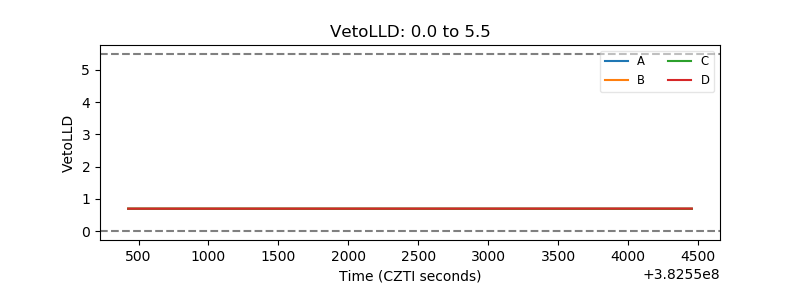 |
| Alpha Counter | 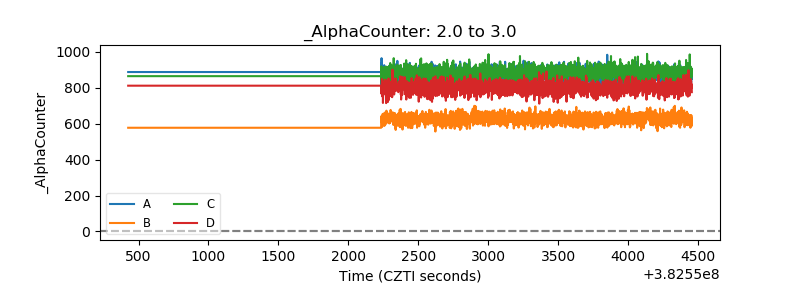 |
| _CPM_Rate | 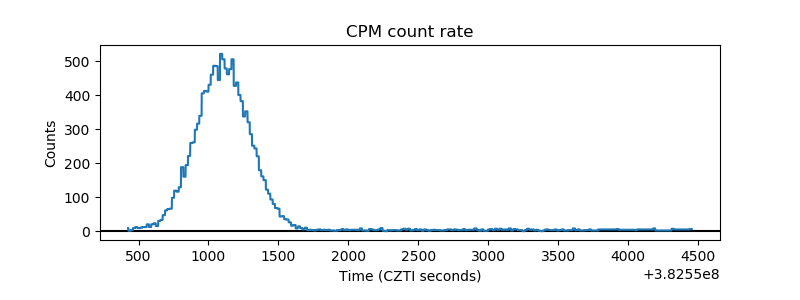 |
| CZT Counter | 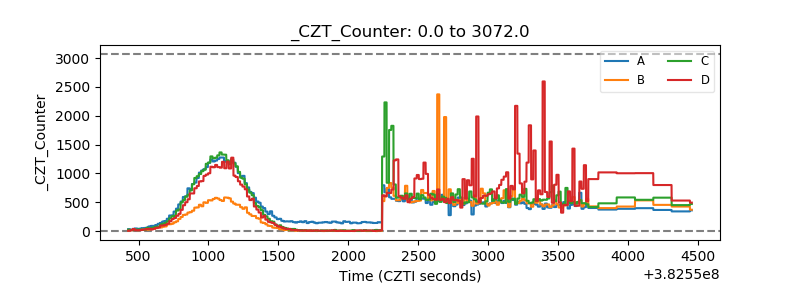 |
| +2.5 Volts monitor | 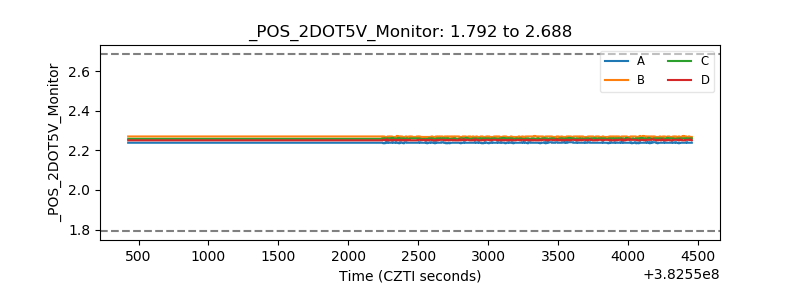 |
| +5 Volts monitor | 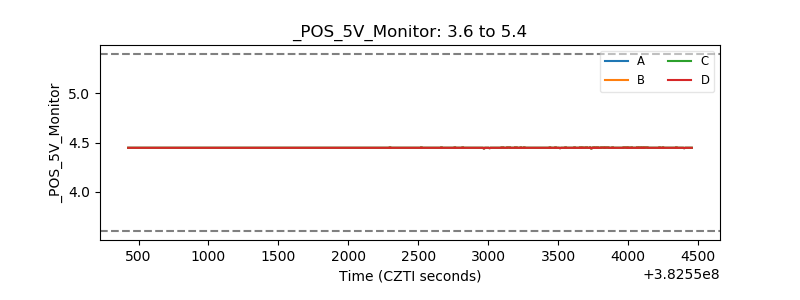 |
| _ROLL_ROT | 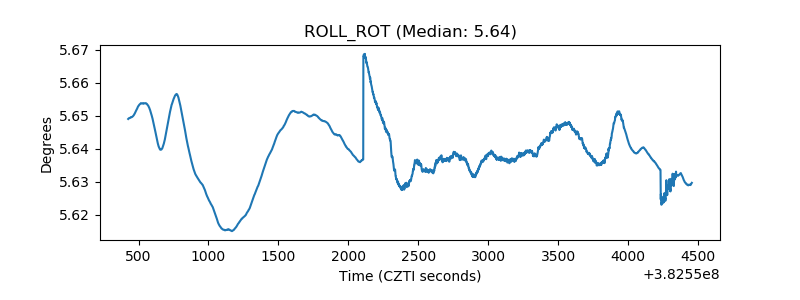 |
| _Roll_DEC | 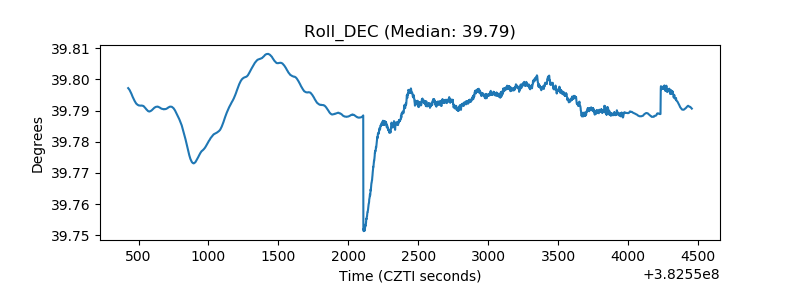 |
| _Roll_RA | 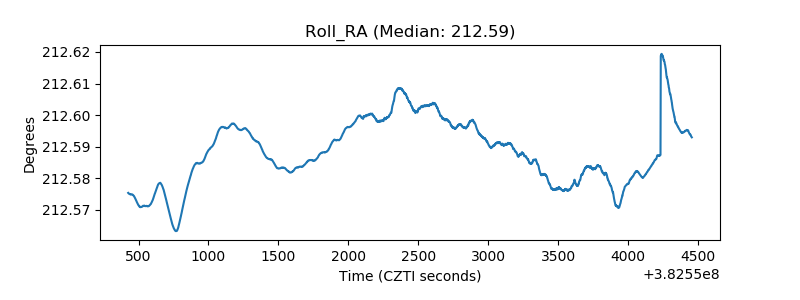 |
| Veto Counter | 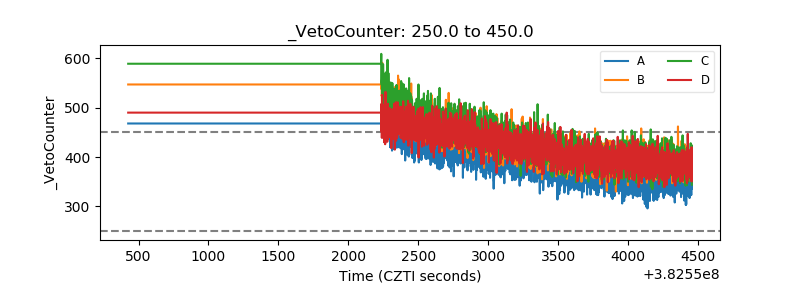 |