| Param | Original file | Final file |
|---|---|---|
| Filename | modeM0/AS1A05_156T01_9000004928_34503cztM0_level2.evt | modeM0/AS1A05_156T01_9000004928_34503cztM0_level2_quad_clean.evt |
| Size (bytes) | 1,360,918,080 | 173,770,560 |
| Size | 1.3 GB | 165.7 MB |
| Events in quadrant A | 6,921,895 | 1,090,406 |
| Events in quadrant B | 10,270,710 | 1,088,249 |
| Events in quadrant C | 7,433,826 | 1,099,606 |
| Events in quadrant D | 15,577,844 | 948,863 |
| Mode SS | |||
|---|---|---|---|
| Quadrant | BADHDUFLAG | Total packets | Discarded packets |
| A | 0 | 314 | 6 |
| B | 0 | 314 | 6 |
| C | 0 | 316 | 8 |
| D | 0 | 313 | 7 |
| Mode M0 | |||
|---|---|---|---|
| Quadrant | BADHDUFLAG | Total packets | Discarded packets |
| A | 0 | 31419 | 755 |
| B | 0 | 41690 | 882 |
| C | 0 | 32391 | 746 |
| D | 0 | 58101 | 1215 |
| Mode M9 | |||
|---|---|---|---|
| Quadrant | BADHDUFLAG | Total packets | Discarded packets |
| A | 0 | 42 | 0 |
| B | 0 | 42 | 0 |
| C | 0 | 42 | 0 |
| D | 0 | 42 | 0 |
| Quadrant | Total seconds | Saturated seconds | Saturation percentage |
|---|---|---|---|
| A | 14997 | 34 | 0.226712% |
| B | 14998 | 1180 | 7.867716% |
| C | 14999 | 23 | 0.153344% |
| D | 14979 | 1769 | 11.809867% |
Noise dominated data is calculated using 1-second bins in cleaned event files. If a bin has >2000 counts, and if more than 50% of those come from <1% of pixels, then it is considered to be noise-dominated and hence unusable.
| Quadrant | # 1 sec bins | Bins with >0 counts | Bins with >2000 counts | High rate bins dominated by noise | Noise dominated (total time) | Noise dominated (detector-on time) | Marked lightcurve |
|---|---|---|---|---|---|---|---|
| A | 19488 | 15060 | 11 | 11 | 0.06% | 0.07% | 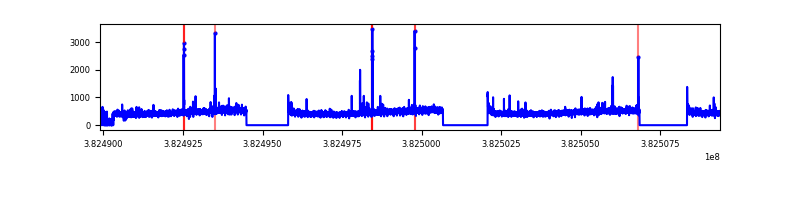 |
| B | 19462 | 15069 | 727 | 727 | 3.74% | 4.82% | 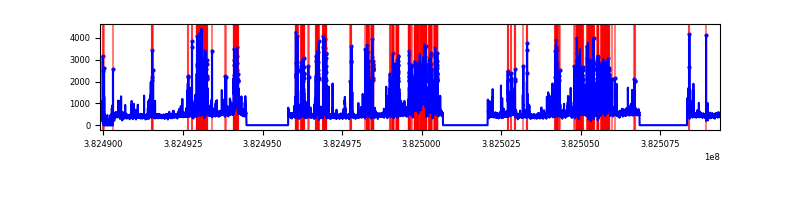 |
| C | 19462 | 15052 | 12 | 12 | 0.06% | 0.08% | 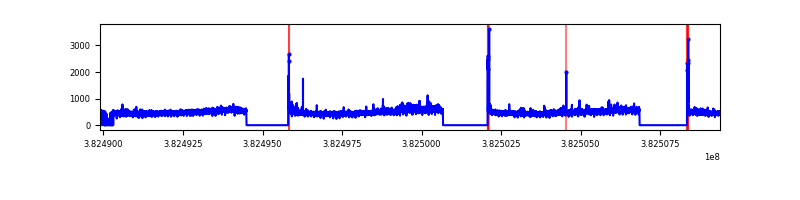 |
| D | 19491 | 15038 | 1526 | 1526 | 7.83% | 10.15% | 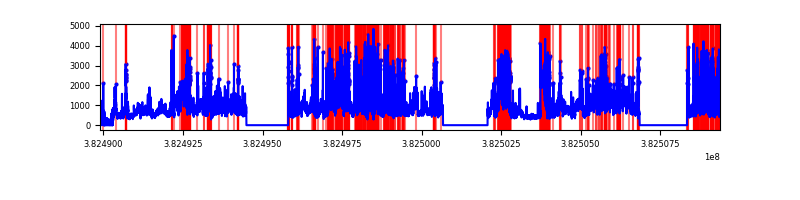 |
Top three noisy pixels from each quadrant. If the there are fewer than three noisy pixels in the level2.evt file, extra rows are filled as -1
| Pixel properties | Quadrant properties | ||||||
|---|---|---|---|---|---|---|---|
| Quadrant | DetID | PixID | Counts | Sigma | Mean | Median | Sigma |
| A | 9 | 143 | 83584 | 238.55 | 1726 | 1691 | 343.3 |
| A | 10 | 83 | 69583 | 197.77 | 1726 | 1691 | 343.3 |
| A | 15 | 169 | 47751 | 134.17 | 1726 | 1691 | 343.3 |
| B | 5 | 172 | 2944713 | 9307.92 | 1656 | 1613 | 316.2 |
| B | 0 | 229 | 347922 | 1095.25 | 1656 | 1613 | 316.2 |
| B | 4 | 171 | 209830 | 658.51 | 1656 | 1613 | 316.2 |
| C | 15 | 214 | 631128 | 1646.52 | 1666 | 1678 | 382.3 |
| C | 14 | 67 | 190937 | 495.06 | 1666 | 1678 | 382.3 |
| C | 0 | 10 | 76877 | 196.71 | 1666 | 1678 | 382.3 |
| D | 8 | 195 | 2771031 | 7193.99 | 1582 | 1539 | 385.0 |
| D | 2 | 250 | 1817341 | 4716.7 | 1582 | 1539 | 385.0 |
| D | 10 | 204 | 1430961 | 3713.04 | 1582 | 1539 | 385.0 |
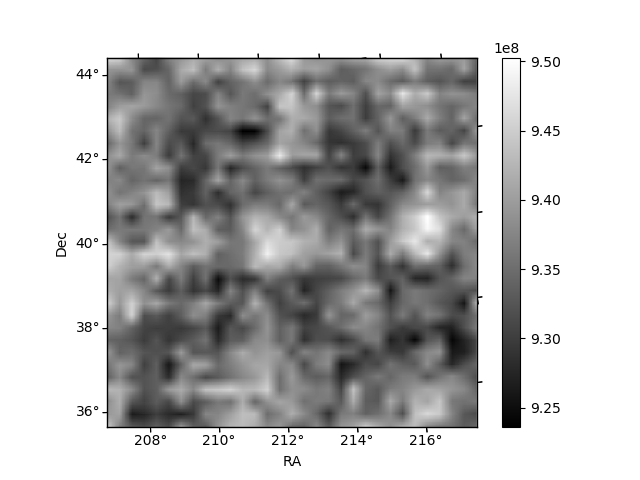
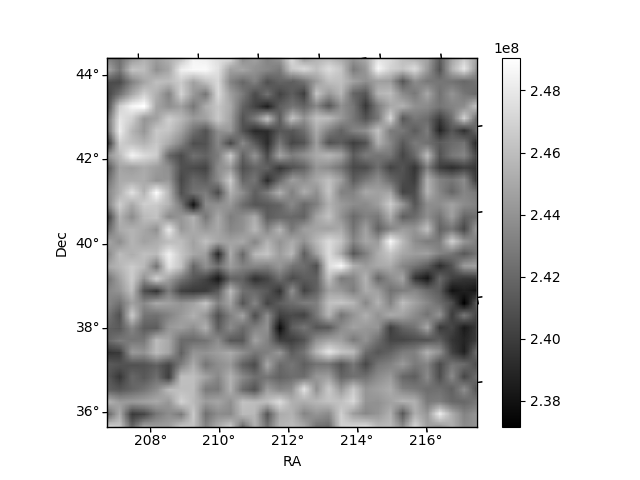
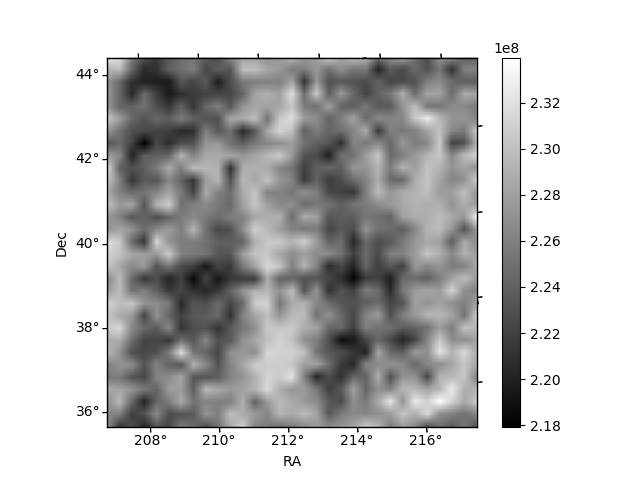
Histogram calculated using DETX and DETY for each event in the final _common_clean file
| Quadrant A | 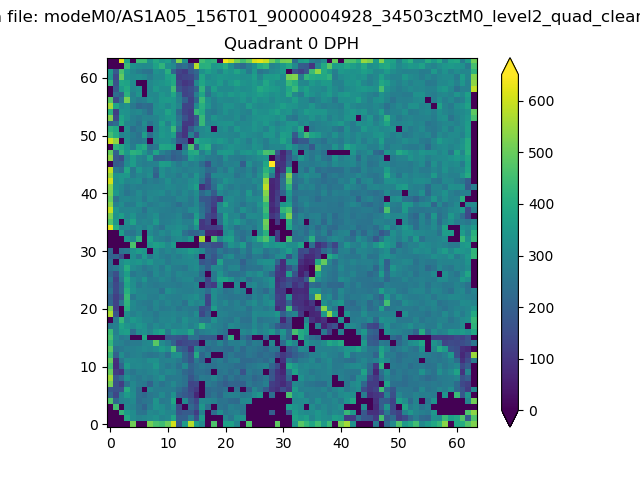 |
 |
Quadrant B |
|---|---|---|---|
| Quadrant D | 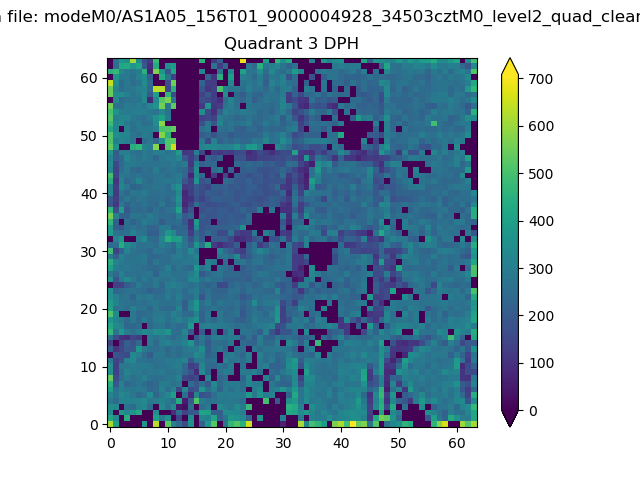 |
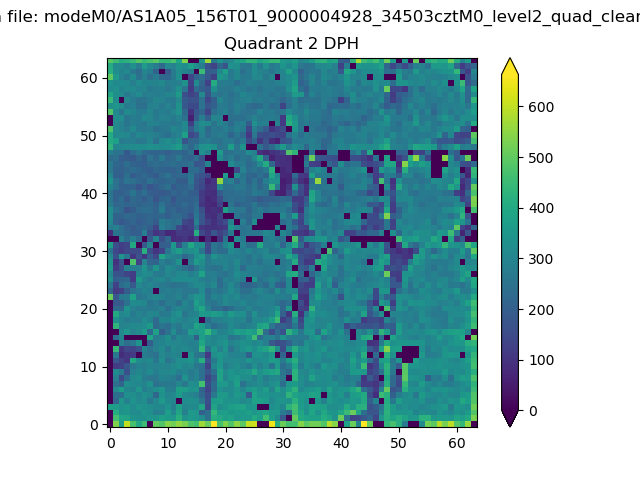 |
Quadrant C |
| Plot type | Count rate plots | Images |
|---|---|---|
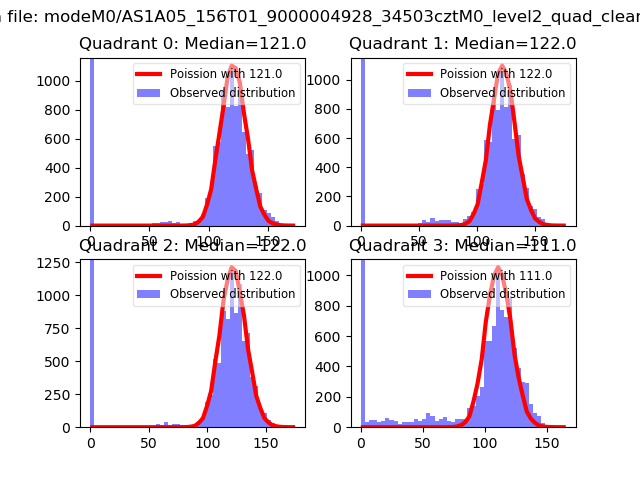
| Comparison with Poisson distribution Blue bars denote a histogram of data divided into 1 sec bins. Red curve is a Poisson curve with rate = median count rate of data. |
 |
 |
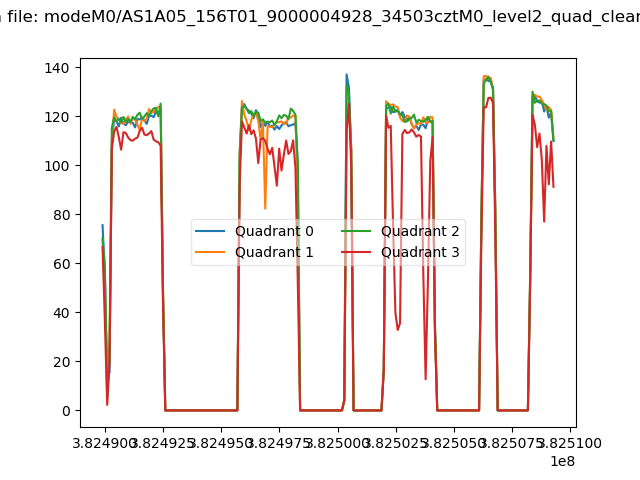
| Quadrant-wise count rates Data is divided into 100 sec bins |
 |
|
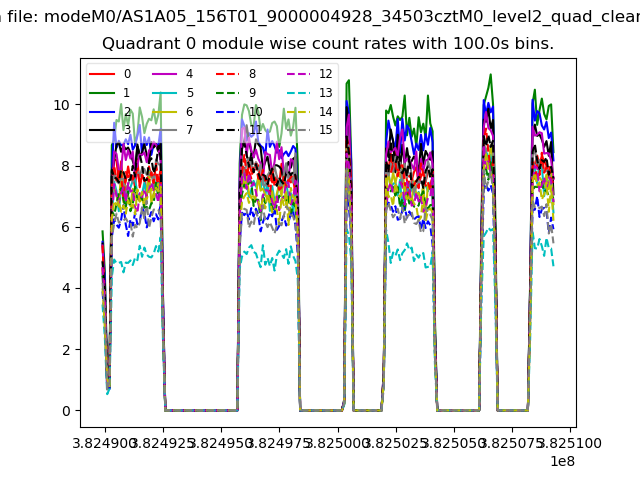
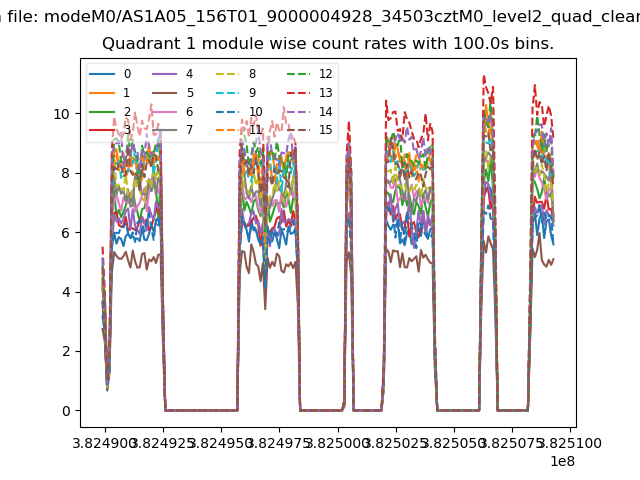
| Module-wise count rates for Quadrant A Data is divided into 100 sec bins |
 |
 |
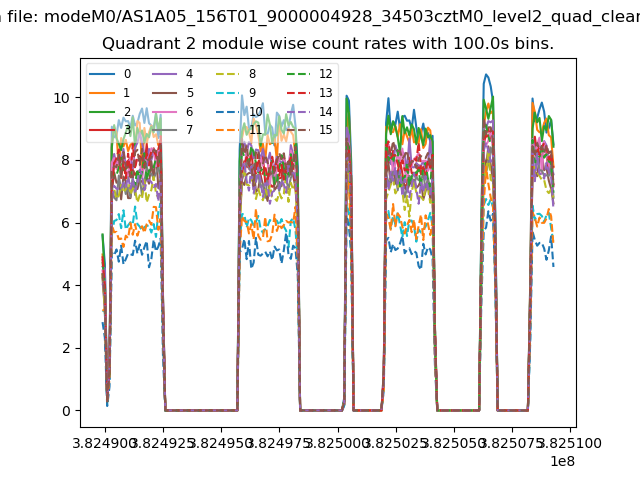
| Module-wise count rates for Quadrant B Data is divided into 100 sec bins |
 |
 |
| Module-wise count rates for Quadrant C Data is divided into 100 sec bins |
 |
 |
| Module-wise count rates for Quadrant D Data is divided into 100 sec bins |
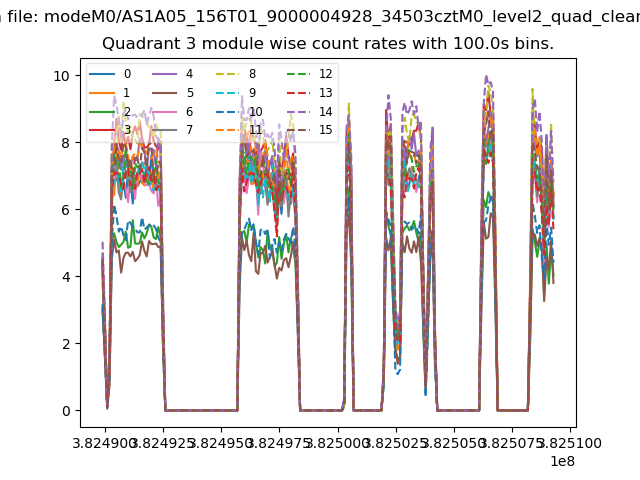 |
 |
| Parameter | Plot |
|---|---|
| CZT HV Monitor | 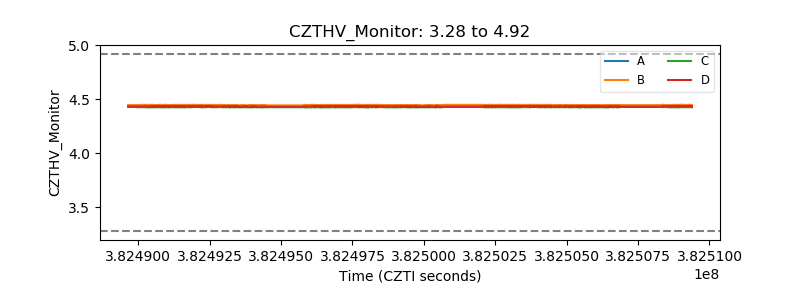 |
| D_VDD | 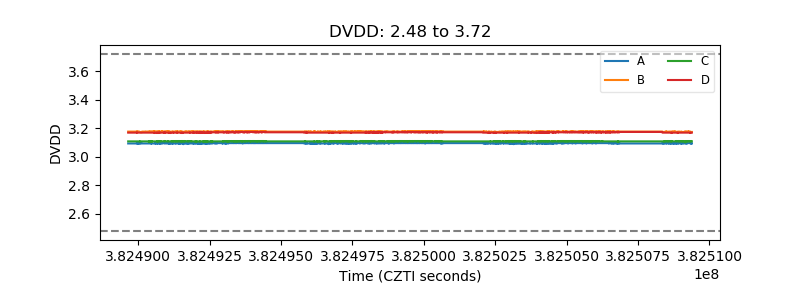 |
| Temperature 1 | 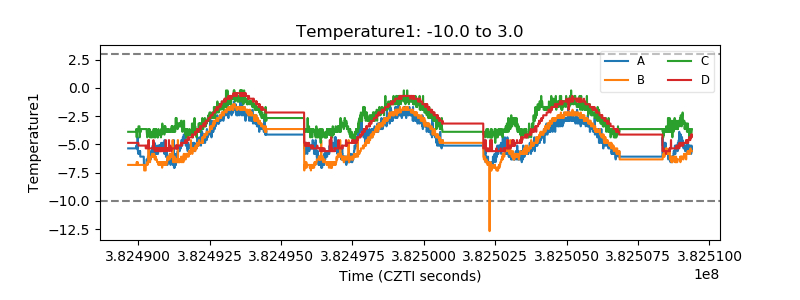 |
| Veto HV Monitor | 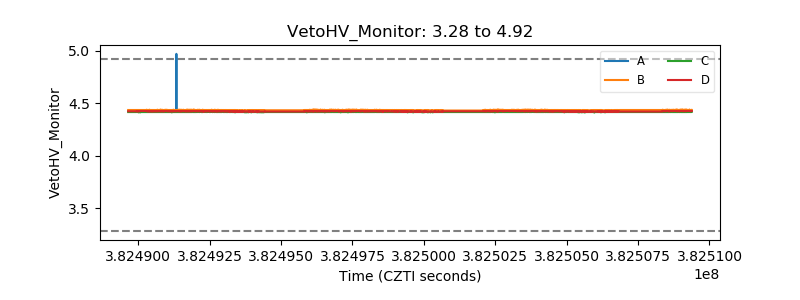 |
| Veto LLD | 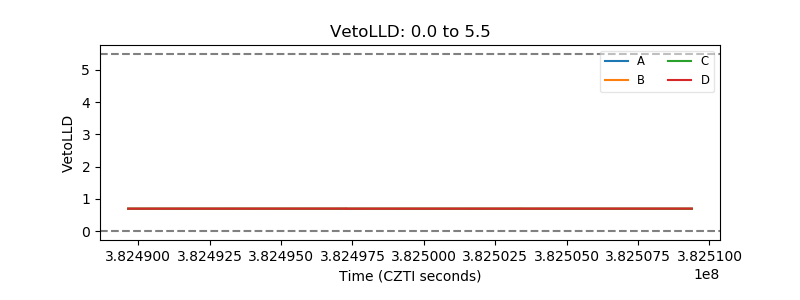 |
| Alpha Counter | 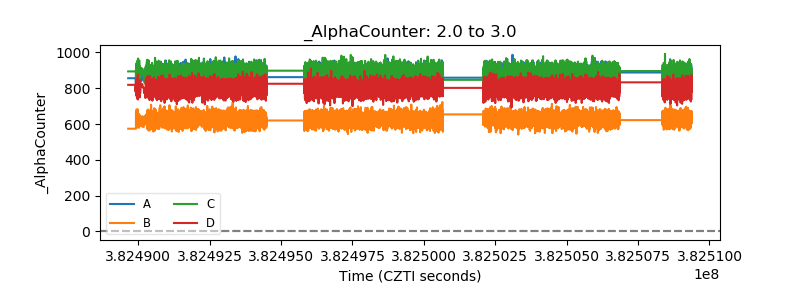 |
| _CPM_Rate | 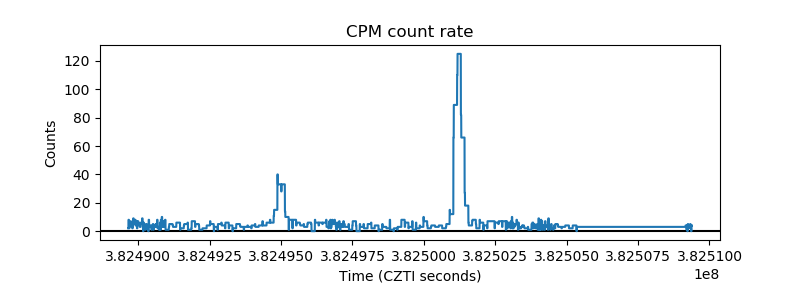 |
| CZT Counter | 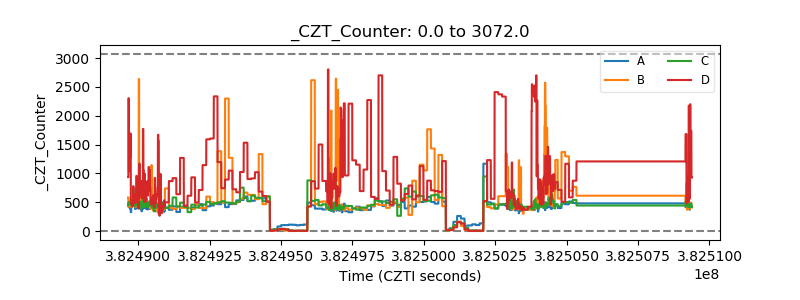 |
| +2.5 Volts monitor | 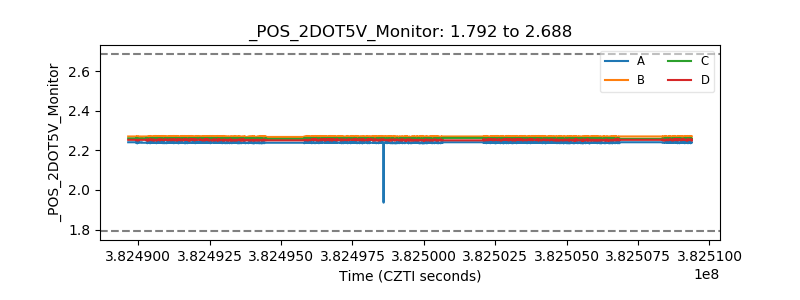 |
| +5 Volts monitor | 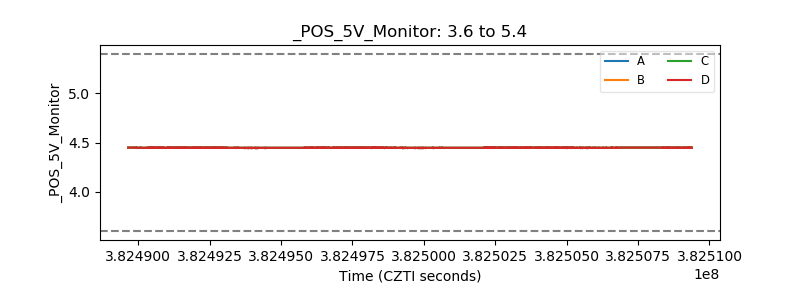 |
| _ROLL_ROT | 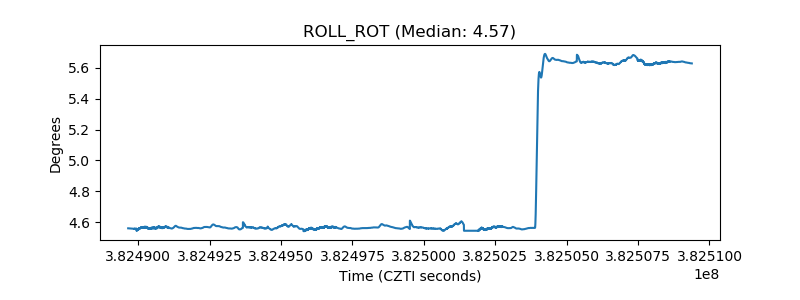 |
| _Roll_DEC | 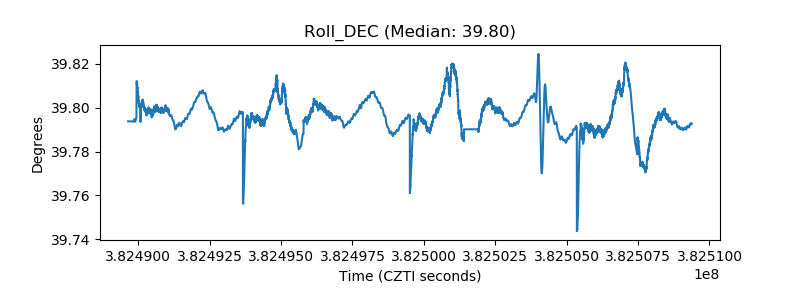 |
| _Roll_RA | 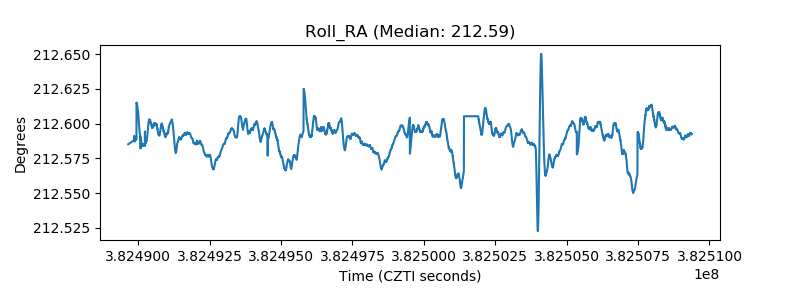 |
| Veto Counter | 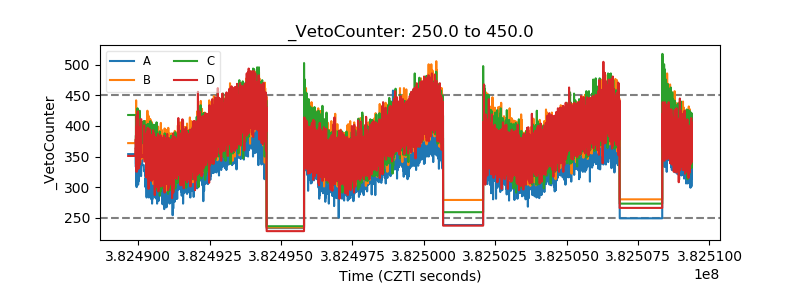 |