| Param | Original file | Final file |
|---|---|---|
| Filename | modeM0/AS1A05_156T01_9000004928_34496cztM0_level2.evt | modeM0/AS1A05_156T01_9000004928_34496cztM0_level2_quad_clean.evt |
| Size (bytes) | 452,318,400 | 64,497,600 |
| Size | 431.4 MB | 61.5 MB |
| Events in quadrant A | 2,489,650 | 407,737 |
| Events in quadrant B | 3,695,577 | 406,576 |
| Events in quadrant C | 2,786,067 | 408,130 |
| Events in quadrant D | 4,392,506 | 384,332 |
| Mode SS | |||
|---|---|---|---|
| Quadrant | BADHDUFLAG | Total packets | Discarded packets |
| A | 0 | 102 | 0 |
| B | 0 | 102 | 0 |
| C | 0 | 102 | 0 |
| D | 0 | 102 | 0 |
| Mode M0 | |||
|---|---|---|---|
| Quadrant | BADHDUFLAG | Total packets | Discarded packets |
| A | 0 | 10409 | 3 |
| B | 0 | 14196 | 2 |
| C | 0 | 11152 | 2 |
| D | 0 | 16631 | 2 |
| Mode M9 | |||
|---|---|---|---|
| Quadrant | BADHDUFLAG | Total packets | Discarded packets |
| A | 0 | 24 | 0 |
| B | 0 | 24 | 0 |
| C | 0 | 24 | 0 |
| D | 0 | 25 | 0 |
| Quadrant | Total seconds | Saturated seconds | Saturation percentage |
|---|---|---|---|
| A | 4930 | 6 | 0.121704% |
| B | 4930 | 390 | 7.910751% |
| C | 4930 | 39 | 0.791075% |
| D | 4930 | 89 | 1.805274% |
Noise dominated data is calculated using 1-second bins in cleaned event files. If a bin has >2000 counts, and if more than 50% of those come from <1% of pixels, then it is considered to be noise-dominated and hence unusable.
| Quadrant | # 1 sec bins | Bins with >0 counts | Bins with >2000 counts | High rate bins dominated by noise | Noise dominated (total time) | Noise dominated (detector-on time) | Marked lightcurve |
|---|---|---|---|---|---|---|---|
| A | 7053 | 4931 | 1 | 1 | 0.01% | 0.02% | 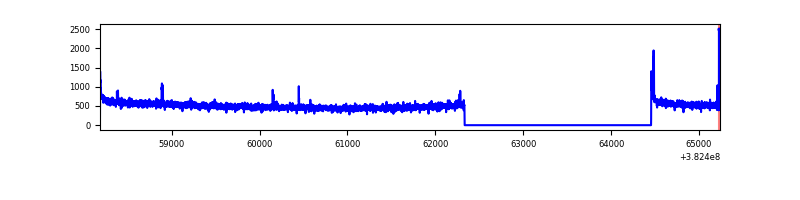 |
| B | 7053 | 4931 | 259 | 259 | 3.67% | 5.25% | 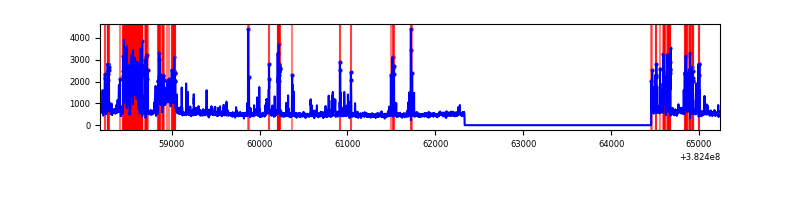 |
| C | 7053 | 4931 | 18 | 18 | 0.26% | 0.37% | 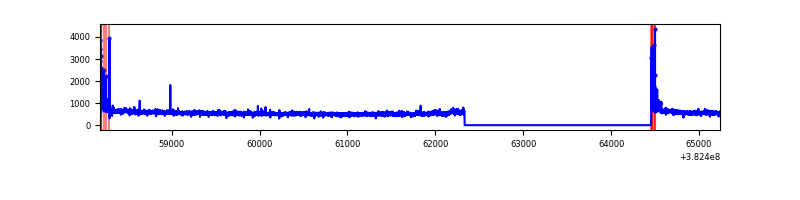 |
| D | 7053 | 4931 | 120 | 120 | 1.70% | 2.43% | 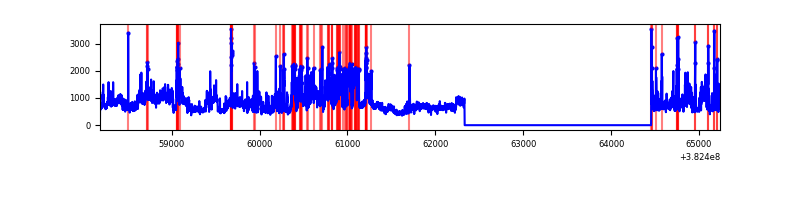 |
Top three noisy pixels from each quadrant. If the there are fewer than three noisy pixels in the level2.evt file, extra rows are filled as -1
| Pixel properties | Quadrant properties | ||||||
|---|---|---|---|---|---|---|---|
| Quadrant | DetID | PixID | Counts | Sigma | Mean | Median | Sigma |
| A | 10 | 83 | 39578 | 313.24 | 625 | 614 | 124.4 |
| A | 9 | 143 | 16880 | 130.77 | 625 | 614 | 124.4 |
| A | 13 | 6 | 11514 | 87.63 | 625 | 614 | 124.4 |
| B | 5 | 172 | 1019704 | 9086.92 | 603 | 589 | 112.2 |
| B | 0 | 229 | 155224 | 1378.8 | 603 | 589 | 112.2 |
| B | 0 | 189 | 62566 | 552.62 | 603 | 589 | 112.2 |
| C | 15 | 214 | 210267 | 1488.0 | 611 | 618 | 140.9 |
| C | 0 | 10 | 101534 | 716.26 | 611 | 618 | 140.9 |
| C | 14 | 67 | 48456 | 339.53 | 611 | 618 | 140.9 |
| D | 8 | 195 | 1070249 | 6490.08 | 603 | 592 | 164.8 |
| D | 10 | 204 | 558793 | 3386.85 | 603 | 592 | 164.8 |
| D | 7 | 223 | 101855 | 614.4 | 603 | 592 | 164.8 |
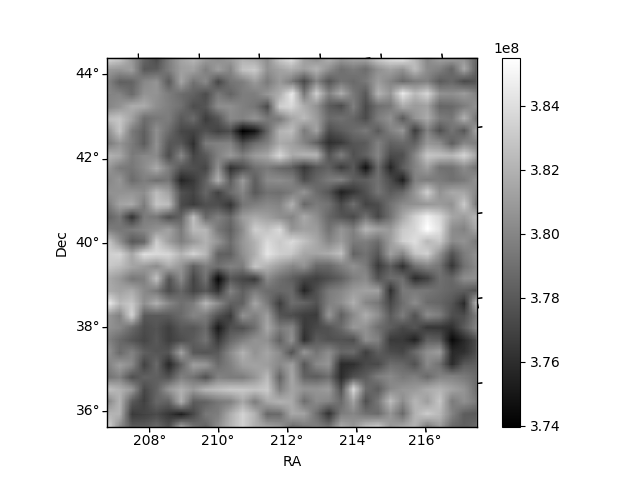
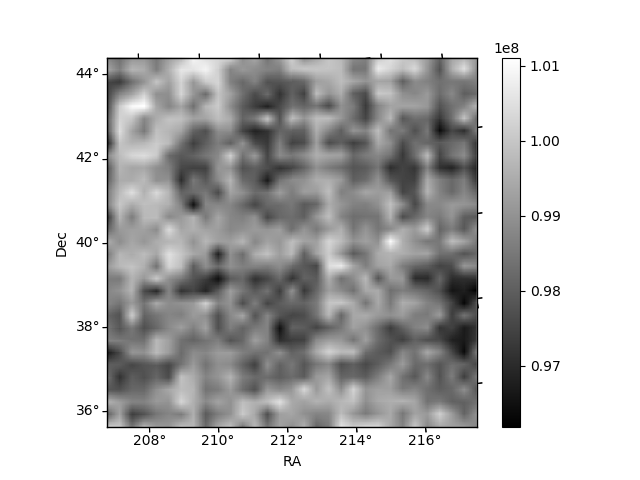
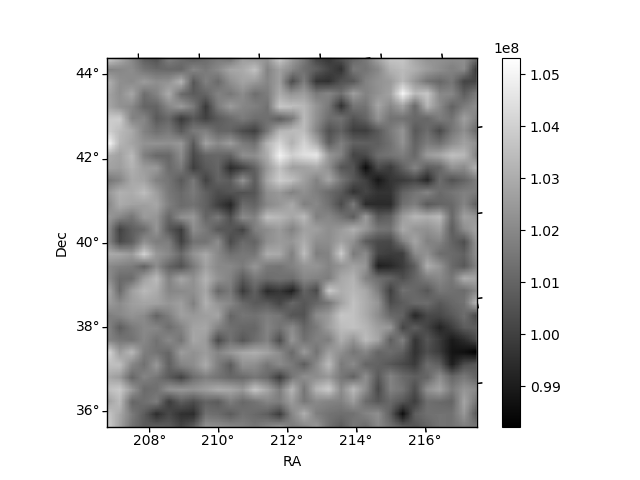
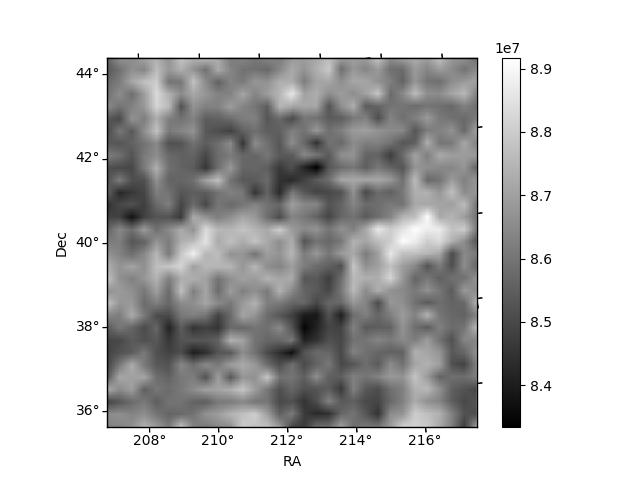
Histogram calculated using DETX and DETY for each event in the final _common_clean file
| Quadrant A | 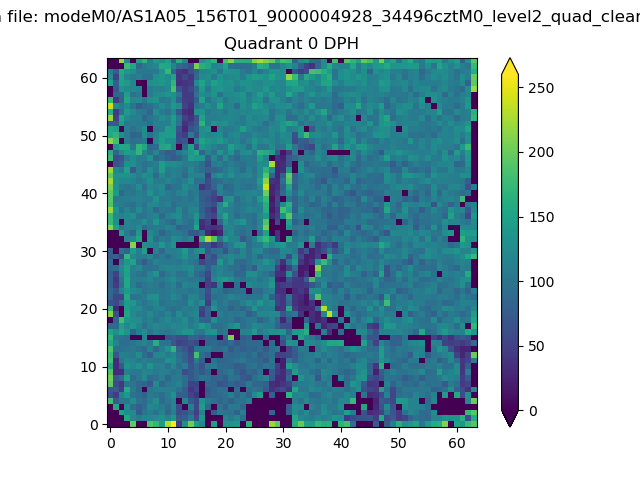 |
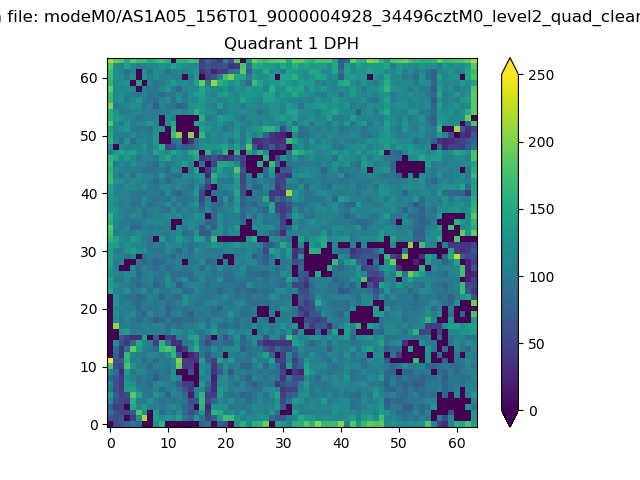 |
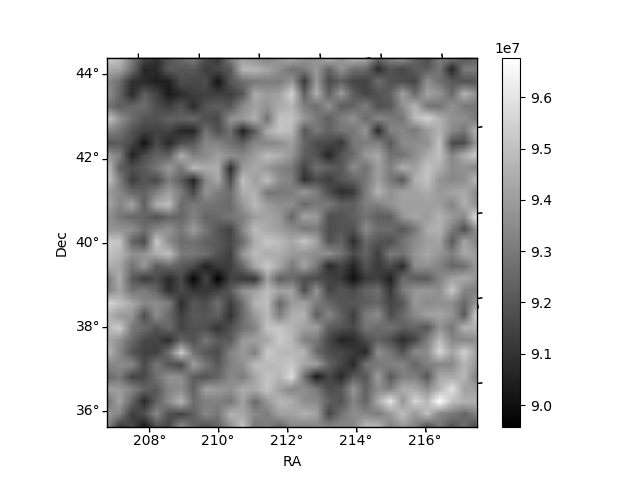
Quadrant B |
|---|---|---|---|
| Quadrant D | 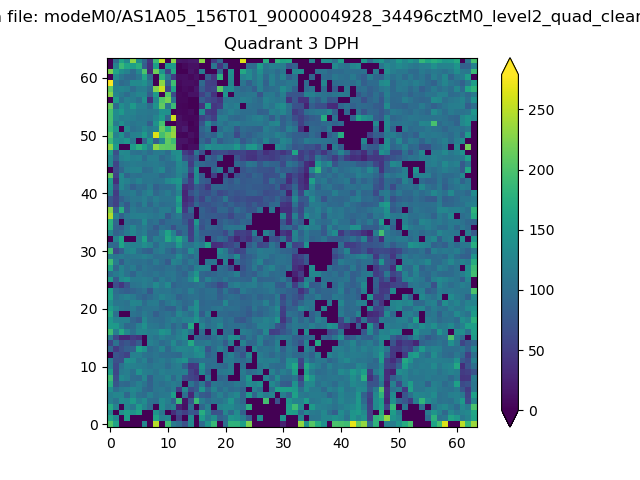 |
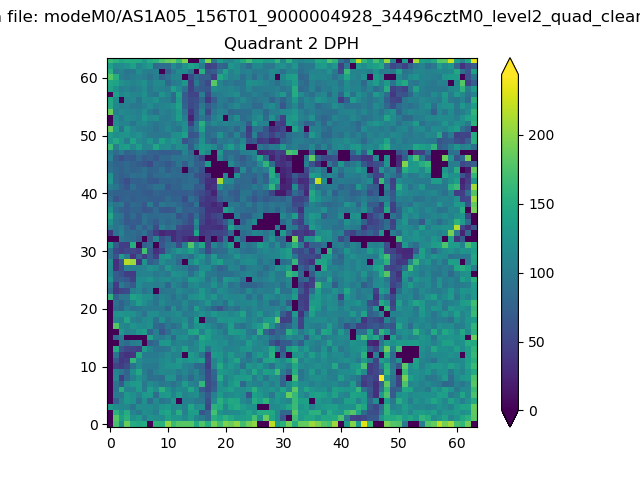 |
Quadrant C |
| Plot type | Count rate plots | Images |
|---|---|---|
| Comparison with Poisson distribution Blue bars denote a histogram of data divided into 1 sec bins. Red curve is a Poisson curve with rate = median count rate of data. |
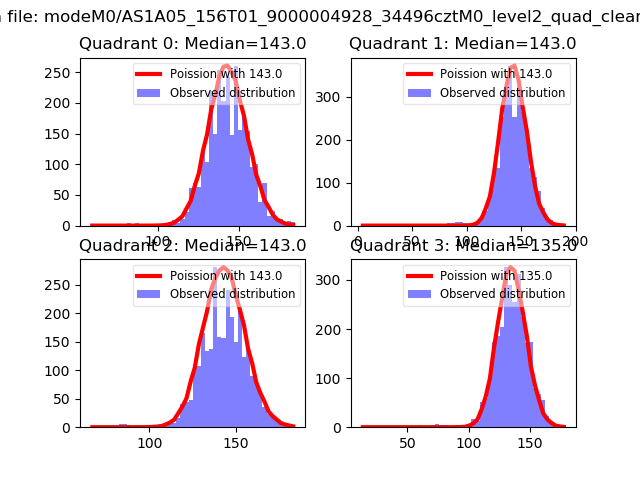 |
 |
| Quadrant-wise count rates Data is divided into 100 sec bins |
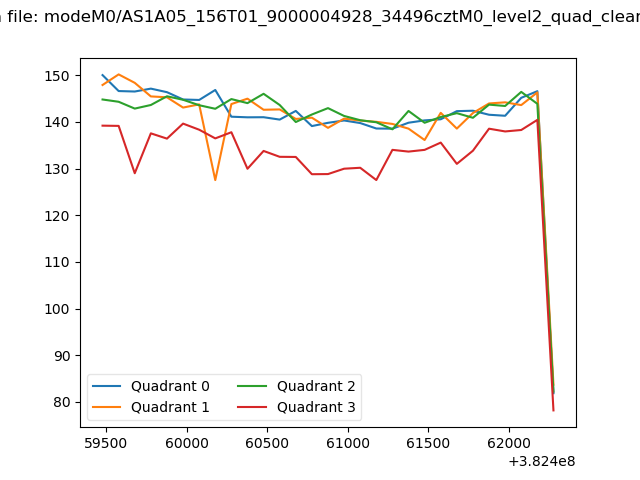 |
|
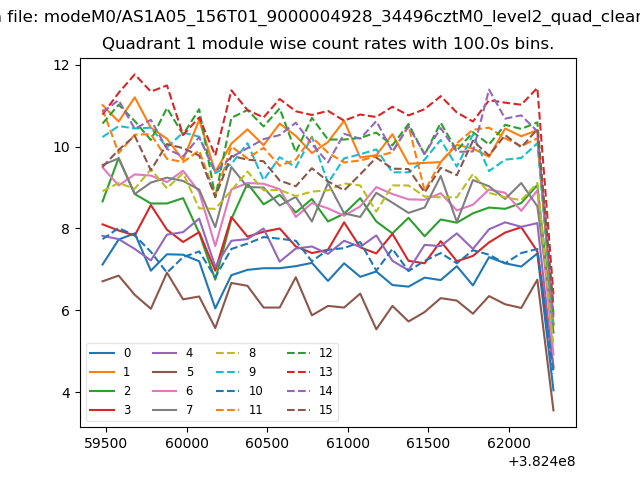
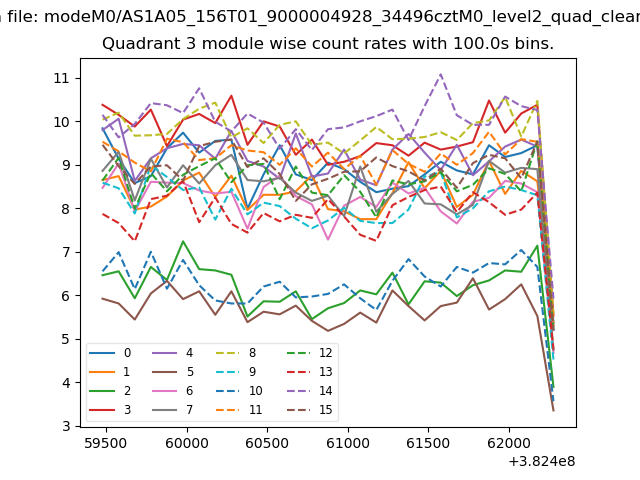
| Module-wise count rates for Quadrant A Data is divided into 100 sec bins |
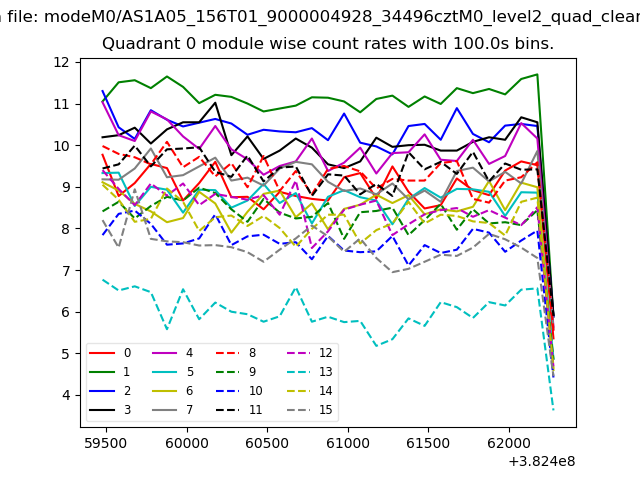 |
 |
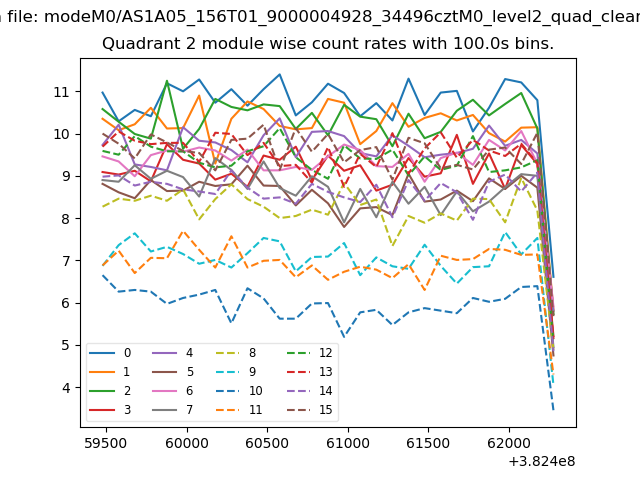
| Module-wise count rates for Quadrant B Data is divided into 100 sec bins |
 |
 |
| Module-wise count rates for Quadrant C Data is divided into 100 sec bins |
 |
 |
| Module-wise count rates for Quadrant D Data is divided into 100 sec bins |
 |
 |
| Parameter | Plot |
|---|---|
| CZT HV Monitor |  |
| D_VDD | 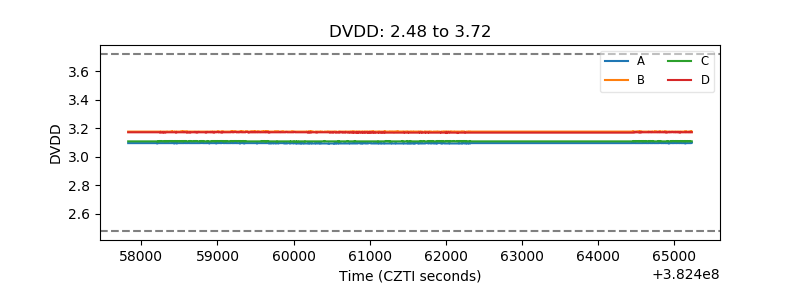 |
| Temperature 1 | 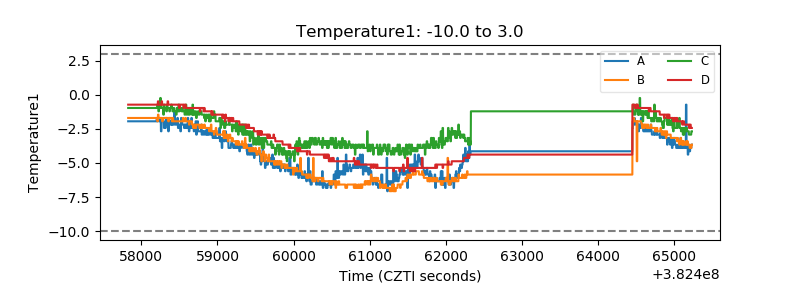 |
| Veto HV Monitor | 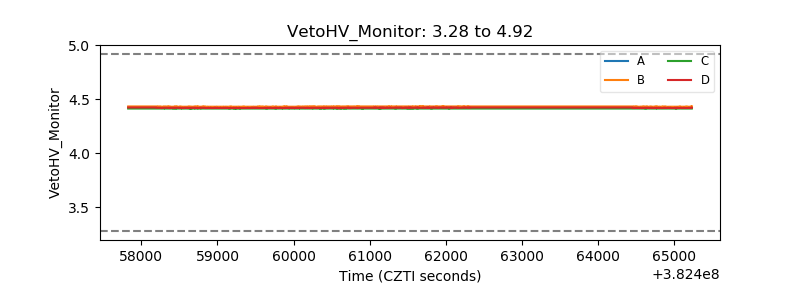 |
| Veto LLD | 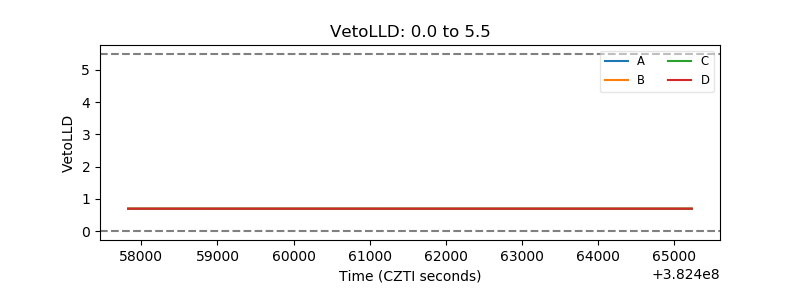 |
| Alpha Counter | 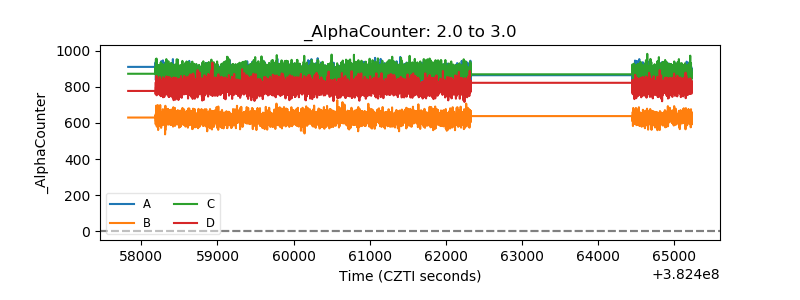 |
| _CPM_Rate | 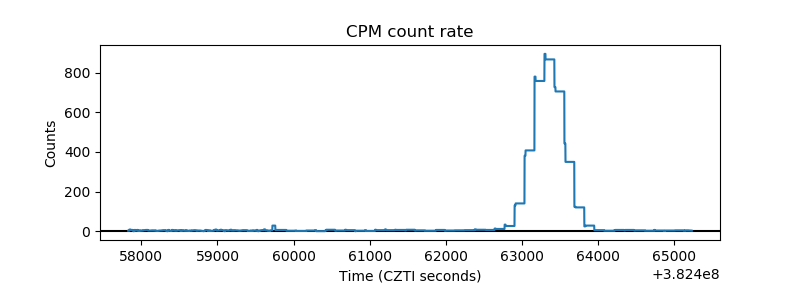 |
| CZT Counter | 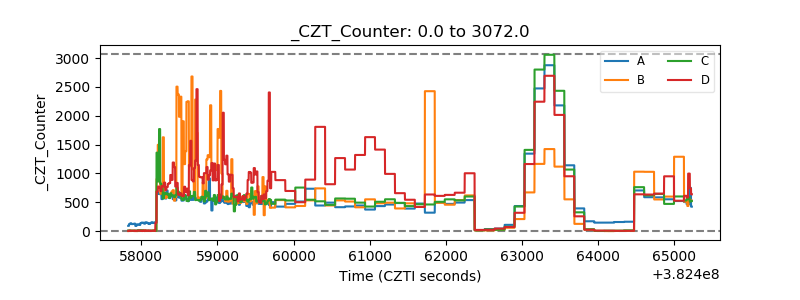 |
| +2.5 Volts monitor | 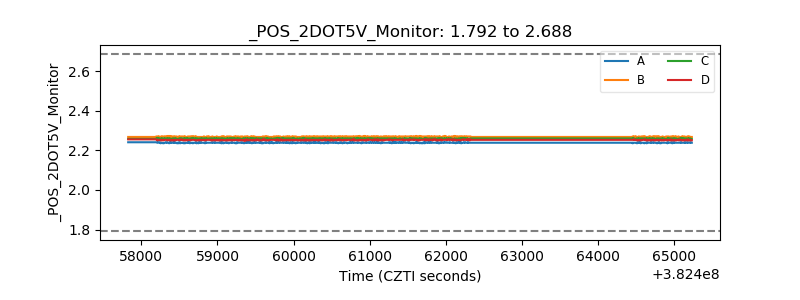 |
| +5 Volts monitor | 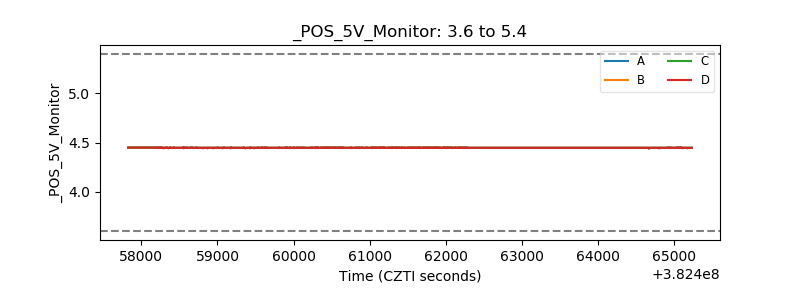 |
| _ROLL_ROT | 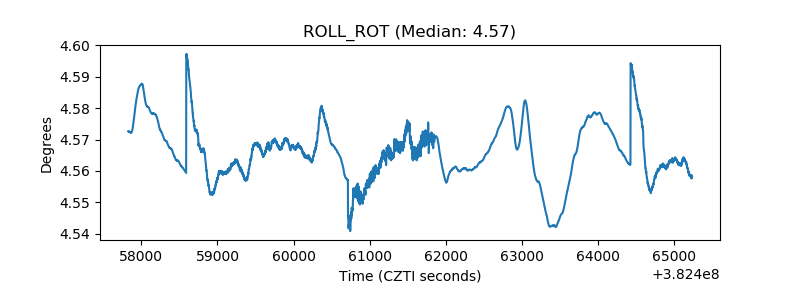 |
| _Roll_DEC | 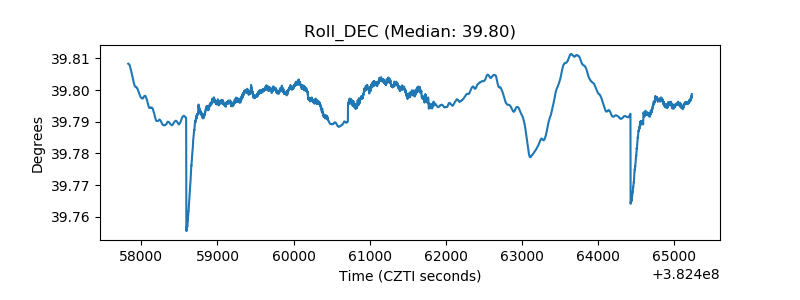 |
| _Roll_RA | 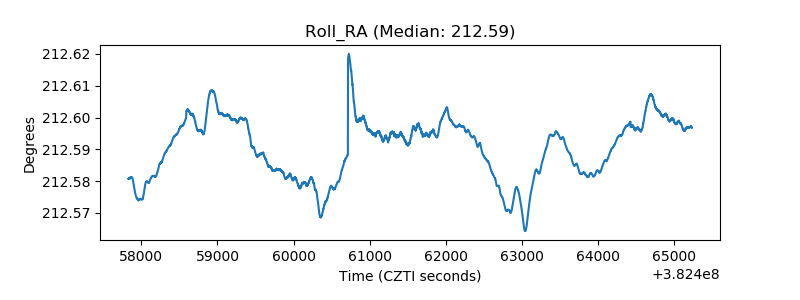 |
| Veto Counter | 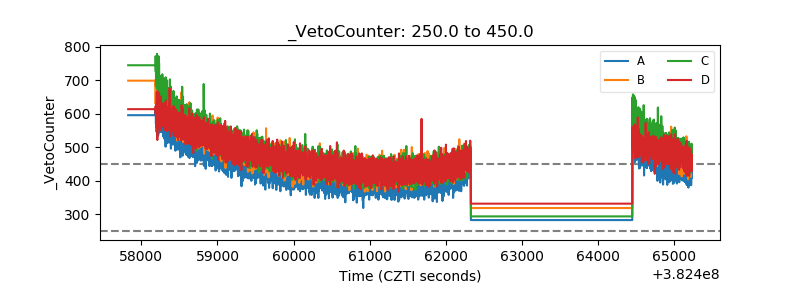 |