| Param | Original file | Final file |
|---|---|---|
| Filename | modeM0/AS1A10_071T14_9000004924_34485cztM0_level2.evt | modeM0/AS1A10_071T14_9000004924_34485cztM0_level2_quad_clean.evt |
| Size (bytes) | 576,976,320 | 78,120,000 |
| Size | 550.2 MB | 74.5 MB |
| Events in quadrant A | 4,636,353 | 475,400 |
| Events in quadrant B | 4,535,883 | 489,749 |
| Events in quadrant C | 3,398,217 | 487,755 |
| Events in quadrant D | 4,469,617 | 466,139 |
| Mode M0 | |||
|---|---|---|---|
| Quadrant | BADHDUFLAG | Total packets | Discarded packets |
| A | 0 | 18118 | 3 |
| B | 0 | 17825 | 2 |
| C | 0 | 14079 | 2 |
| D | 0 | 17640 | 2 |
| Mode SS | |||
|---|---|---|---|
| Quadrant | BADHDUFLAG | Total packets | Discarded packets |
| A | 0 | 134 | 0 |
| B | 0 | 134 | 0 |
| C | 0 | 134 | 0 |
| D | 0 | 134 | 0 |
| Mode M9 | |||
|---|---|---|---|
| Quadrant | BADHDUFLAG | Total packets | Discarded packets |
| A | 0 | 28 | 0 |
| B | 0 | 28 | 0 |
| C | 0 | 28 | 0 |
| D | 0 | 28 | 0 |
| Quadrant | Total seconds | Saturated seconds | Saturation percentage |
|---|---|---|---|
| A | 6392 | 755 | 11.811640% |
| B | 6392 | 565 | 8.839174% |
| C | 6392 | 34 | 0.531915% |
| D | 6392 | 240 | 3.754693% |
Noise dominated data is calculated using 1-second bins in cleaned event files. If a bin has >2000 counts, and if more than 50% of those come from <1% of pixels, then it is considered to be noise-dominated and hence unusable.
| Quadrant | # 1 sec bins | Bins with >0 counts | Bins with >2000 counts | High rate bins dominated by noise | Noise dominated (total time) | Noise dominated (detector-on time) | Marked lightcurve |
|---|---|---|---|---|---|---|---|
| A | 9257 | 6394 | 479 | 479 | 5.17% | 7.49% | 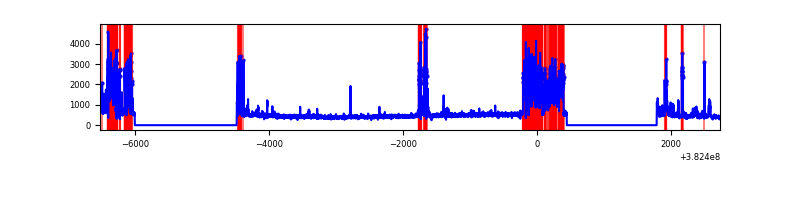 |
| B | 9257 | 6394 | 335 | 335 | 3.62% | 5.24% | 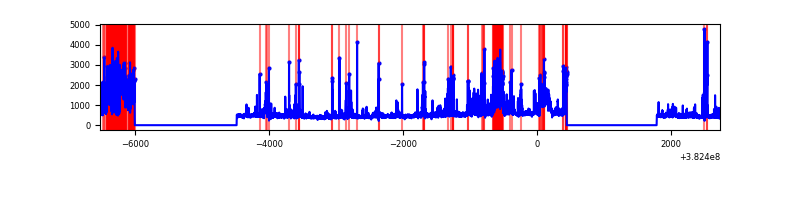 |
| C | 9257 | 6394 | 23 | 23 | 0.25% | 0.36% | 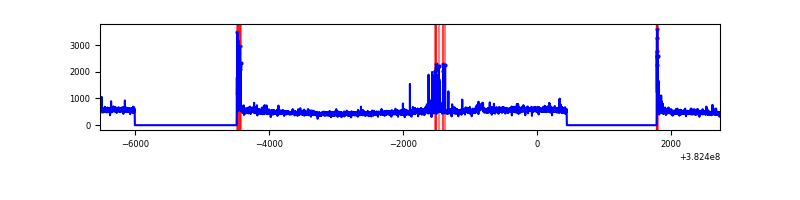 |
| D | 9257 | 6394 | 183 | 183 | 1.98% | 2.86% | 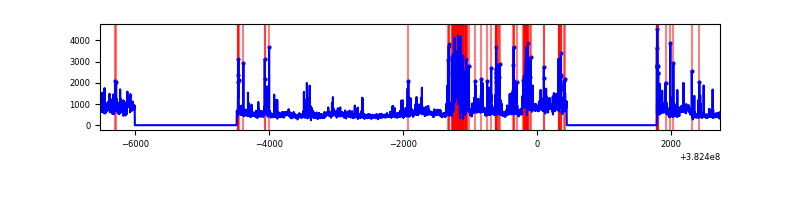 |
Top three noisy pixels from each quadrant. If the there are fewer than three noisy pixels in the level2.evt file, extra rows are filled as -1
| Pixel properties | Quadrant properties | ||||||
|---|---|---|---|---|---|---|---|
| Quadrant | DetID | PixID | Counts | Sigma | Mean | Median | Sigma |
| A | 15 | 169 | 1794227 | 12530.14 | 713 | 700 | 143.1 |
| A | 10 | 83 | 36454 | 249.79 | 713 | 700 | 143.1 |
| A | 9 | 143 | 17061 | 114.3 | 713 | 700 | 143.1 |
| B | 5 | 172 | 1269939 | 9075.94 | 722 | 705 | 139.8 |
| B | 0 | 189 | 134904 | 959.62 | 722 | 705 | 139.8 |
| B | 0 | 229 | 134761 | 958.6 | 722 | 705 | 139.8 |
| C | 15 | 214 | 270556 | 1592.94 | 733 | 739 | 169.4 |
| C | 15 | 208 | 107589 | 630.82 | 733 | 739 | 169.4 |
| C | 0 | 10 | 94438 | 553.18 | 733 | 739 | 169.4 |
| D | 8 | 195 | 659265 | 3680.6 | 723 | 703 | 178.9 |
| D | 2 | 250 | 544282 | 3037.98 | 723 | 703 | 178.9 |
| D | 13 | 249 | 87955 | 487.64 | 723 | 703 | 178.9 |
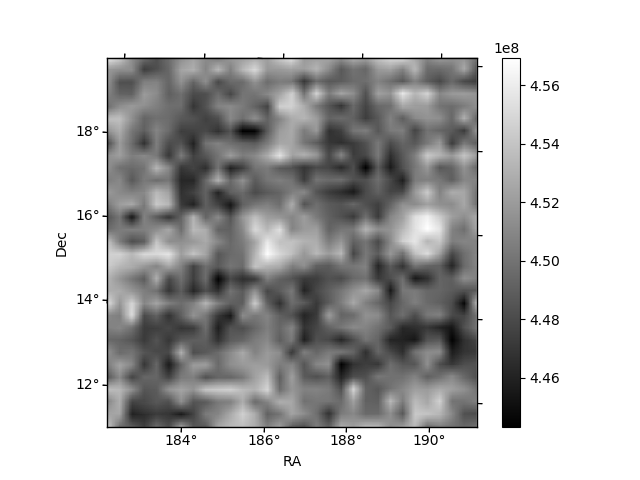
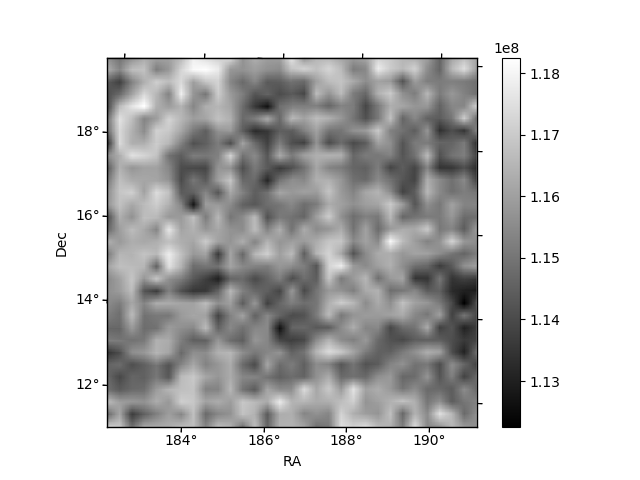
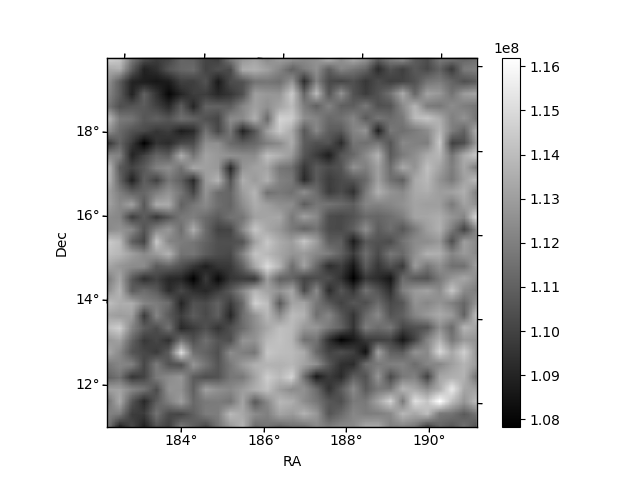
Histogram calculated using DETX and DETY for each event in the final _common_clean file
| Quadrant A | 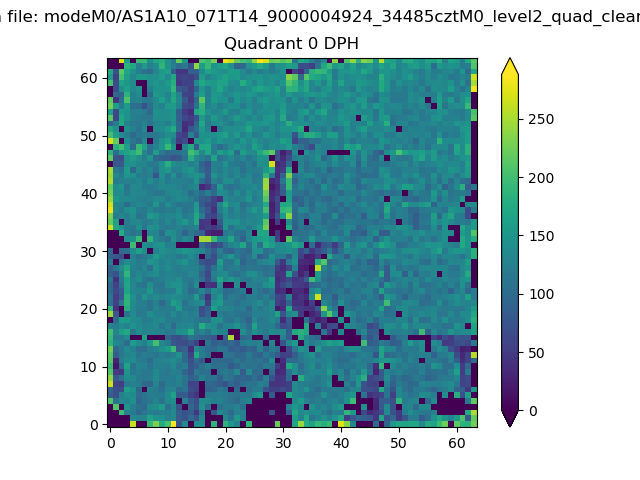 |
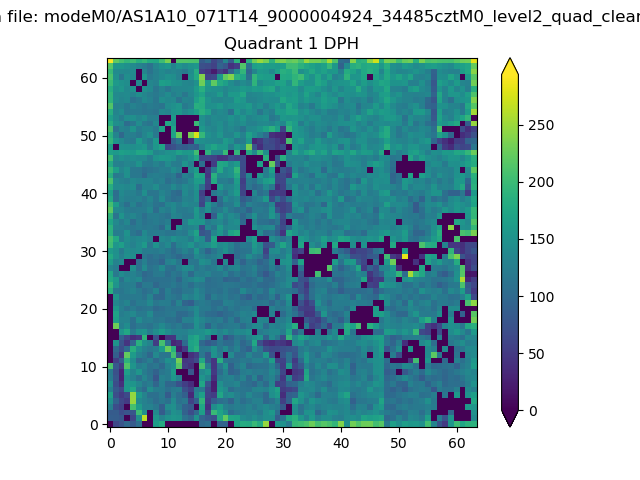 |
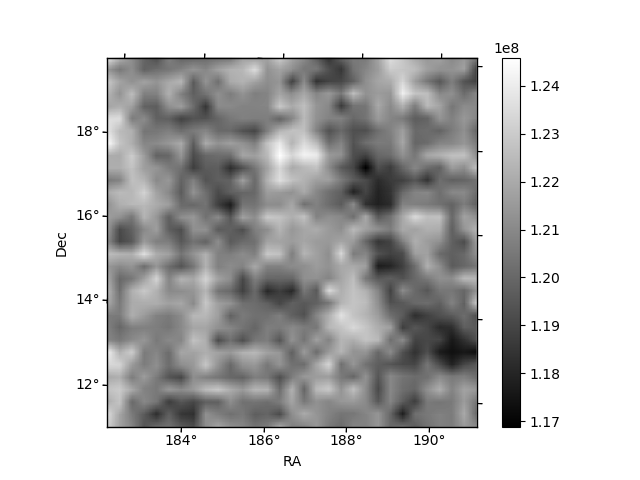
Quadrant B |
|---|---|---|---|
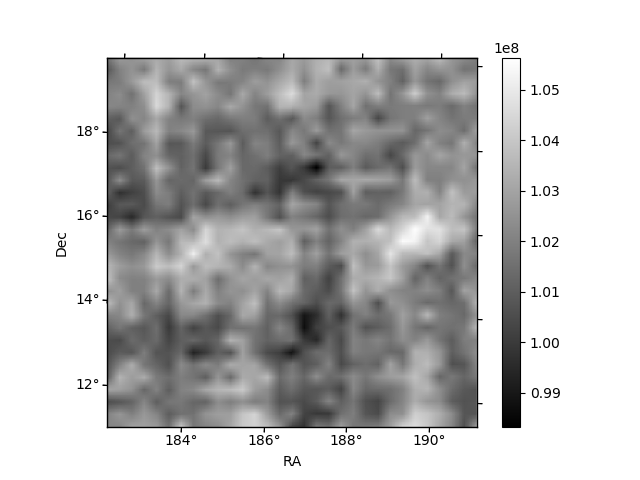
| Quadrant D | 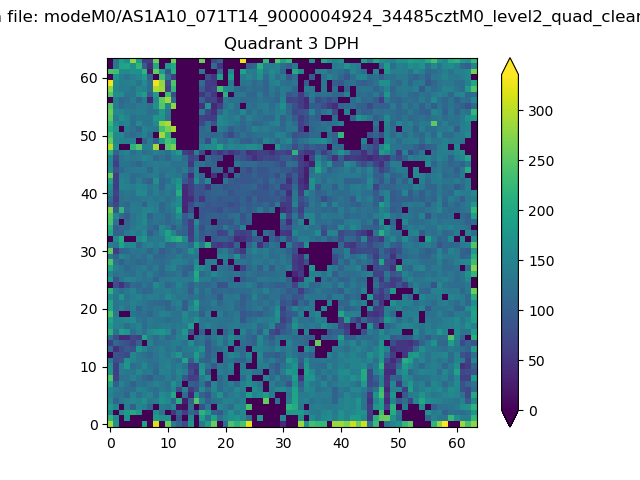 |
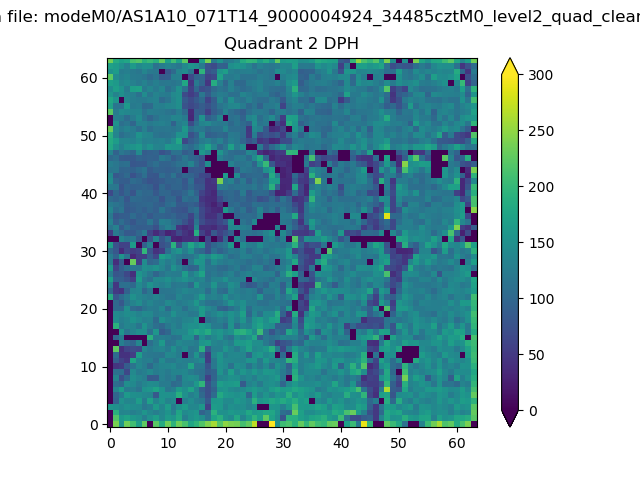 |
Quadrant C |
| Plot type | Count rate plots | Images |
|---|---|---|
| Comparison with Poisson distribution Blue bars denote a histogram of data divided into 1 sec bins. Red curve is a Poisson curve with rate = median count rate of data. |
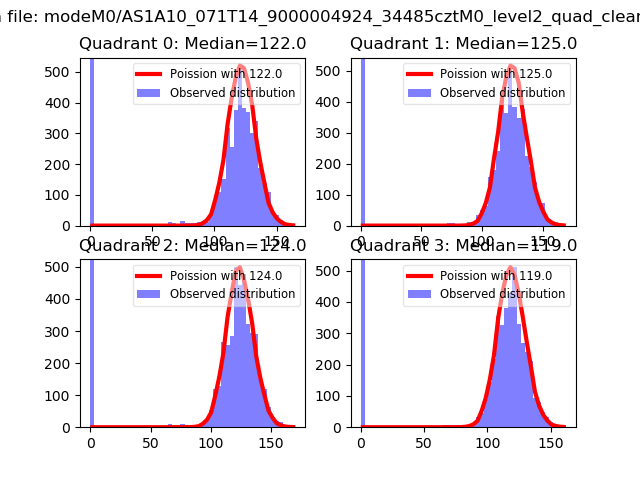 |
 |
| Quadrant-wise count rates Data is divided into 100 sec bins |
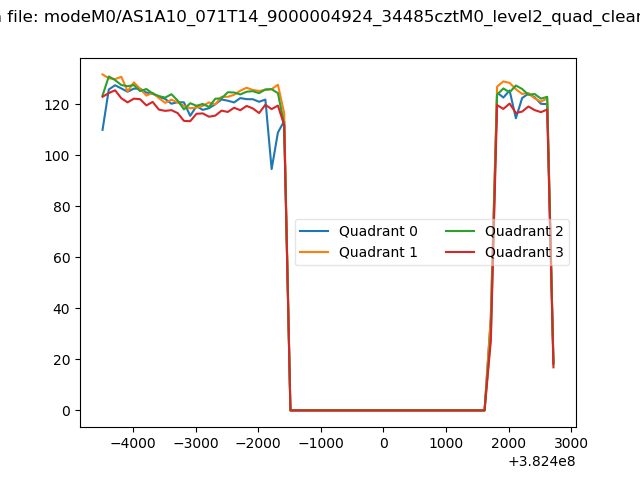 |
|
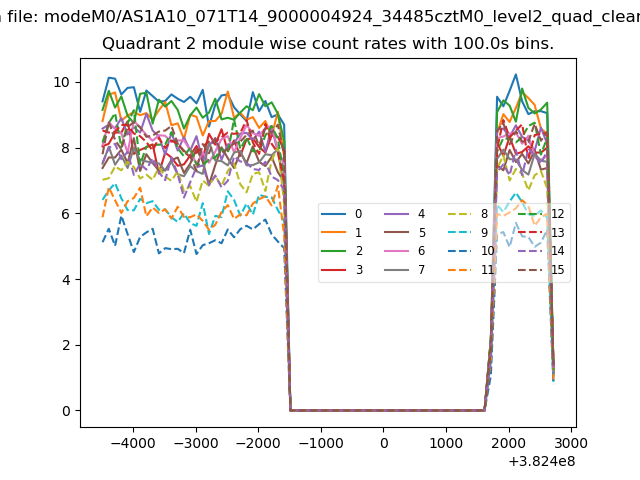
| Module-wise count rates for Quadrant A Data is divided into 100 sec bins |
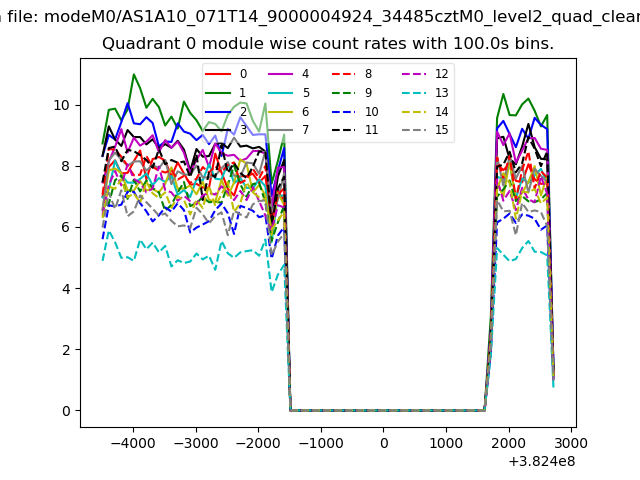 |
 |
| Module-wise count rates for Quadrant B Data is divided into 100 sec bins |
 |
 |
| Module-wise count rates for Quadrant C Data is divided into 100 sec bins |
 |
 |
| Module-wise count rates for Quadrant D Data is divided into 100 sec bins |
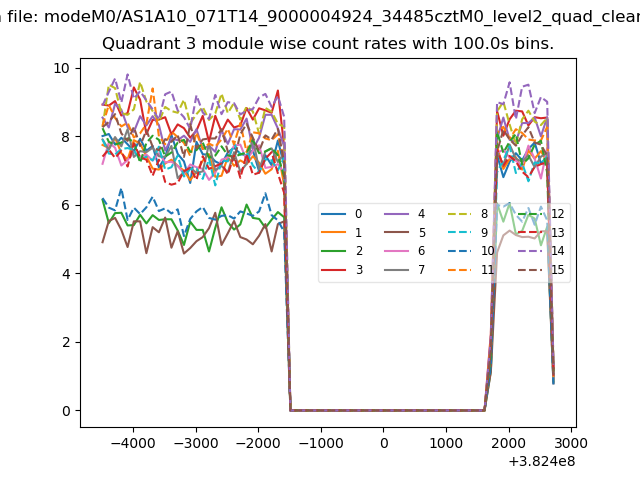 |
 |
| Parameter | Plot |
|---|---|
| CZT HV Monitor | 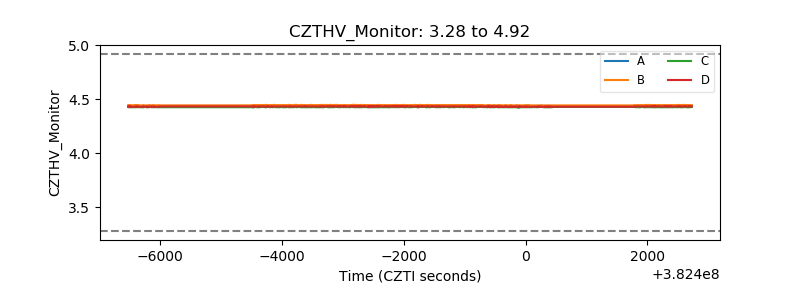 |
| D_VDD | 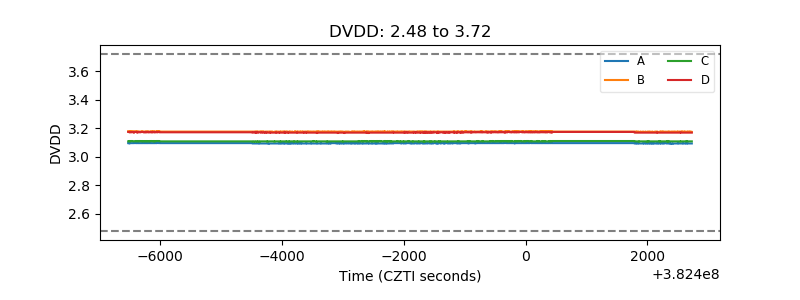 |
| Temperature 1 | 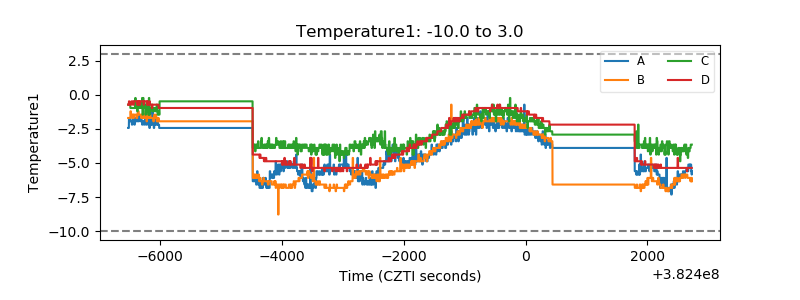 |
| Veto HV Monitor | 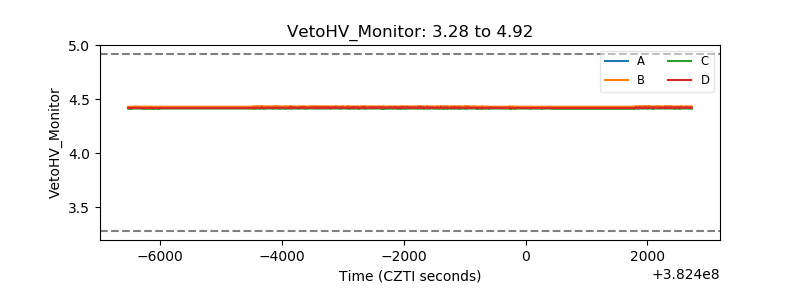 |
| Veto LLD | 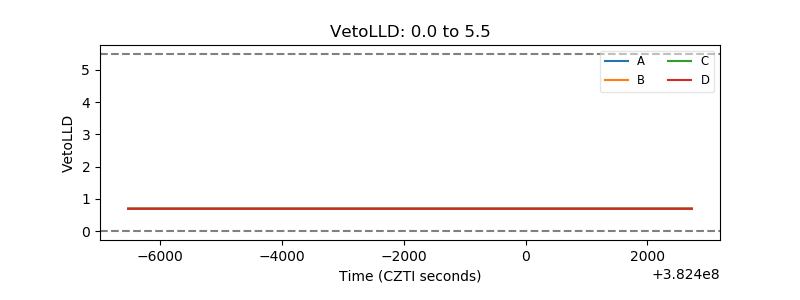 |
| Alpha Counter | 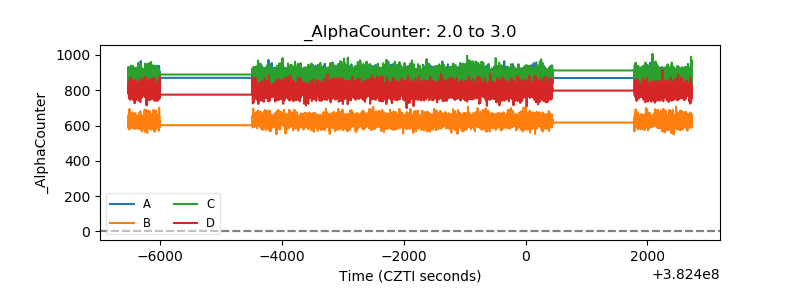 |
| _CPM_Rate | 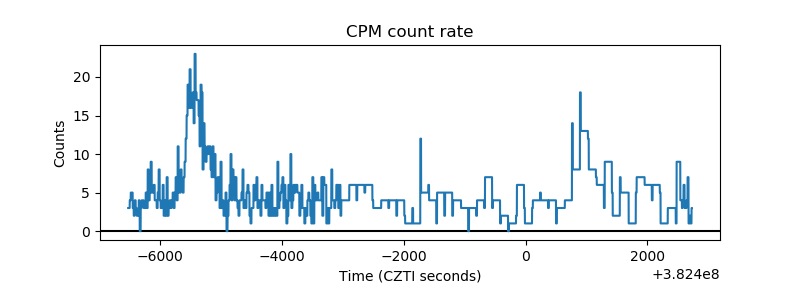 |
| CZT Counter | 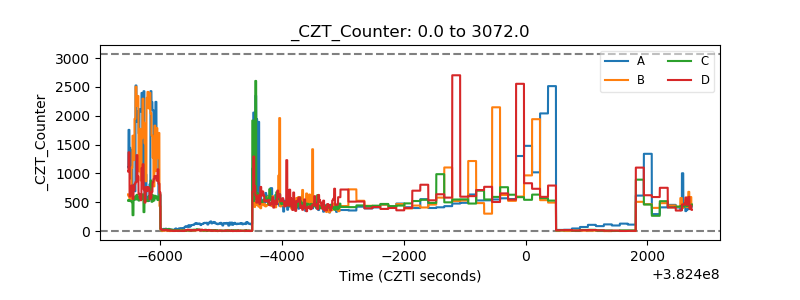 |
| +2.5 Volts monitor | 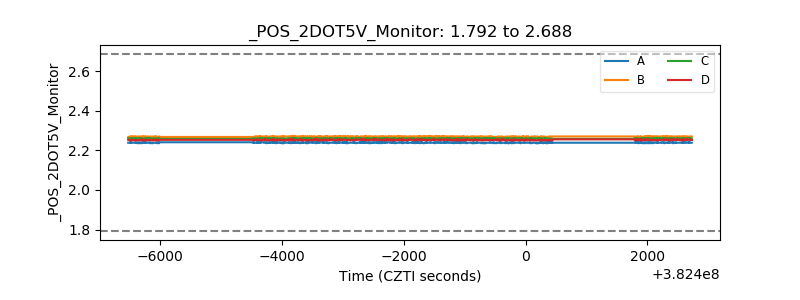 |
| +5 Volts monitor | 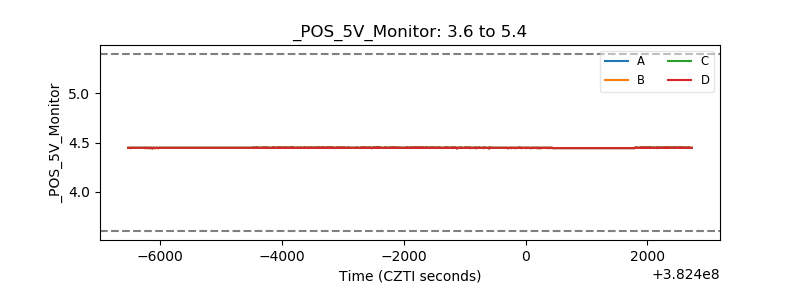 |
| _ROLL_ROT | 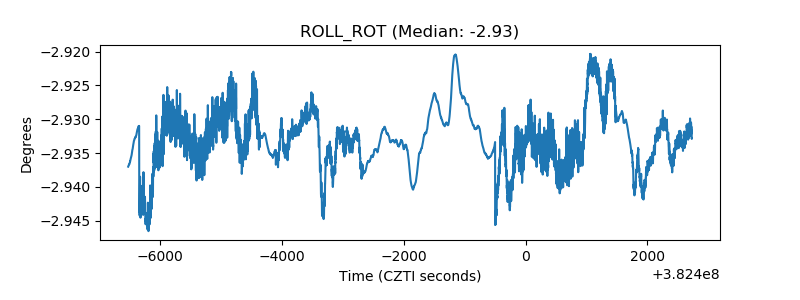 |
| _Roll_DEC | 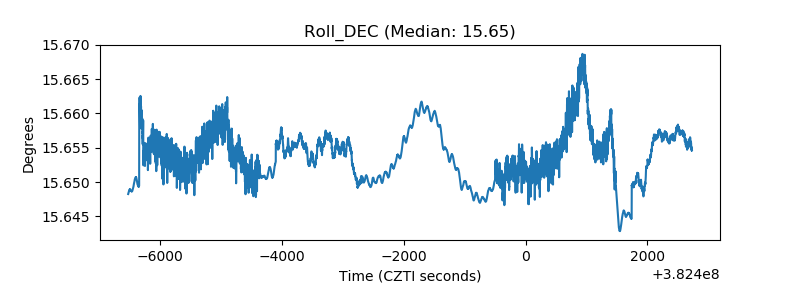 |
| _Roll_RA | 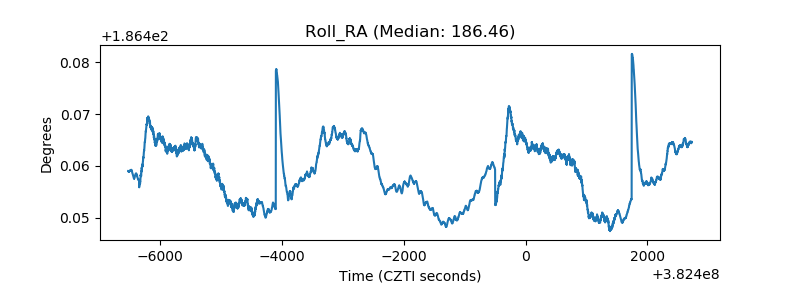 |
| Veto Counter | 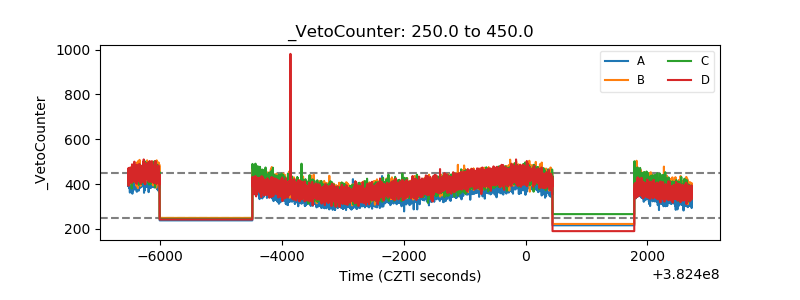 |