| Param | Original file | Final file |
|---|---|---|
| Filename | modeM0/AS1A10_071T14_9000004924cztM0_level2_bc.evt | modeM0/AS1A10_071T14_9000004924cztM0_level2_quad_clean.evt |
| Size (bytes) | 1,362,055,680 | 436,400,640 |
| Size | 1.3 GB | 416.2 MB |
| Events in quadrant A | 9,112,772 | 2,816,012 |
| Events in quadrant B | 9,233,138 | 2,872,913 |
| Events in quadrant C | 7,971,483 | 2,867,815 |
| Events in quadrant D | 12,986,104 | 2,699,527 |
| Mode M0 | |||
|---|---|---|---|
| Quadrant | BADHDUFLAG | Total packets | Discarded packets |
| A | 0 | 71801 | 0 |
| B | 0 | 72368 | 0 |
| C | 0 | 62326 | 0 |
| D | 0 | 82467 | 0 |
| Mode SS | |||
|---|---|---|---|
| Quadrant | BADHDUFLAG | Total packets | Discarded packets |
| A | 0 | 584 | 0 |
| B | 0 | 584 | 0 |
| C | 0 | 584 | 0 |
| D | 0 | 584 | 0 |
| Mode M9 | |||
|---|---|---|---|
| Quadrant | BADHDUFLAG | Total packets | Discarded packets |
| A | 0 | 131 | 0 |
| B | 0 | 131 | 0 |
| C | 0 | 131 | 0 |
| D | 0 | 131 | 0 |
| Quadrant | Total seconds | Saturated seconds | Saturation percentage |
|---|---|---|---|
| A | 28552 | 1281 | 4.486551% |
| B | 28552 | 1637 | 5.733399% |
| C | 28552 | 148 | 0.518352% |
| D | 28552 | 1037 | 3.631970% |
Noise dominated data is calculated using 1-second bins in cleaned event files. If a bin has >2000 counts, and if more than 50% of those come from <1% of pixels, then it is considered to be noise-dominated and hence unusable.
| Quadrant | # 1 sec bins | Bins with >0 counts | Bins with >2000 counts | High rate bins dominated by noise | Noise dominated (total time) | Noise dominated (detector-on time) | Marked lightcurve |
|---|---|---|---|---|---|---|---|
| A | 41673 | 28558 | 38 | 38 | 0.09% | 0.13% | 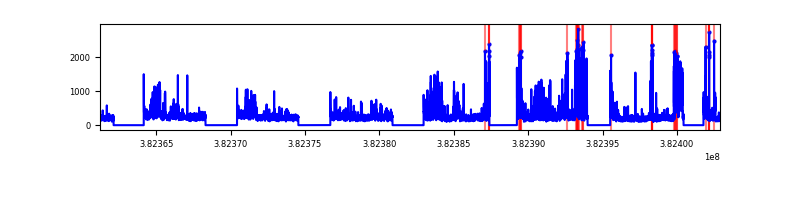 |
| B | 41673 | 28554 | 47 | 47 | 0.11% | 0.16% | 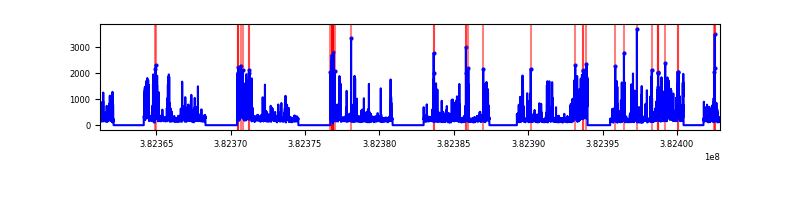 |
| C | 41673 | 28555 | 41 | 41 | 0.10% | 0.14% | 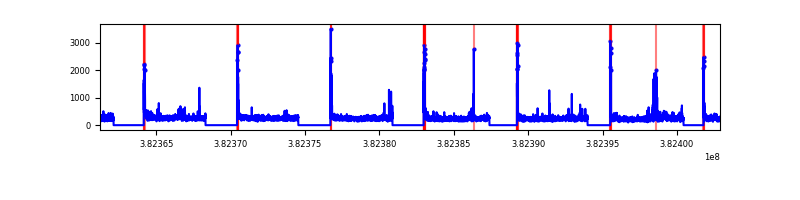 |
| D | 41673 | 28553 | 174 | 174 | 0.42% | 0.61% | 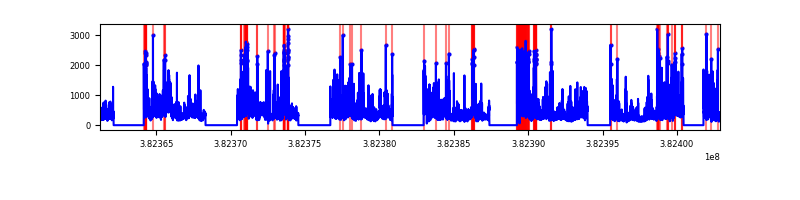 |
Top three noisy pixels from each quadrant. If the there are fewer than three noisy pixels in the level2.evt file, extra rows are filled as -1
| Pixel properties | Quadrant properties | ||||||
|---|---|---|---|---|---|---|---|
| Quadrant | DetID | PixID | Counts | Sigma | Mean | Median | Sigma |
| A | 15 | 169 | 2844178 | 8404.79 | 1551 | 1528 | 338.2 |
| A | 10 | 83 | 136461 | 398.95 | 1551 | 1528 | 338.2 |
| A | 13 | 254 | 50230 | 144.0 | 1551 | 1528 | 338.2 |
| B | 5 | 172 | 2420844 | 8009.68 | 1545 | 1514 | 302.1 |
| B | 0 | 189 | 264193 | 869.65 | 1545 | 1514 | 302.1 |
| B | 0 | 229 | 207738 | 682.75 | 1545 | 1514 | 302.1 |
| C | 15 | 214 | 1146161 | 3255.91 | 1562 | 1558 | 351.5 |
| C | 0 | 10 | 386936 | 1096.24 | 1562 | 1558 | 351.5 |
| C | 15 | 208 | 154992 | 436.45 | 1562 | 1558 | 351.5 |
| D | 8 | 195 | 2877371 | 7922.89 | 1548 | 1507 | 363.0 |
| D | 7 | 223 | 1107288 | 3046.38 | 1548 | 1507 | 363.0 |
| D | 2 | 250 | 729383 | 2005.27 | 1548 | 1507 | 363.0 |
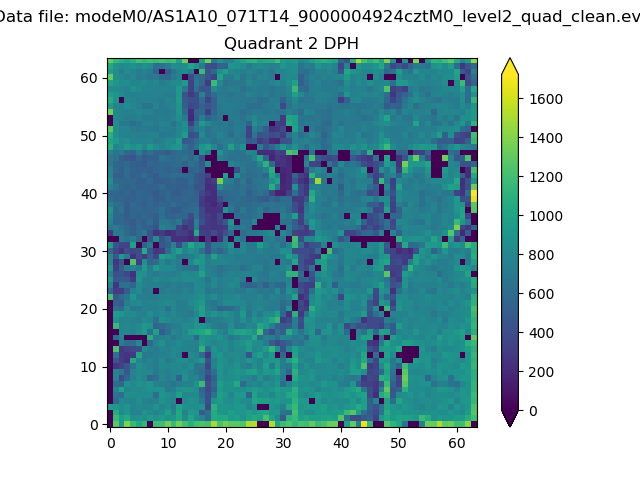
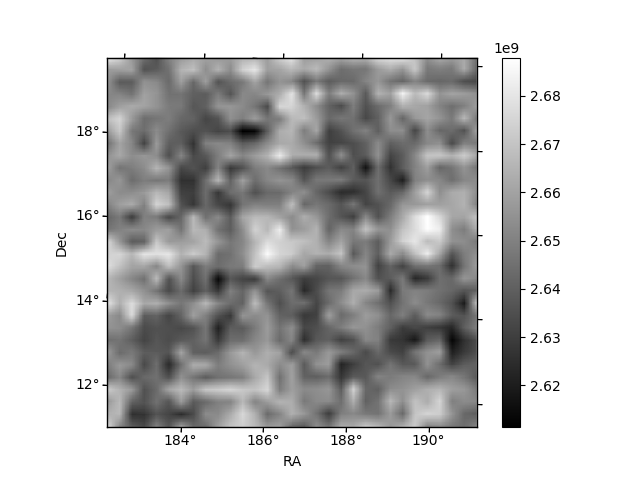
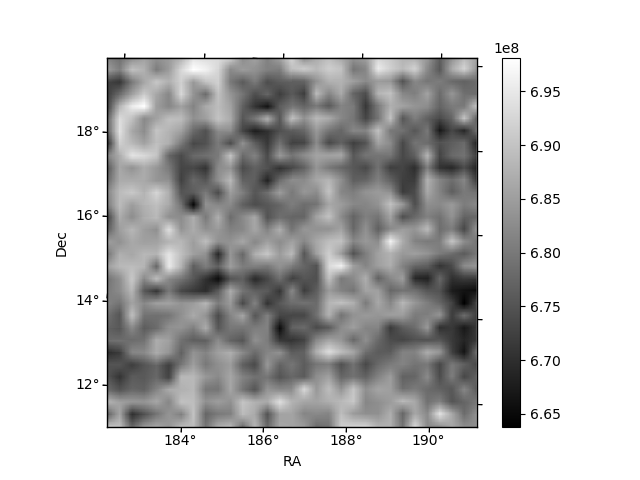
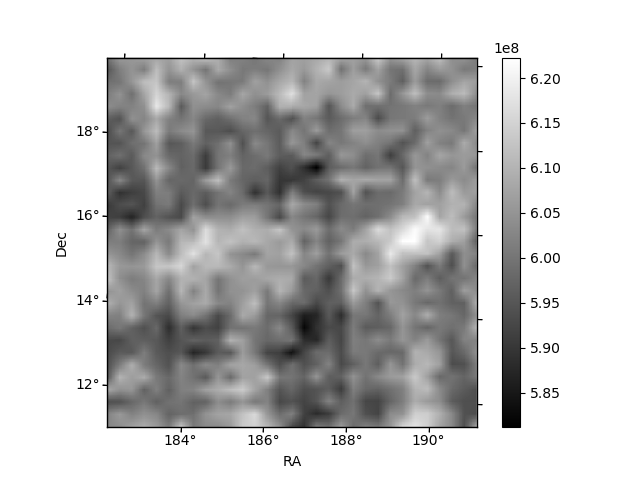
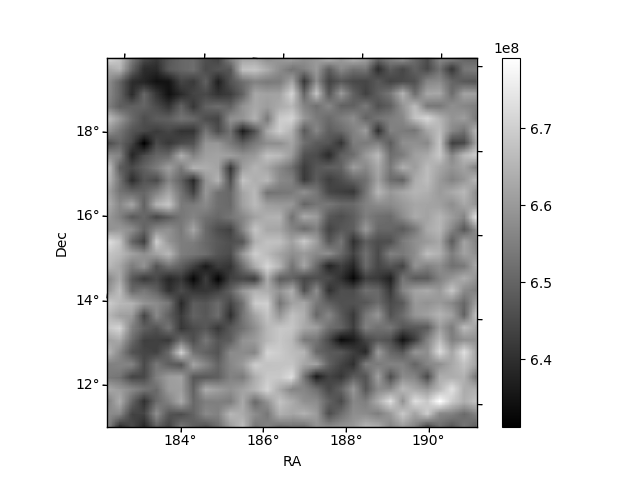
Histogram calculated using DETX and DETY for each event in the final _common_clean file
| Quadrant A | 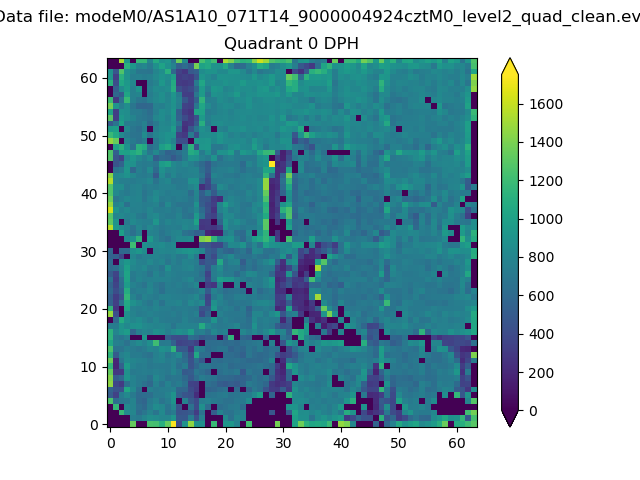 |
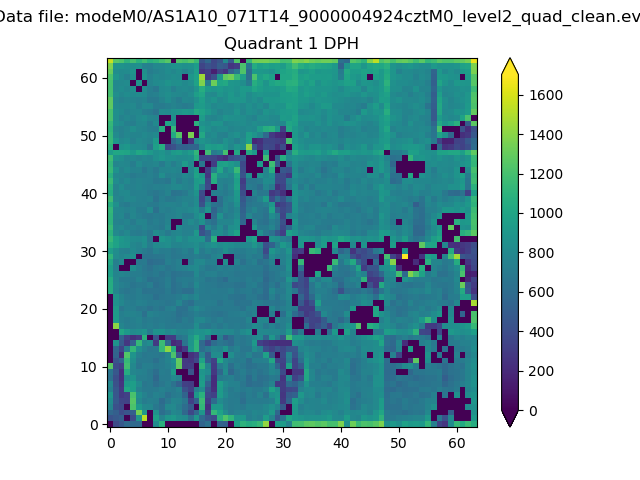 |
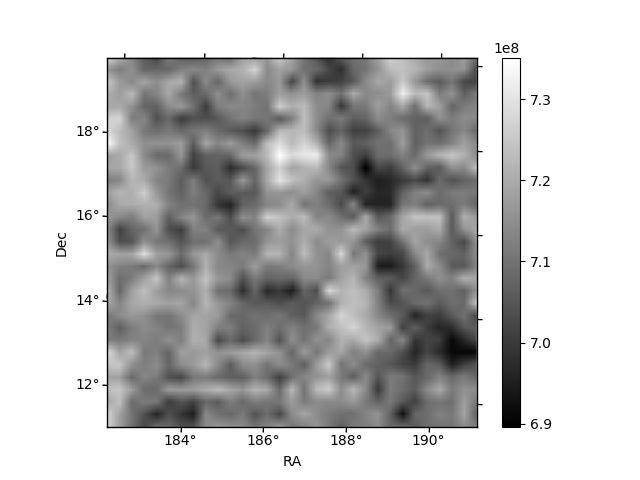
Quadrant B |
|---|---|---|---|
| Quadrant D | 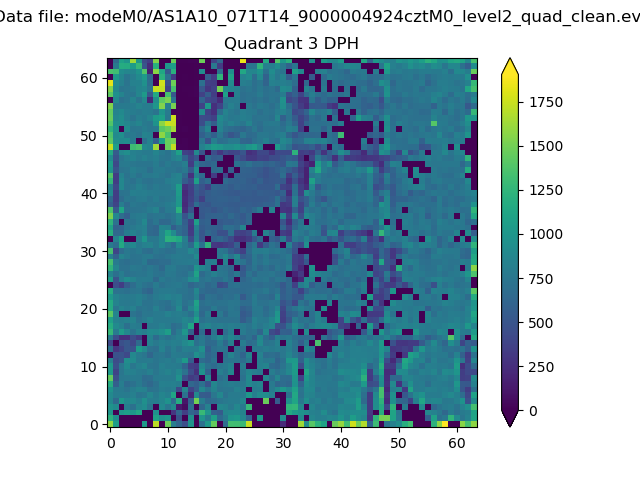 |
 |
Quadrant C |
| Plot type | Count rate plots | Images |
|---|---|---|
| Comparison with Poisson distribution Blue bars denote a histogram of data divided into 1 sec bins. Red curve is a Poisson curve with rate = median count rate of data. |
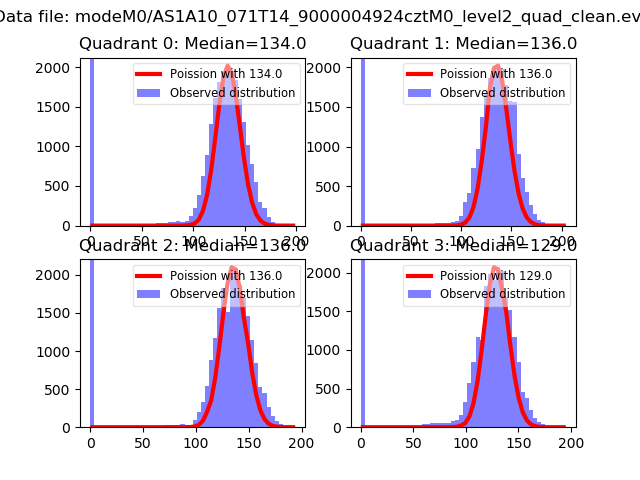 |
 |
| Quadrant-wise count rates Data is divided into 100 sec bins |
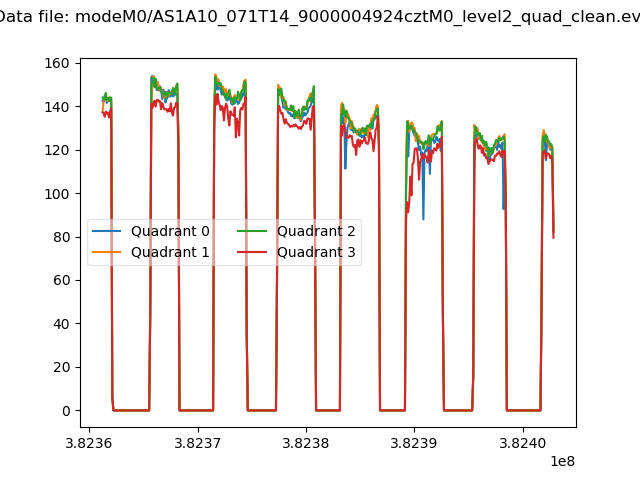 |
|
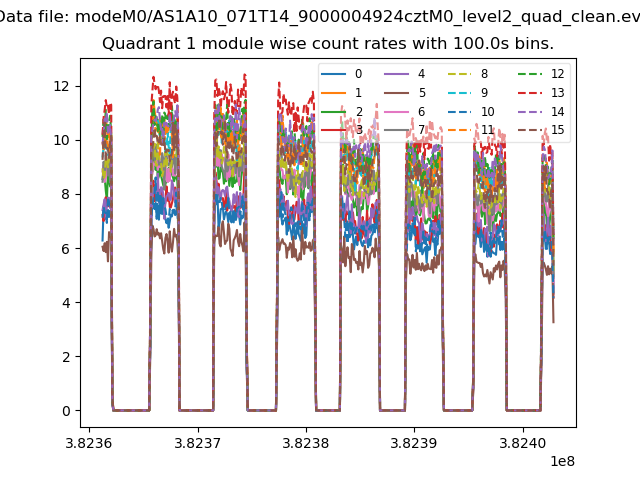
| Module-wise count rates for Quadrant A Data is divided into 100 sec bins |
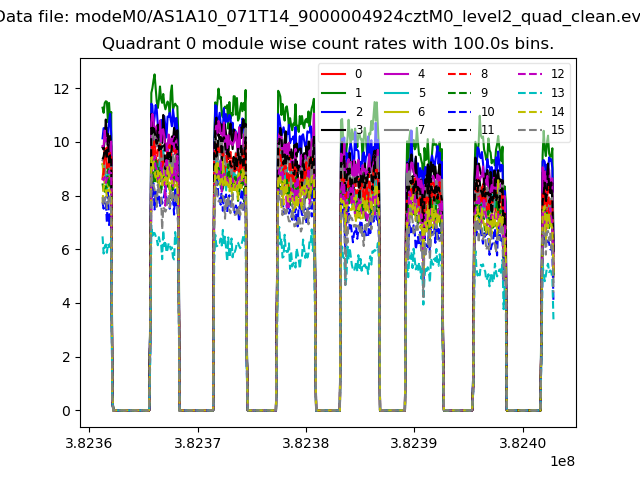 |
 |
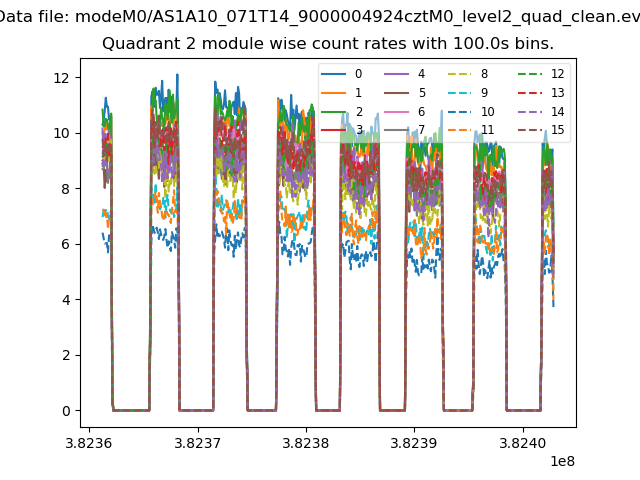
| Module-wise count rates for Quadrant B Data is divided into 100 sec bins |
 |
 |
| Module-wise count rates for Quadrant C Data is divided into 100 sec bins |
 |
 |
| Module-wise count rates for Quadrant D Data is divided into 100 sec bins |
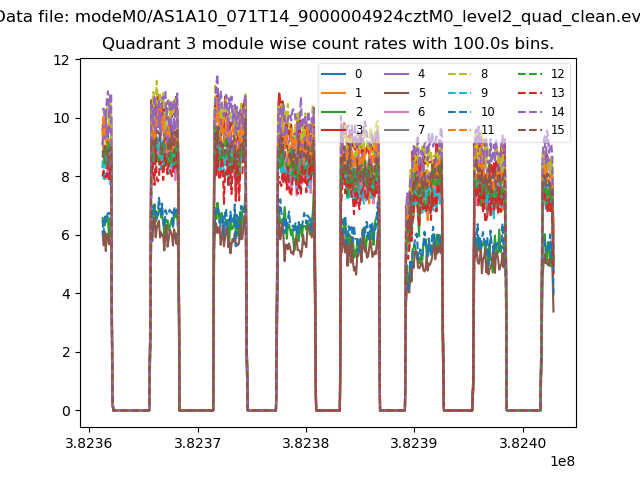 |
 |
| Parameter | Plot |
|---|---|
| CZT HV Monitor | 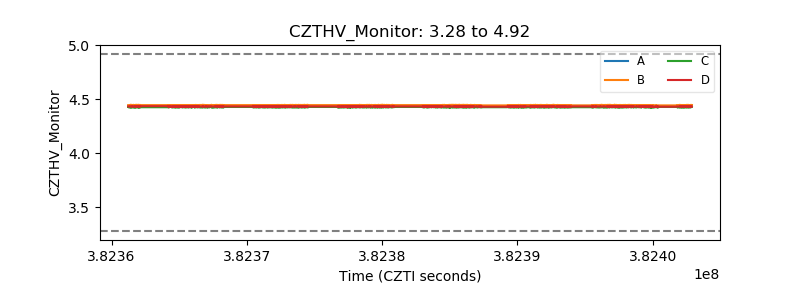 |
| D_VDD | 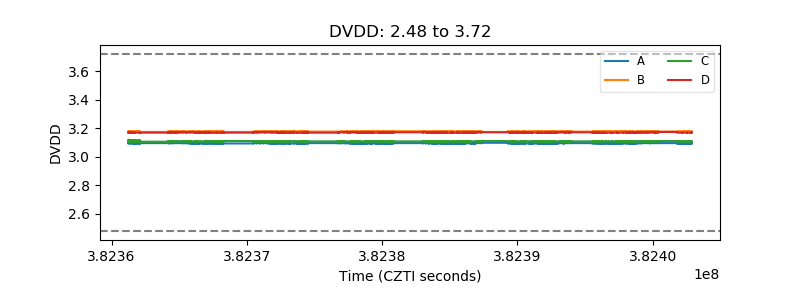 |
| Temperature 1 | 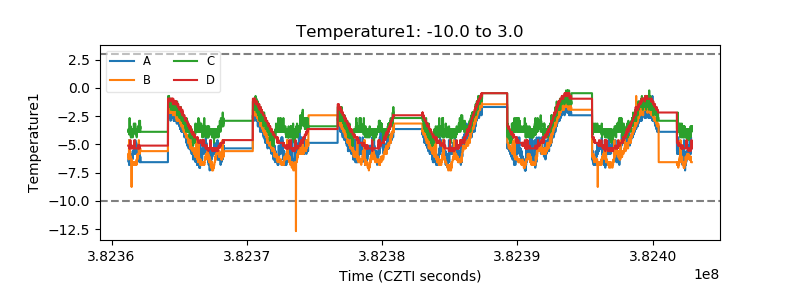 |
| Veto HV Monitor | 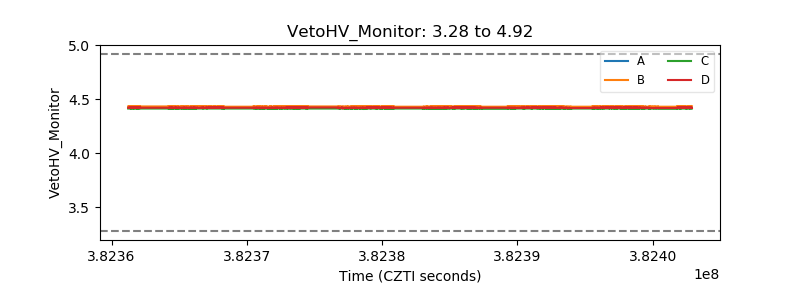 |
| Veto LLD | 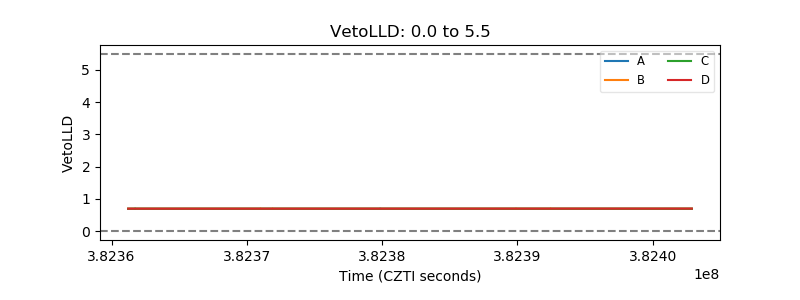 |
| Alpha Counter | 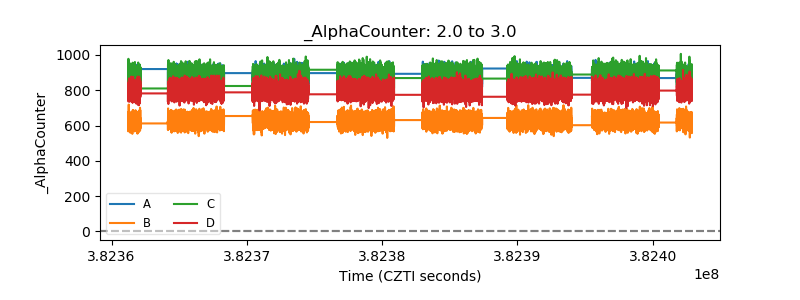 |
| _CPM_Rate | 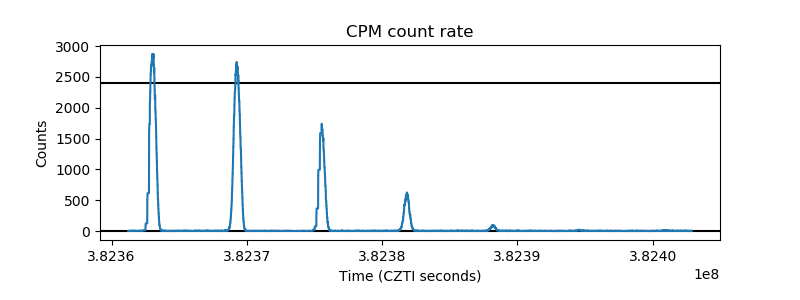 |
| CZT Counter | 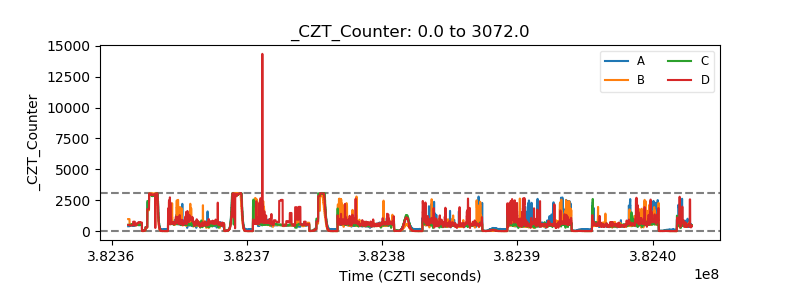 |
| +2.5 Volts monitor | 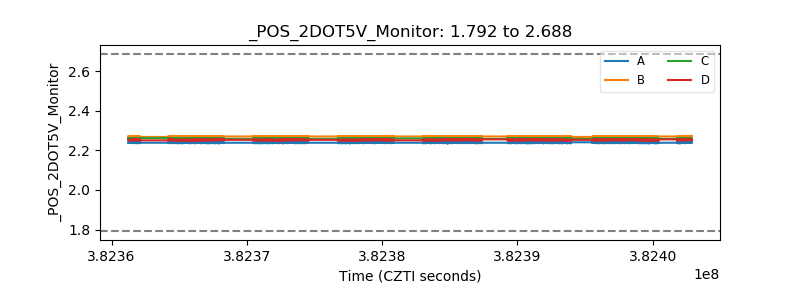 |
| +5 Volts monitor | 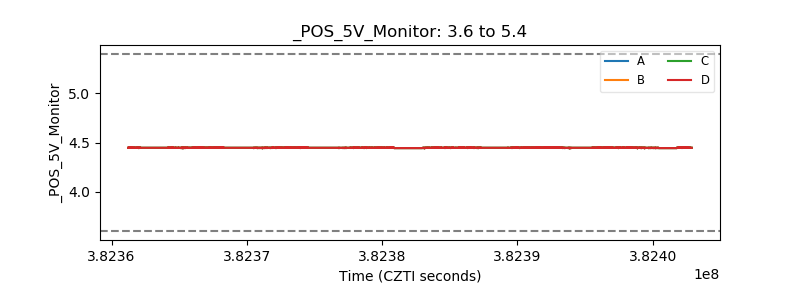 |
| _ROLL_ROT | 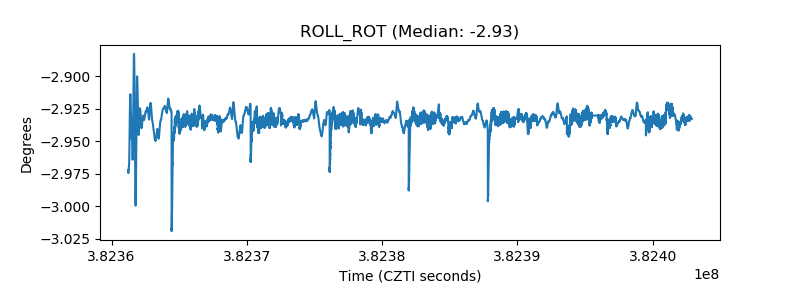 |
| _Roll_DEC | 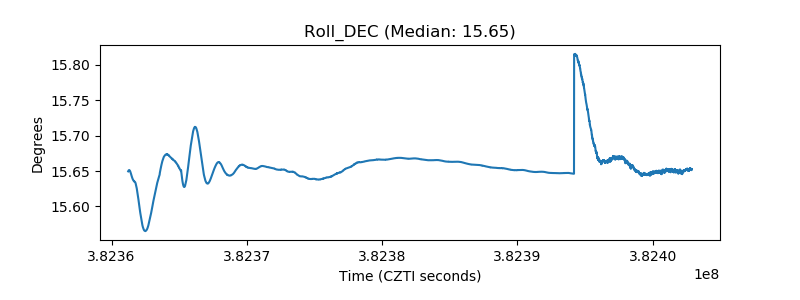 |
| _Roll_RA | 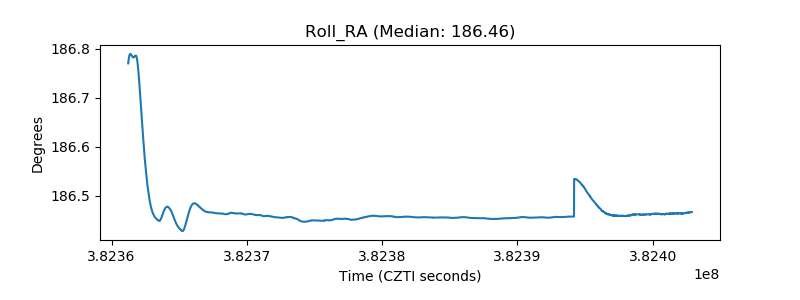 |
| Veto Counter | 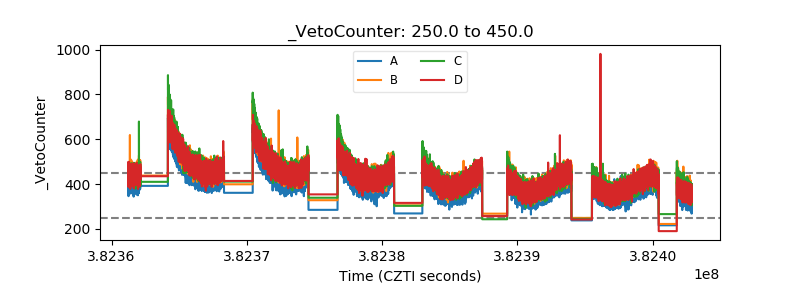 |