| Param | Original file | Final file |
|---|---|---|
| Filename | modeM0/AS1A05_118T04_9000004926_34495cztM0_level2.evt | modeM0/AS1A05_118T04_9000004926_34495cztM0_level2_quad_clean.evt |
| Size (bytes) | 1,678,619,520 | 218,756,160 |
| Size | 1.6 GB | 208.6 MB |
| Events in quadrant A | 11,693,630 | 1,307,800 |
| Events in quadrant B | 11,592,663 | 1,349,155 |
| Events in quadrant C | 10,389,334 | 1,334,210 |
| Events in quadrant D | 15,798,531 | 1,240,729 |
| Mode M9 | |||
|---|---|---|---|
| Quadrant | BADHDUFLAG | Total packets | Discarded packets |
| A | 0 | 61 | 0 |
| B | 0 | 61 | 0 |
| C | 0 | 61 | 0 |
| D | 0 | 61 | 0 |
| Mode SS | |||
|---|---|---|---|
| Quadrant | BADHDUFLAG | Total packets | Discarded packets |
| A | 0 | 412 | 0 |
| B | 0 | 412 | 0 |
| C | 0 | 412 | 0 |
| D | 0 | 412 | 0 |
| Mode M0 | |||
|---|---|---|---|
| Quadrant | BADHDUFLAG | Total packets | Discarded packets |
| A | 0 | 47742 | 5 |
| B | 0 | 47276 | 4 |
| C | 0 | 42991 | 4 |
| D | 0 | 60801 | 4 |
| Quadrant | Total seconds | Saturated seconds | Saturation percentage |
|---|---|---|---|
| A | 20230 | 630 | 3.114187% |
| B | 20230 | 500 | 2.471577% |
| C | 20230 | 57 | 0.281760% |
| D | 20230 | 568 | 2.807711% |
Noise dominated data is calculated using 1-second bins in cleaned event files. If a bin has >2000 counts, and if more than 50% of those come from <1% of pixels, then it is considered to be noise-dominated and hence unusable.
| Quadrant | # 1 sec bins | Bins with >0 counts | Bins with >2000 counts | High rate bins dominated by noise | Noise dominated (total time) | Noise dominated (detector-on time) | Marked lightcurve |
|---|---|---|---|---|---|---|---|
| A | 26321 | 20234 | 397 | 397 | 1.51% | 1.96% | 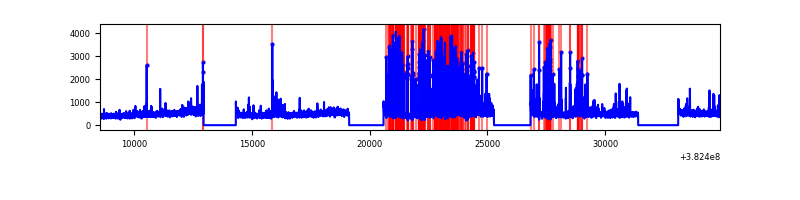 |
| B | 26321 | 20234 | 322 | 322 | 1.22% | 1.59% | 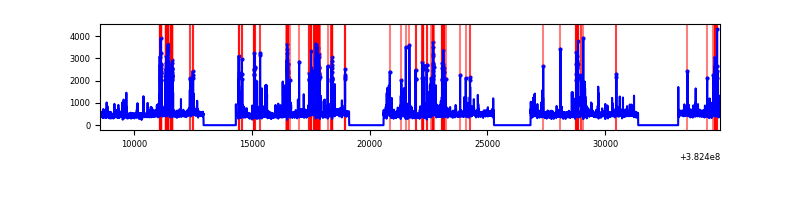 |
| C | 26321 | 20234 | 37 | 37 | 0.14% | 0.18% | 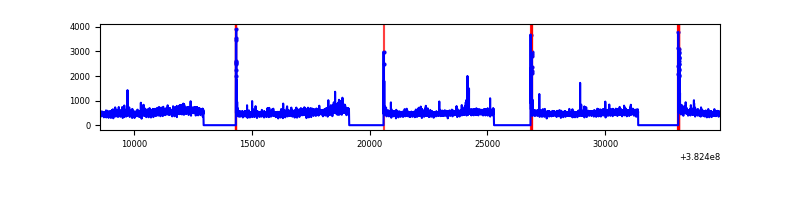 |
| D | 26321 | 20234 | 485 | 485 | 1.84% | 2.40% | 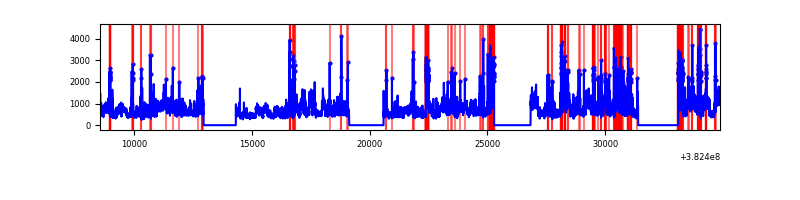 |
Top three noisy pixels from each quadrant. If the there are fewer than three noisy pixels in the level2.evt file, extra rows are filled as -1
| Pixel properties | Quadrant properties | ||||||
|---|---|---|---|---|---|---|---|
| Quadrant | DetID | PixID | Counts | Sigma | Mean | Median | Sigma |
| A | 15 | 169 | 2438027 | 5186.56 | 2354 | 2308 | 469.6 |
| A | 10 | 83 | 87658 | 181.74 | 2354 | 2308 | 469.6 |
| A | 4 | 48 | 37857 | 75.7 | 2354 | 2308 | 469.6 |
| B | 5 | 172 | 1484008 | 3320.16 | 2339 | 2272 | 446.3 |
| B | 0 | 189 | 514626 | 1148.04 | 2339 | 2272 | 446.3 |
| B | 0 | 229 | 253758 | 563.51 | 2339 | 2272 | 446.3 |
| C | 15 | 214 | 840386 | 1592.82 | 2298 | 2311 | 526.2 |
| C | 14 | 67 | 227399 | 427.79 | 2298 | 2311 | 526.2 |
| C | 0 | 10 | 200953 | 377.53 | 2298 | 2311 | 526.2 |
| D | 8 | 195 | 4498321 | 7993.67 | 2295 | 2233 | 562.5 |
| D | 14 | 52 | 493539 | 873.5 | 2295 | 2233 | 562.5 |
| D | 2 | 249 | 393305 | 695.29 | 2295 | 2233 | 562.5 |
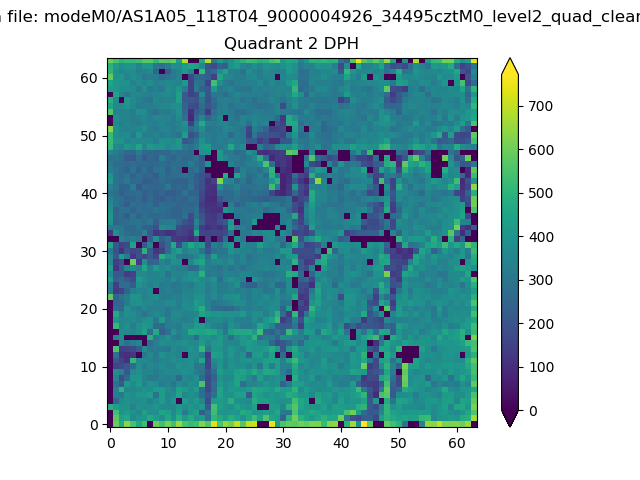
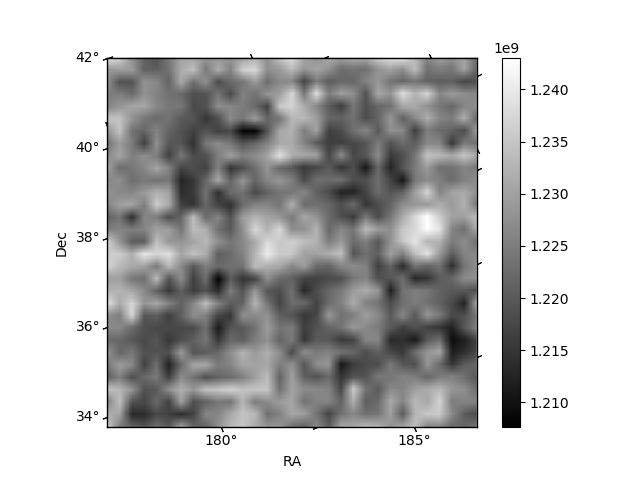
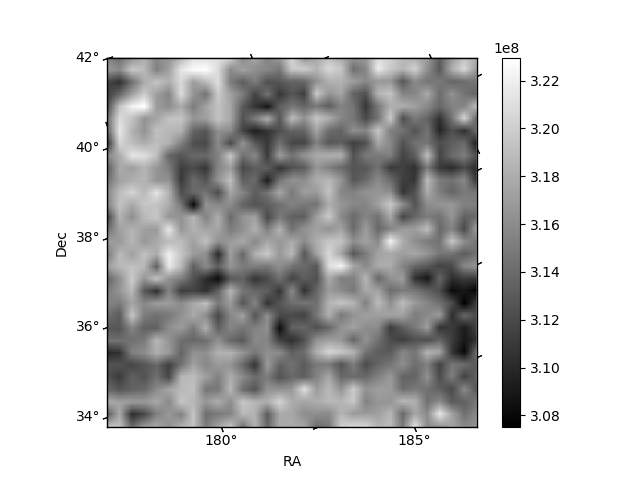
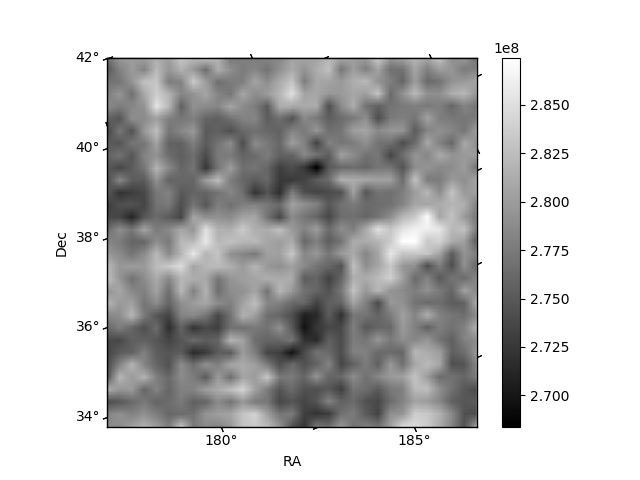
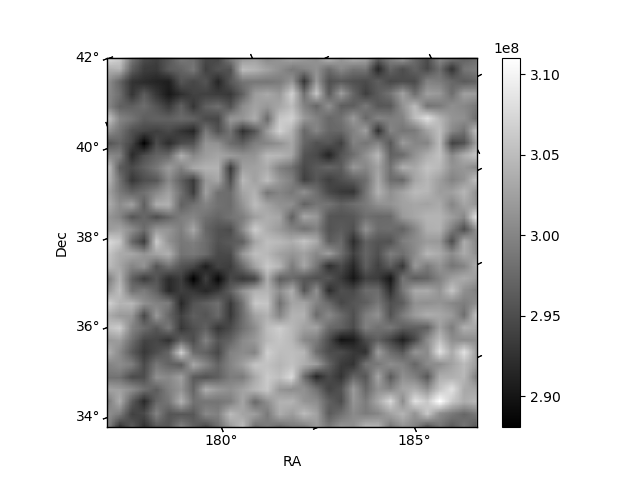
Histogram calculated using DETX and DETY for each event in the final _common_clean file
| Quadrant A | 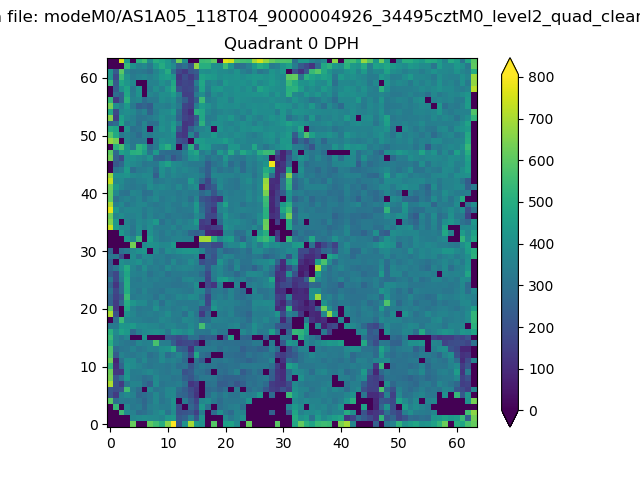 |
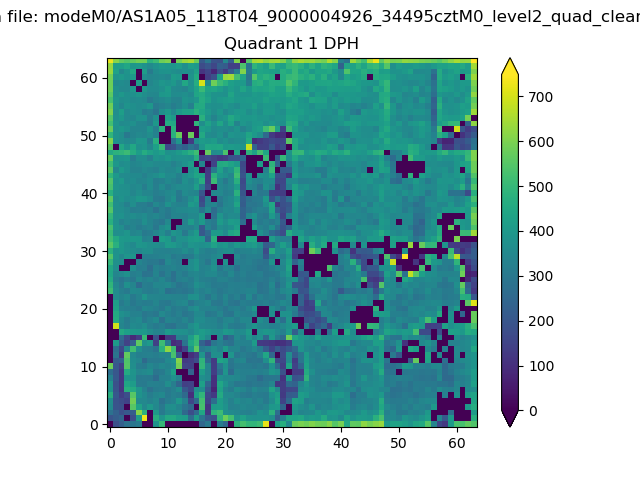 |
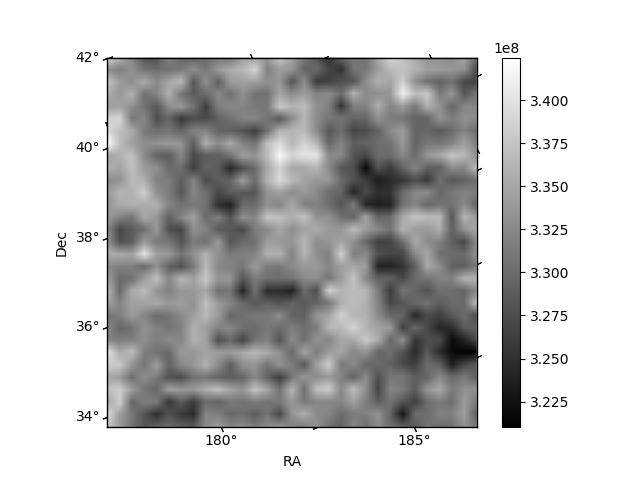
Quadrant B |
|---|---|---|---|
| Quadrant D | 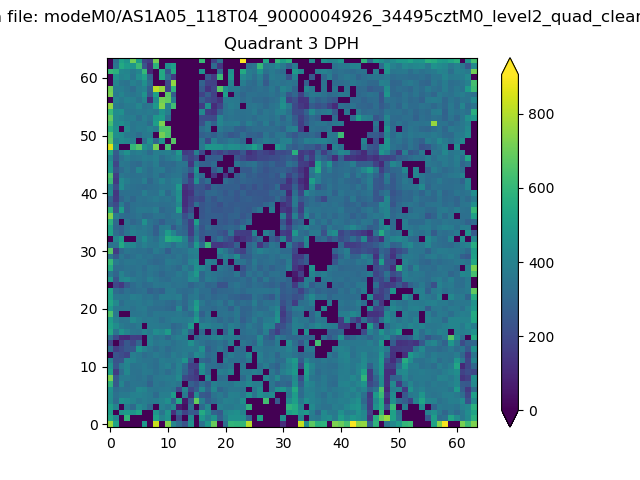 |
 |
Quadrant C |
| Plot type | Count rate plots | Images |
|---|---|---|
| Comparison with Poisson distribution Blue bars denote a histogram of data divided into 1 sec bins. Red curve is a Poisson curve with rate = median count rate of data. |
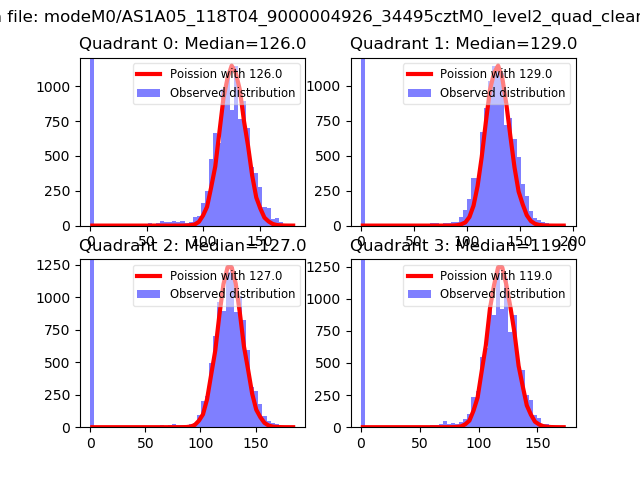 |
 |
| Quadrant-wise count rates Data is divided into 100 sec bins |
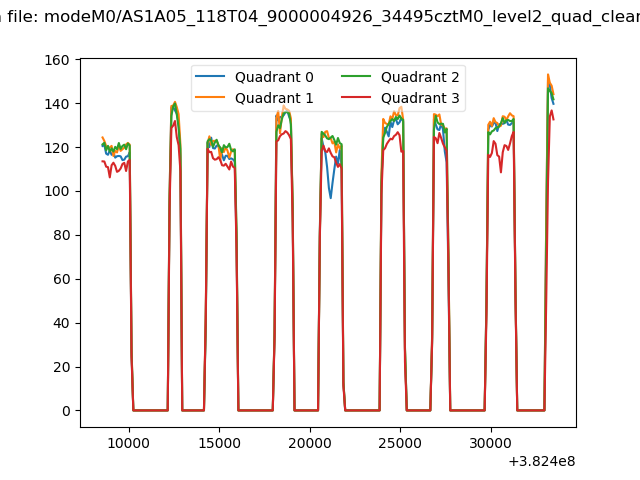 |
|
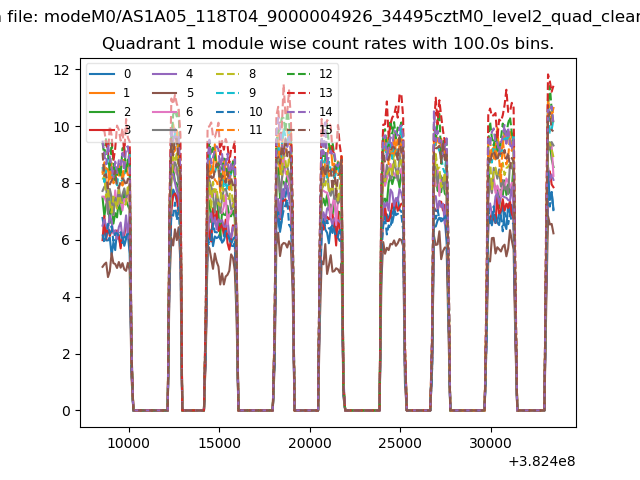
| Module-wise count rates for Quadrant A Data is divided into 100 sec bins |
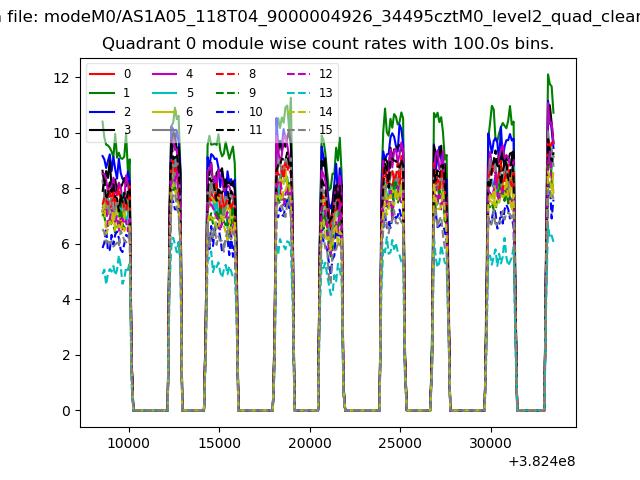 |
 |
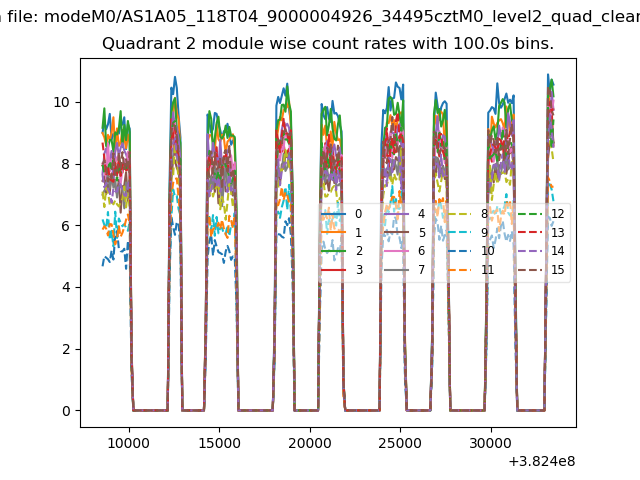
| Module-wise count rates for Quadrant B Data is divided into 100 sec bins |
 |
 |
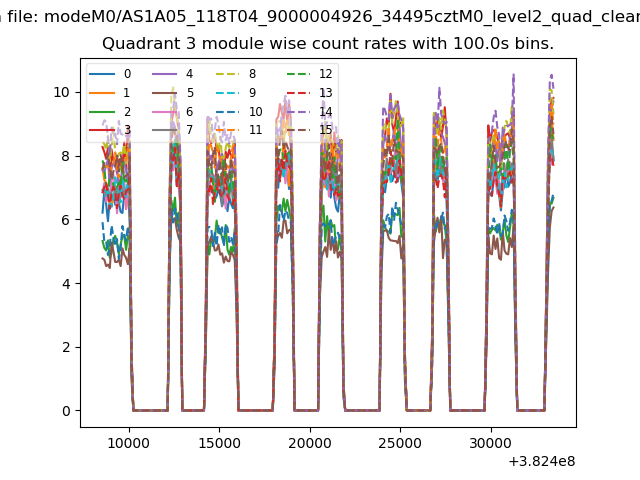
| Module-wise count rates for Quadrant C Data is divided into 100 sec bins |
 |
 |
| Module-wise count rates for Quadrant D Data is divided into 100 sec bins |
 |
 |
| Parameter | Plot |
|---|---|
| CZT HV Monitor | 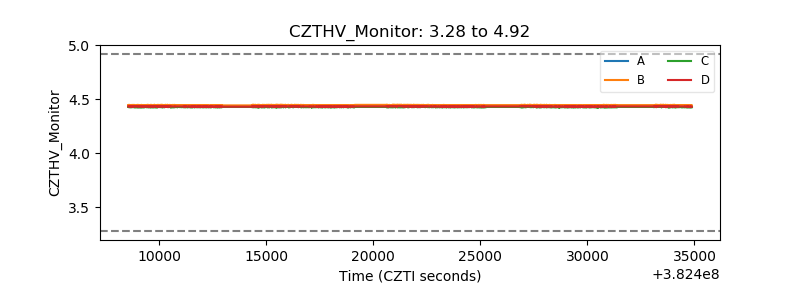 |
| D_VDD | 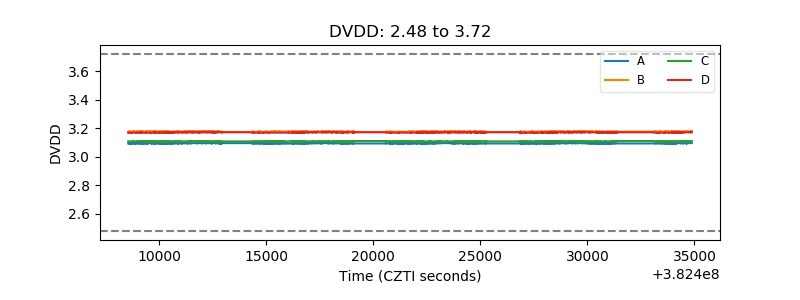 |
| Temperature 1 | 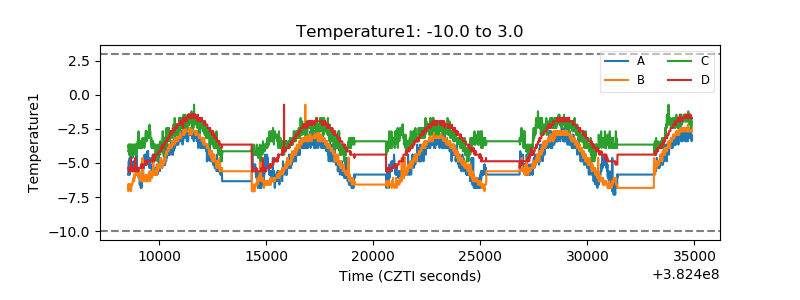 |
| Veto HV Monitor | 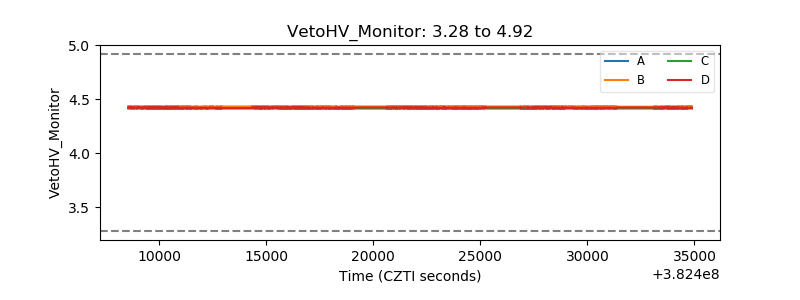 |
| Veto LLD | 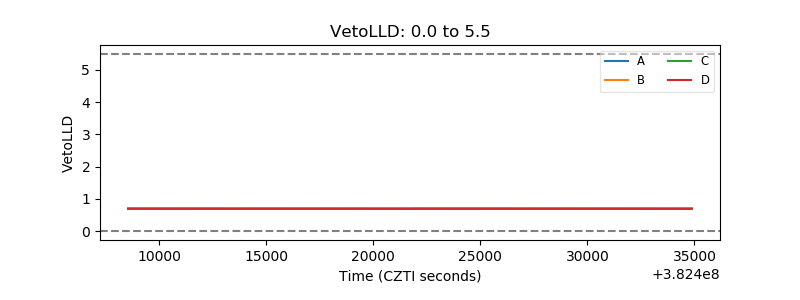 |
| Alpha Counter |  |
| _CPM_Rate | 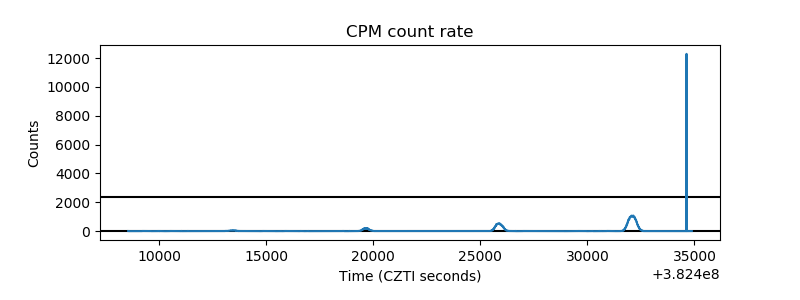 |
| CZT Counter | 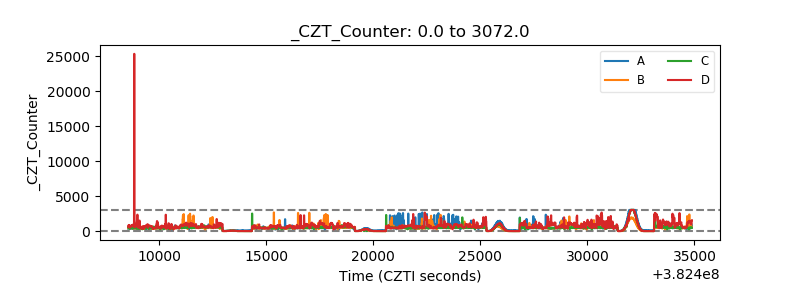 |
| +2.5 Volts monitor | 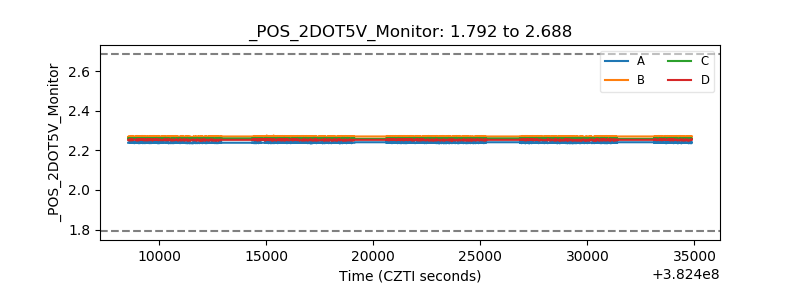 |
| +5 Volts monitor | 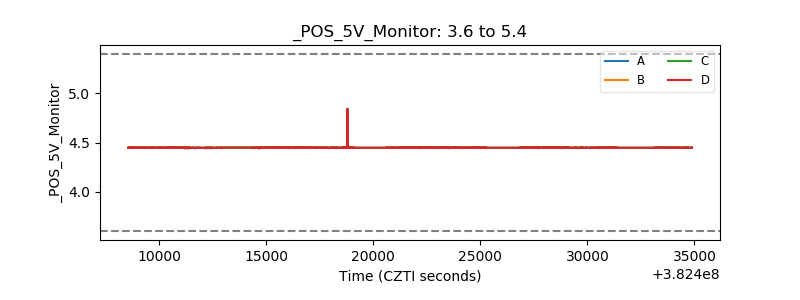 |
| _ROLL_ROT | 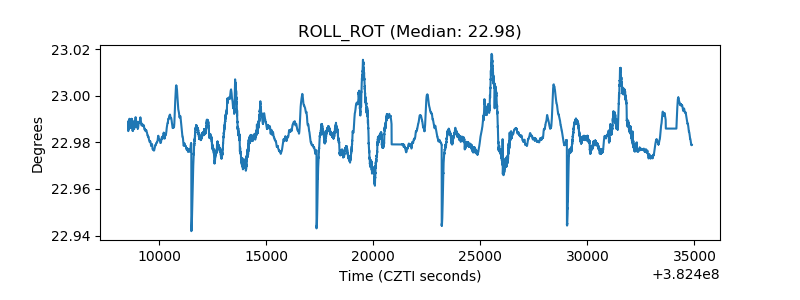 |
| _Roll_DEC | 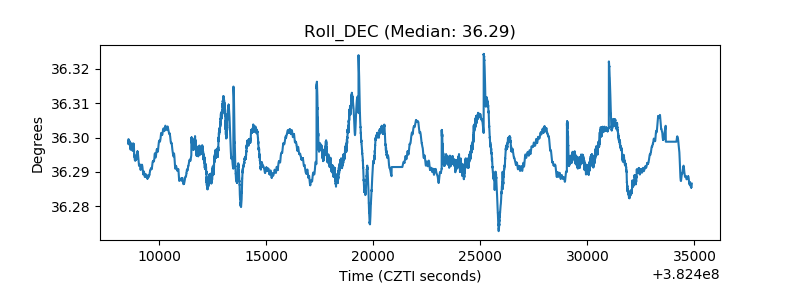 |
| _Roll_RA | 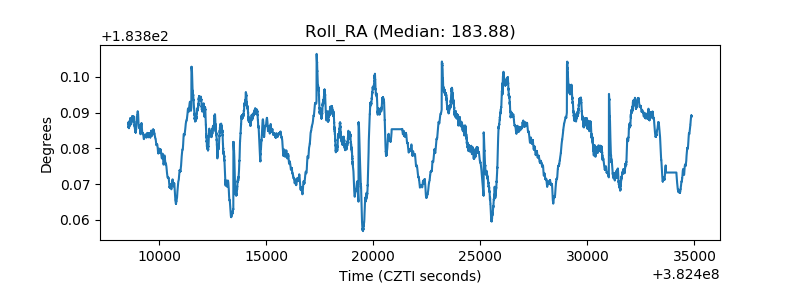 |
| Veto Counter | 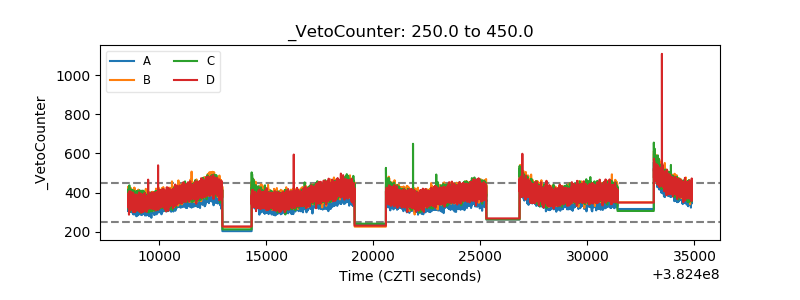 |