| Param | Original file | Final file |
|---|---|---|
| Filename | modeM0/AS1A05_118T04_9000004926_34493cztM0_level2.evt | modeM0/AS1A05_118T04_9000004926_34493cztM0_level2_quad_clean.evt |
| Size (bytes) | 313,378,560 | 38,534,400 |
| Size | 298.9 MB | 36.7 MB |
| Events in quadrant A | 1,936,262 | 230,665 |
| Events in quadrant B | 2,451,657 | 230,378 |
| Events in quadrant C | 2,106,432 | 224,629 |
| Events in quadrant D | 2,741,499 | 216,402 |
| Mode M9 | |||
|---|---|---|---|
| Quadrant | BADHDUFLAG | Total packets | Discarded packets |
| A | 0 | 10 | 0 |
| B | 0 | 10 | 0 |
| C | 0 | 10 | 0 |
| D | 0 | 11 | 0 |
| Mode SS | |||
|---|---|---|---|
| Quadrant | BADHDUFLAG | Total packets | Discarded packets |
| A | 0 | 74 | 0 |
| B | 0 | 74 | 0 |
| C | 0 | 74 | 0 |
| D | 0 | 74 | 0 |
| Mode M0 | |||
|---|---|---|---|
| Quadrant | BADHDUFLAG | Total packets | Discarded packets |
| A | 0 | 7946 | 1 |
| B | 0 | 9549 | 1 |
| C | 0 | 8278 | 1 |
| D | 0 | 10529 | 1 |
| Quadrant | Total seconds | Saturated seconds | Saturation percentage |
|---|---|---|---|
| A | 3739 | 6 | 0.160471% |
| B | 3739 | 174 | 4.653651% |
| C | 3739 | 24 | 0.641883% |
| D | 3739 | 59 | 1.577962% |
Noise dominated data is calculated using 1-second bins in cleaned event files. If a bin has >2000 counts, and if more than 50% of those come from <1% of pixels, then it is considered to be noise-dominated and hence unusable.
| Quadrant | # 1 sec bins | Bins with >0 counts | Bins with >2000 counts | High rate bins dominated by noise | Noise dominated (total time) | Noise dominated (detector-on time) | Marked lightcurve |
|---|---|---|---|---|---|---|---|
| A | 3739 | 3739 | 4 | 4 | 0.11% | 0.11% | 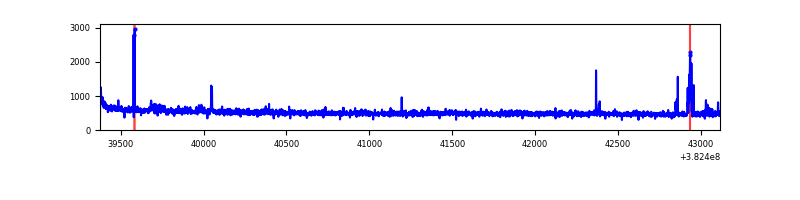 |
| B | 3739 | 3739 | 107 | 107 | 2.86% | 2.86% | 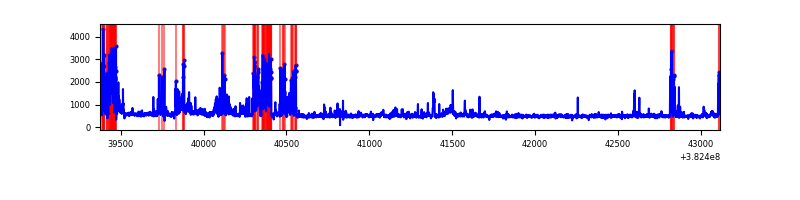 |
| C | 3739 | 3739 | 16 | 16 | 0.43% | 0.43% | 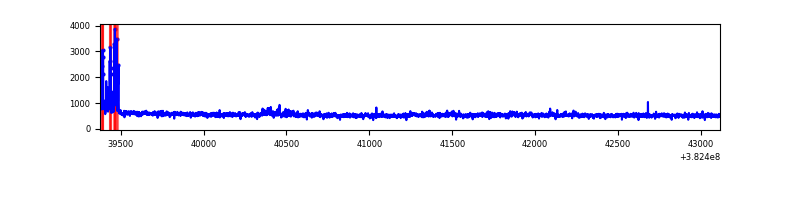 |
| D | 3739 | 3739 | 43 | 43 | 1.15% | 1.15% |  |
Top three noisy pixels from each quadrant. If the there are fewer than three noisy pixels in the level2.evt file, extra rows are filled as -1
| Pixel properties | Quadrant properties | ||||||
|---|---|---|---|---|---|---|---|
| Quadrant | DetID | PixID | Counts | Sigma | Mean | Median | Sigma |
| A | 15 | 169 | 57581 | 588.15 | 480 | 471 | 97.1 |
| A | 10 | 83 | 20349 | 204.71 | 480 | 471 | 97.1 |
| A | 13 | 254 | 5797 | 54.85 | 480 | 471 | 97.1 |
| B | 5 | 172 | 428921 | 4804.3 | 465 | 454 | 89.2 |
| B | 0 | 229 | 70082 | 780.72 | 465 | 454 | 89.2 |
| B | 4 | 171 | 50294 | 558.84 | 465 | 454 | 89.2 |
| C | 15 | 214 | 157446 | 1467.5 | 461 | 466 | 107.0 |
| C | 0 | 10 | 87261 | 811.39 | 461 | 466 | 107.0 |
| C | 14 | 67 | 58499 | 542.51 | 461 | 466 | 107.0 |
| D | 8 | 195 | 478102 | 4193.86 | 464 | 451 | 113.9 |
| D | 14 | 52 | 86786 | 758.04 | 464 | 451 | 113.9 |
| D | 12 | 6 | 76365 | 666.54 | 464 | 451 | 113.9 |
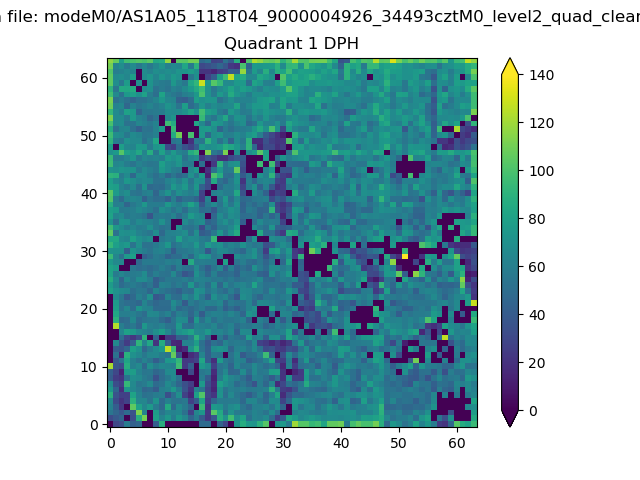
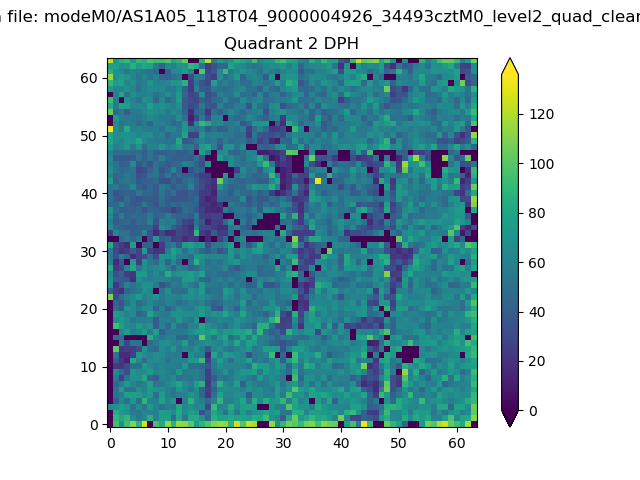
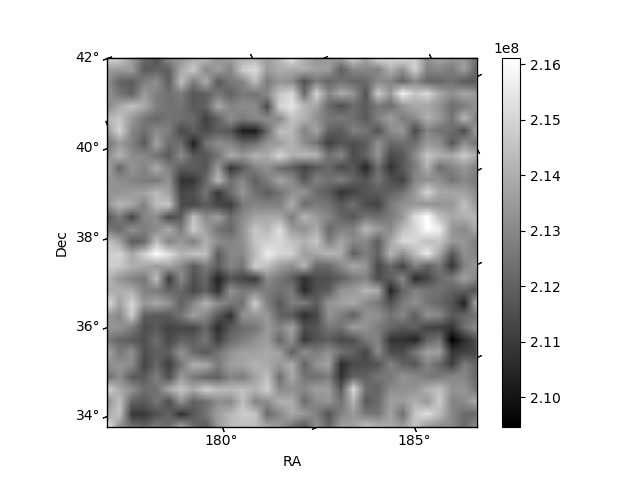
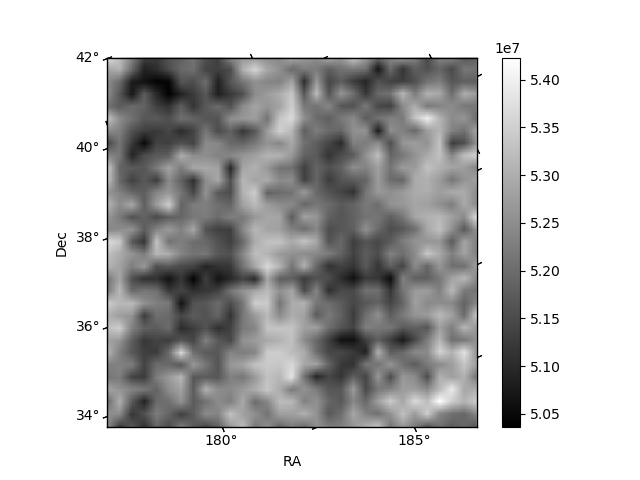
Histogram calculated using DETX and DETY for each event in the final _common_clean file
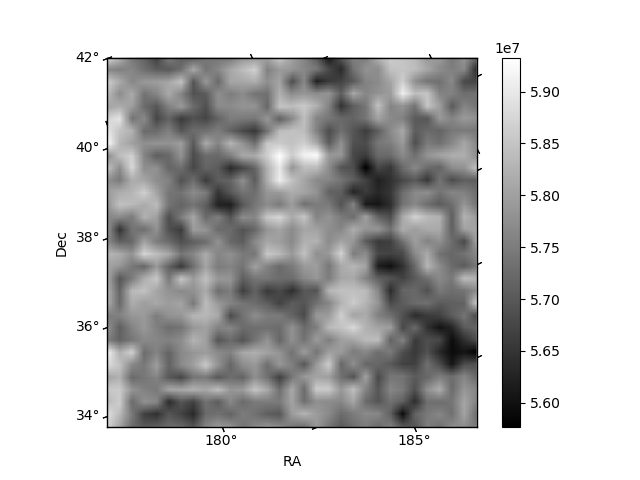
| Quadrant A | 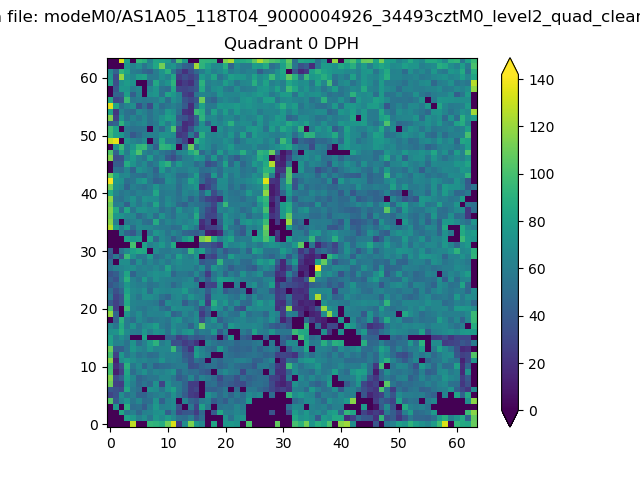 |
 |
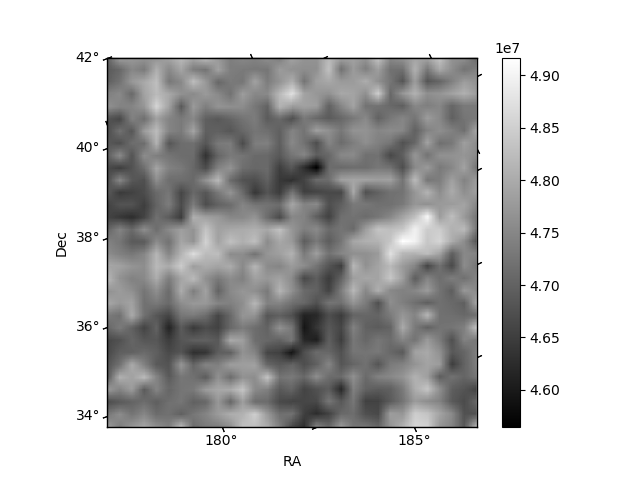
Quadrant B |
|---|---|---|---|
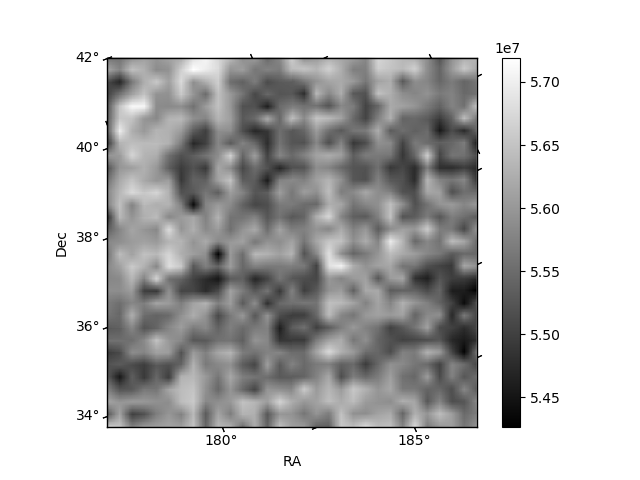
| Quadrant D | 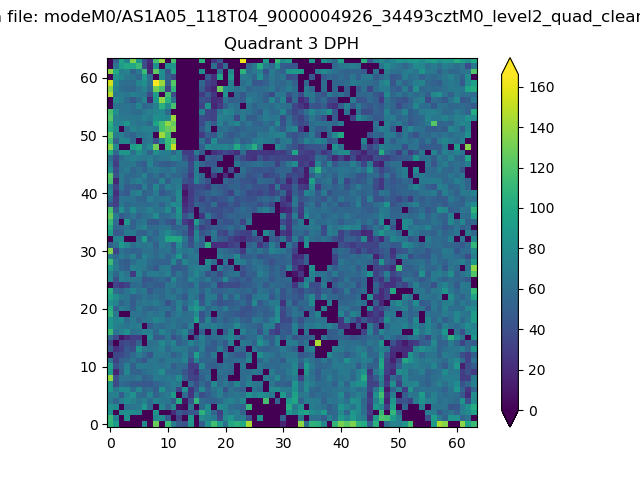 |
 |
Quadrant C |
| Plot type | Count rate plots | Images |
|---|---|---|
| Comparison with Poisson distribution Blue bars denote a histogram of data divided into 1 sec bins. Red curve is a Poisson curve with rate = median count rate of data. |
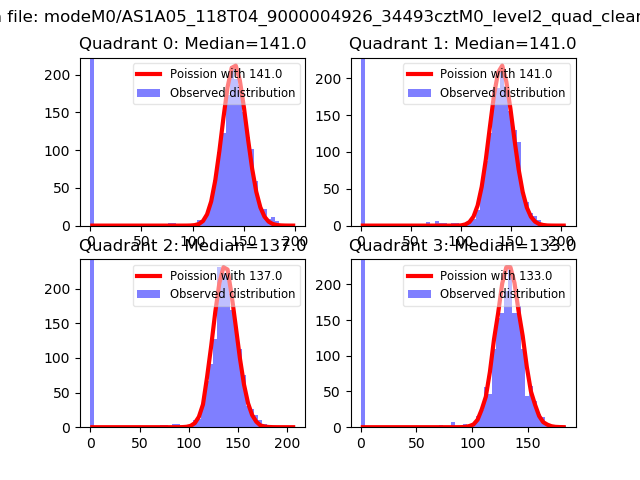 |
 |
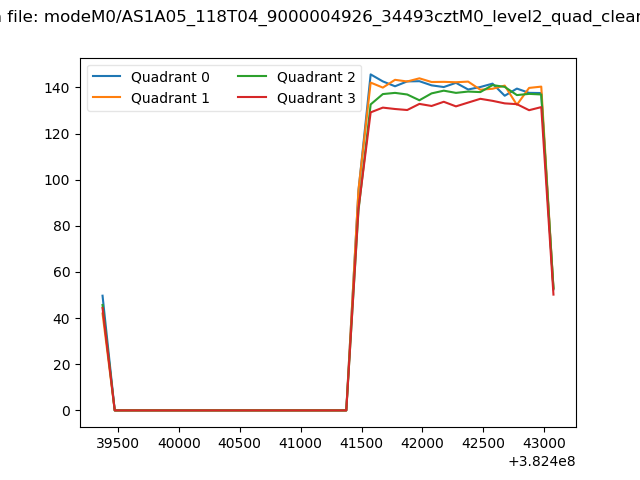
| Quadrant-wise count rates Data is divided into 100 sec bins |
 |
|
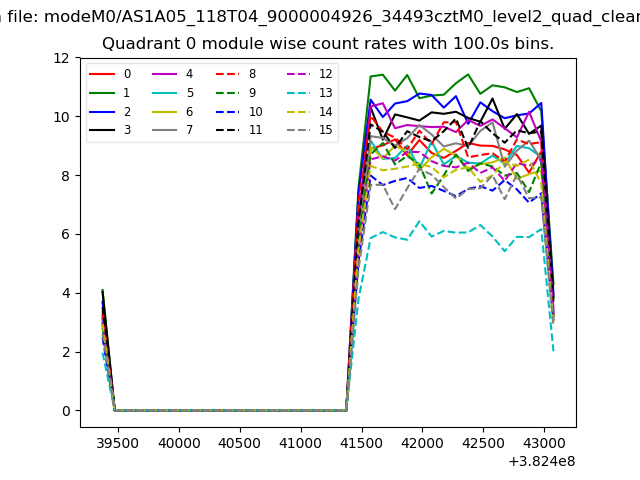
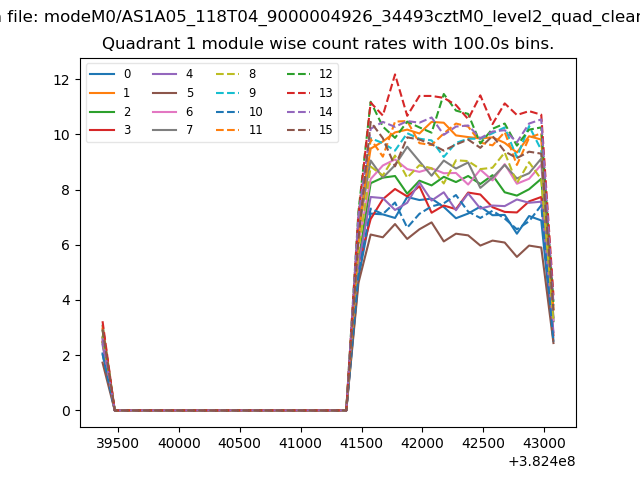
| Module-wise count rates for Quadrant A Data is divided into 100 sec bins |
 |
 |
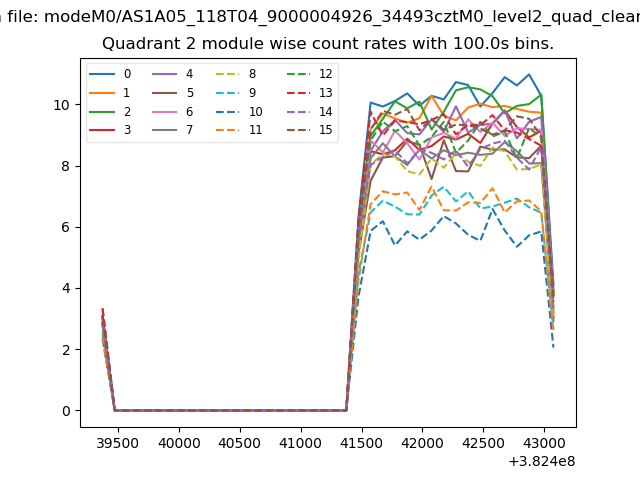
| Module-wise count rates for Quadrant B Data is divided into 100 sec bins |
 |
 |
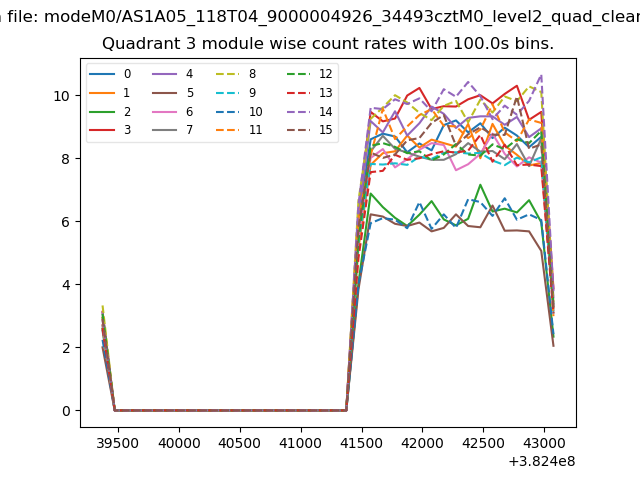
| Module-wise count rates for Quadrant C Data is divided into 100 sec bins |
 |
 |
| Module-wise count rates for Quadrant D Data is divided into 100 sec bins |
 |
 |
| Parameter | Plot |
|---|---|
| CZT HV Monitor | 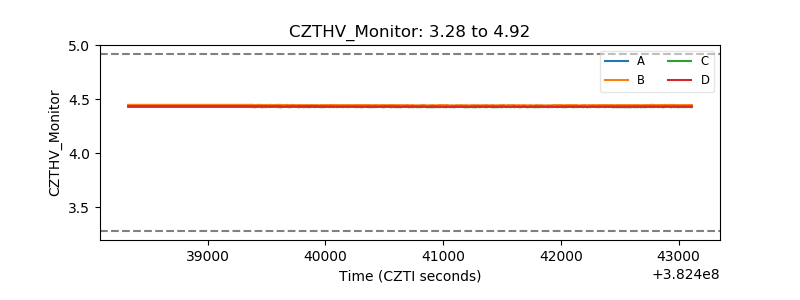 |
| D_VDD | 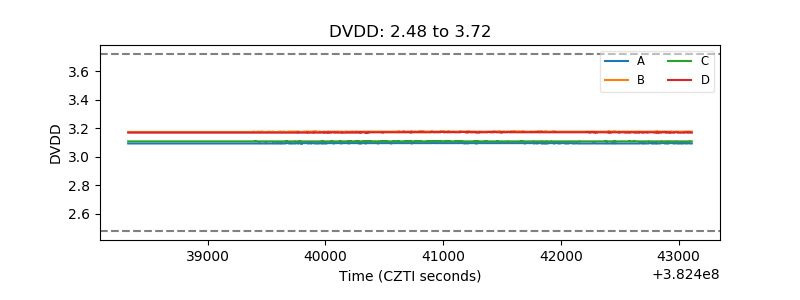 |
| Temperature 1 | 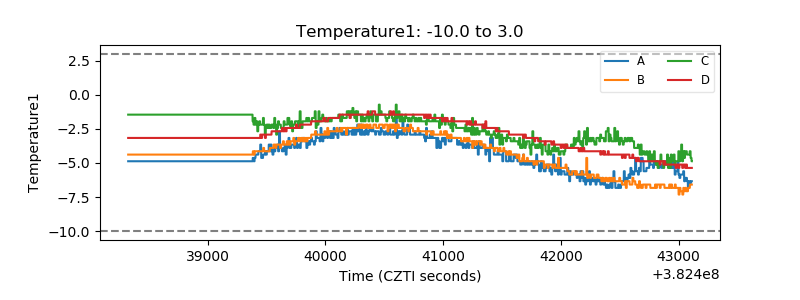 |
| Veto HV Monitor | 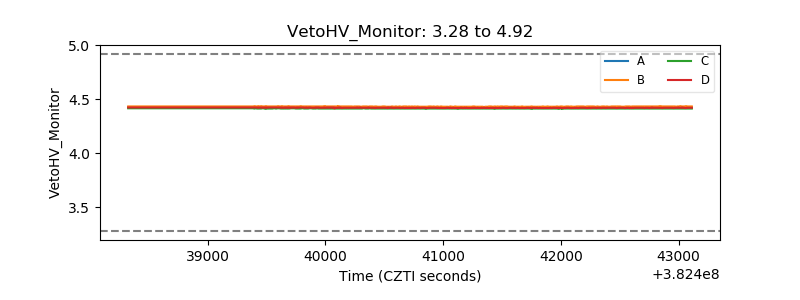 |
| Veto LLD | 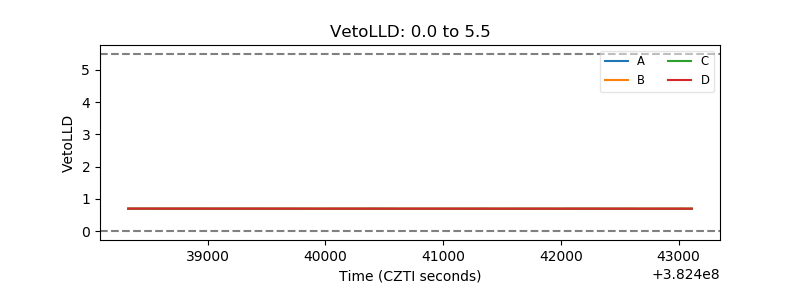 |
| Alpha Counter | 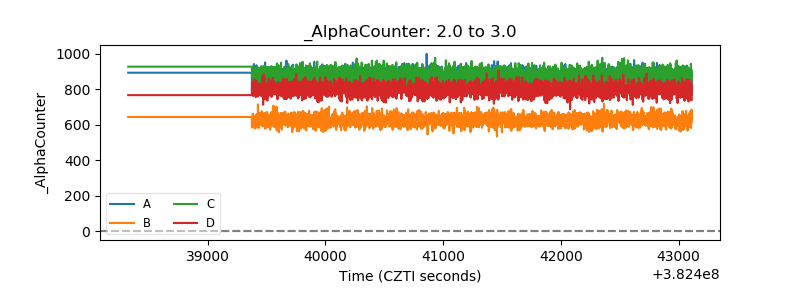 |
| _CPM_Rate | 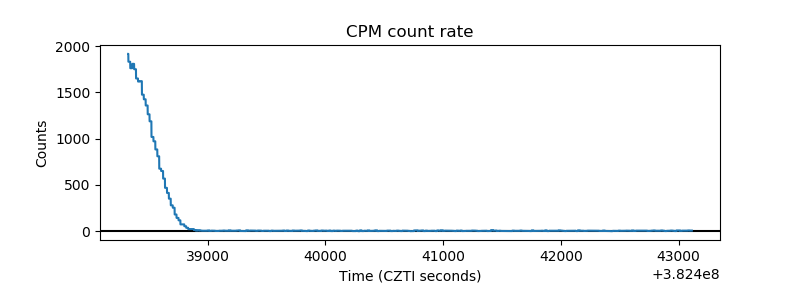 |
| CZT Counter | 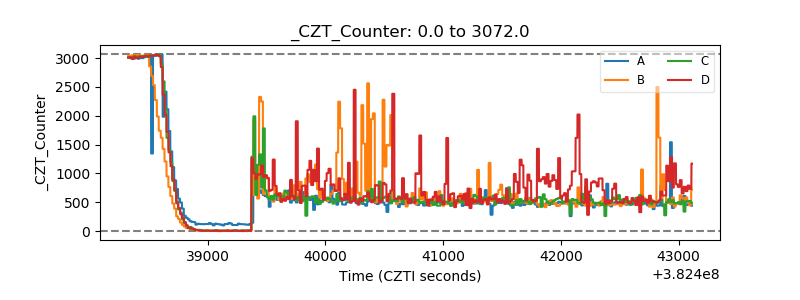 |
| +2.5 Volts monitor | 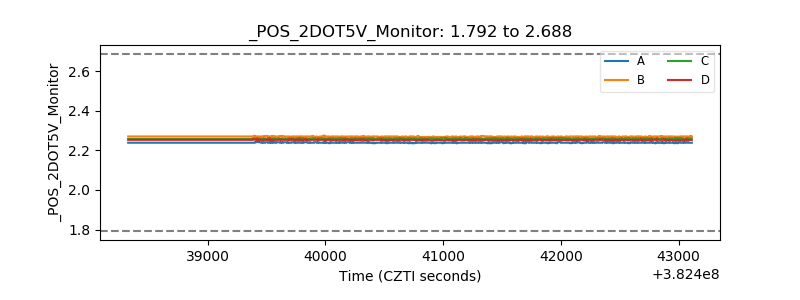 |
| +5 Volts monitor | 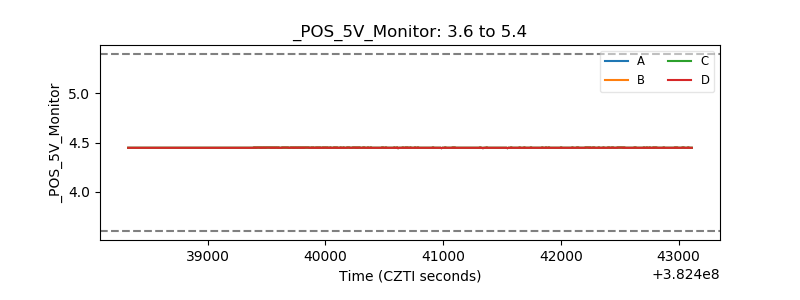 |
| _ROLL_ROT | 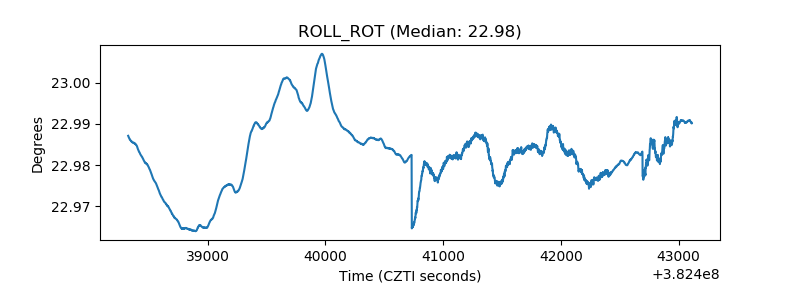 |
| _Roll_DEC | 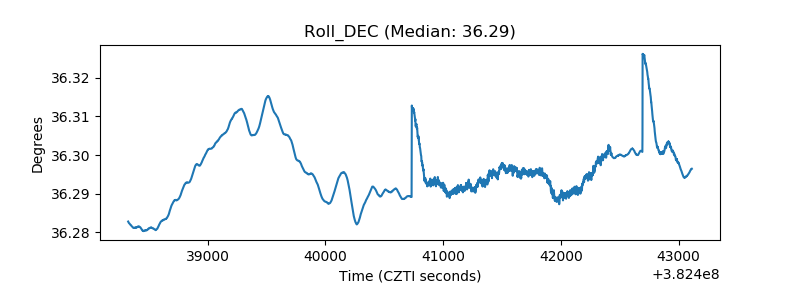 |
| _Roll_RA | 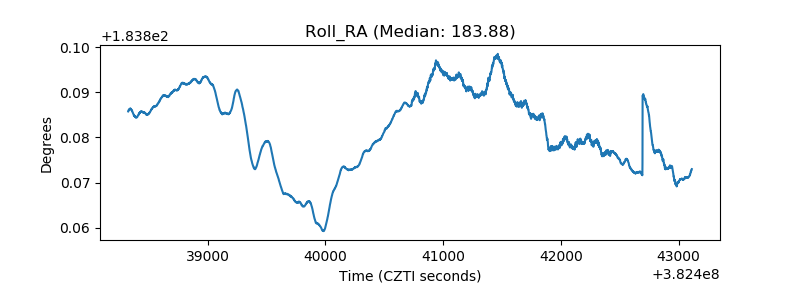 |
| Veto Counter | 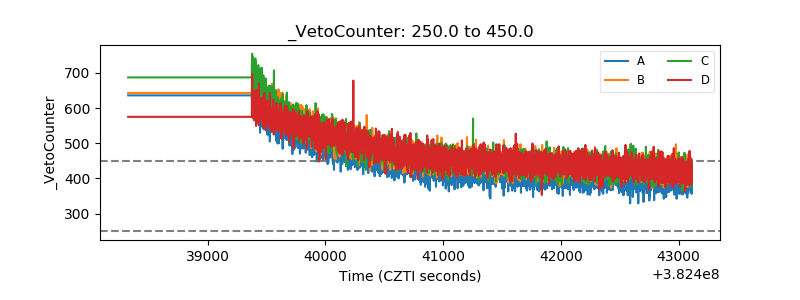 |