| Param | Original file | Final file |
|---|---|---|
| Filename | modeM0/AS1A05_118T04_9000004926_34489cztM0_level2.evt | modeM0/AS1A05_118T04_9000004926_34489cztM0_level2_quad_clean.evt |
| Size (bytes) | 478,624,320 | 66,683,520 |
| Size | 456.5 MB | 63.6 MB |
| Events in quadrant A | 4,227,165 | 400,158 |
| Events in quadrant B | 3,124,423 | 425,222 |
| Events in quadrant C | 2,737,980 | 420,009 |
| Events in quadrant D | 4,038,434 | 394,603 |
| Mode M9 | |||
|---|---|---|---|
| Quadrant | BADHDUFLAG | Total packets | Discarded packets |
| A | 0 | 16 | 0 |
| B | 0 | 16 | 0 |
| C | 0 | 16 | 0 |
| D | 0 | 16 | 0 |
| Mode SS | |||
|---|---|---|---|
| Quadrant | BADHDUFLAG | Total packets | Discarded packets |
| A | 0 | 110 | 0 |
| B | 0 | 110 | 0 |
| C | 0 | 110 | 0 |
| D | 0 | 110 | 0 |
| Mode M0 | |||
|---|---|---|---|
| Quadrant | BADHDUFLAG | Total packets | Discarded packets |
| A | 0 | 16092 | 2 |
| B | 0 | 12677 | 1 |
| C | 0 | 11293 | 1 |
| D | 0 | 15653 | 1 |
| Quadrant | Total seconds | Saturated seconds | Saturation percentage |
|---|---|---|---|
| A | 5414 | 566 | 10.454378% |
| B | 5414 | 84 | 1.551533% |
| C | 5414 | 13 | 0.240118% |
| D | 5414 | 123 | 2.271888% |
Noise dominated data is calculated using 1-second bins in cleaned event files. If a bin has >2000 counts, and if more than 50% of those come from <1% of pixels, then it is considered to be noise-dominated and hence unusable.
| Quadrant | # 1 sec bins | Bins with >0 counts | Bins with >2000 counts | High rate bins dominated by noise | Noise dominated (total time) | Noise dominated (detector-on time) | Marked lightcurve |
|---|---|---|---|---|---|---|---|
| A | 6967 | 5415 | 374 | 374 | 5.37% | 6.91% | 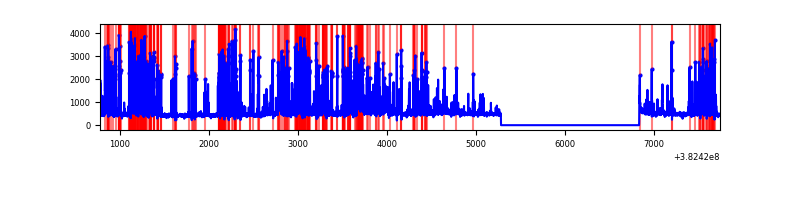 |
| B | 6967 | 5415 | 60 | 60 | 0.86% | 1.11% | 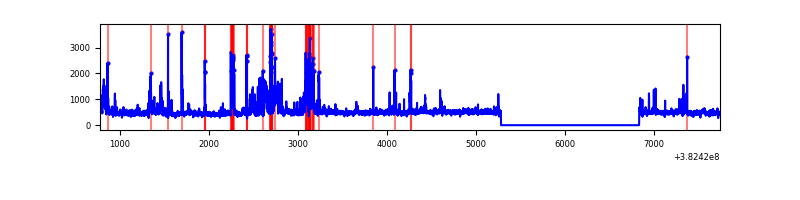 |
| C | 6967 | 5415 | 9 | 9 | 0.13% | 0.17% | 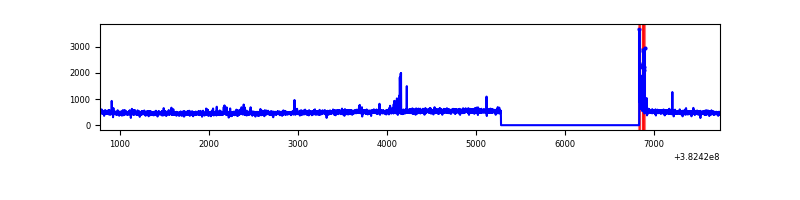 |
| D | 6967 | 5415 | 120 | 120 | 1.72% | 2.22% | 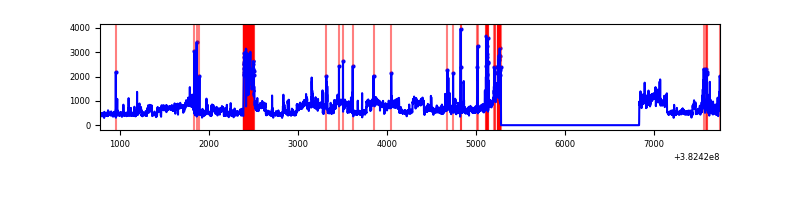 |
Top three noisy pixels from each quadrant. If the there are fewer than three noisy pixels in the level2.evt file, extra rows are filled as -1
| Pixel properties | Quadrant properties | ||||||
|---|---|---|---|---|---|---|---|
| Quadrant | DetID | PixID | Counts | Sigma | Mean | Median | Sigma |
| A | 15 | 169 | 1820810 | 14903.91 | 607 | 595 | 122.1 |
| A | 4 | 48 | 27980 | 224.23 | 607 | 595 | 122.1 |
| A | 10 | 83 | 23796 | 189.97 | 607 | 595 | 122.1 |
| B | 5 | 172 | 286104 | 2337.84 | 626 | 609 | 122.1 |
| B | 0 | 229 | 214507 | 1751.55 | 626 | 609 | 122.1 |
| B | 0 | 189 | 121028 | 986.08 | 626 | 609 | 122.1 |
| C | 15 | 214 | 227692 | 1593.36 | 612 | 615 | 142.5 |
| C | 0 | 10 | 54141 | 375.58 | 612 | 615 | 142.5 |
| C | 15 | 208 | 50464 | 349.78 | 612 | 615 | 142.5 |
| D | 8 | 195 | 1136957 | 7525.39 | 613 | 597 | 151.0 |
| D | 7 | 38 | 161360 | 1064.63 | 613 | 597 | 151.0 |
| D | 10 | 118 | 81373 | 534.93 | 613 | 597 | 151.0 |
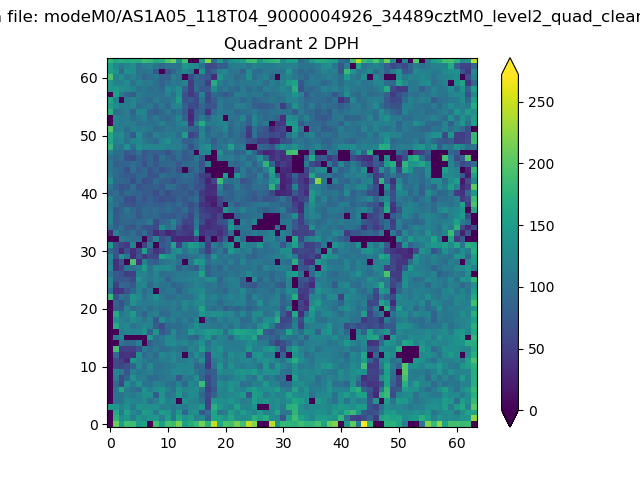
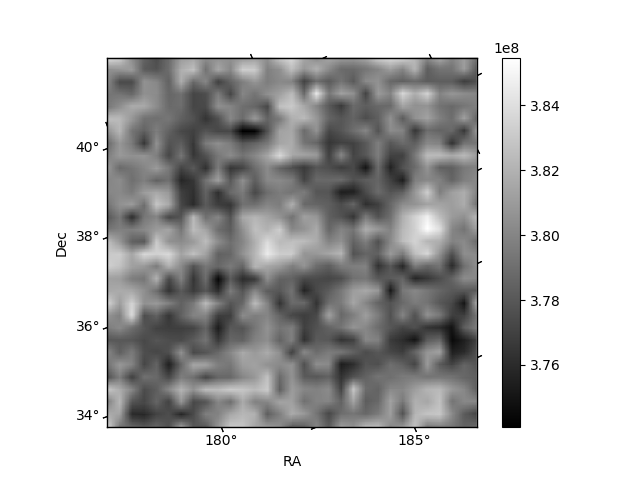
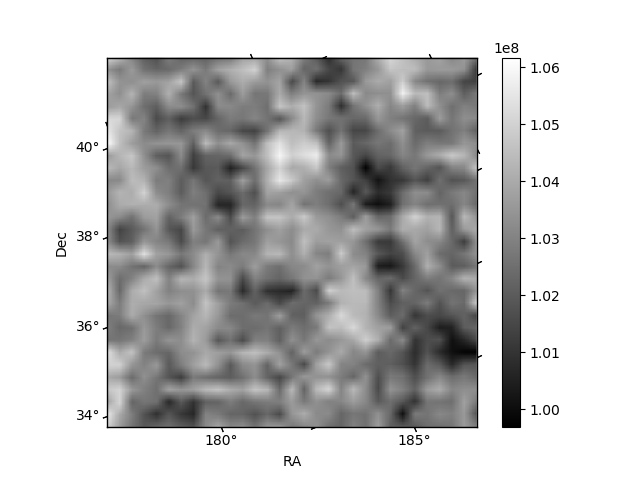
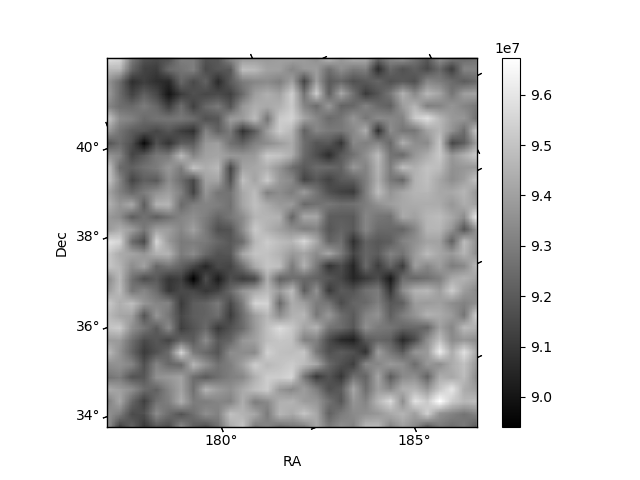
Histogram calculated using DETX and DETY for each event in the final _common_clean file
| Quadrant A | 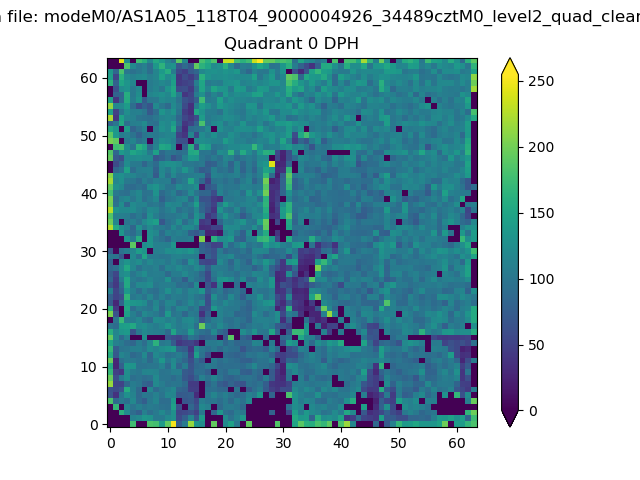 |
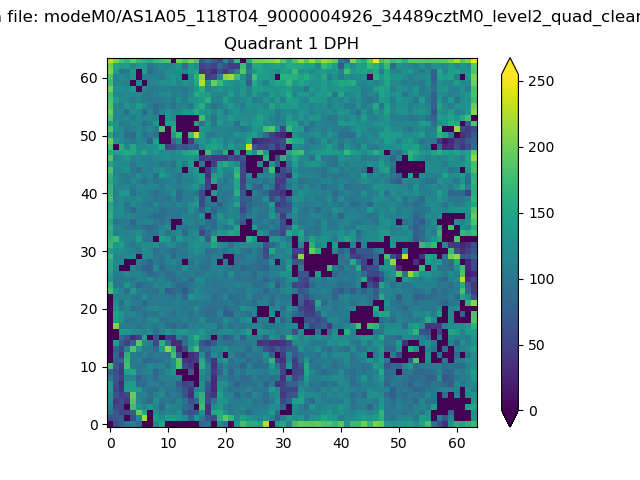 |
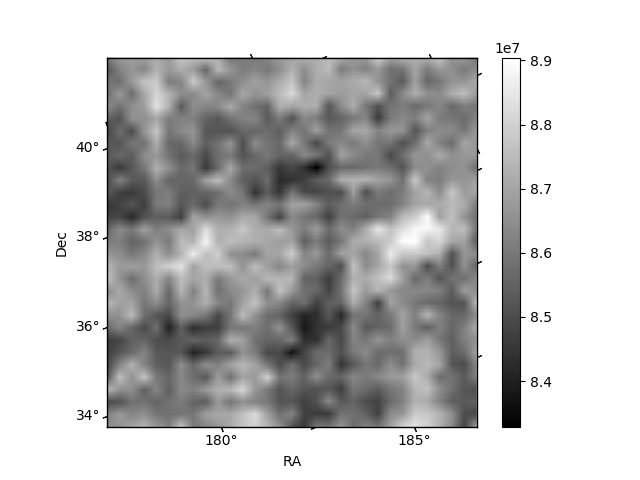
Quadrant B |
|---|---|---|---|
| Quadrant D | 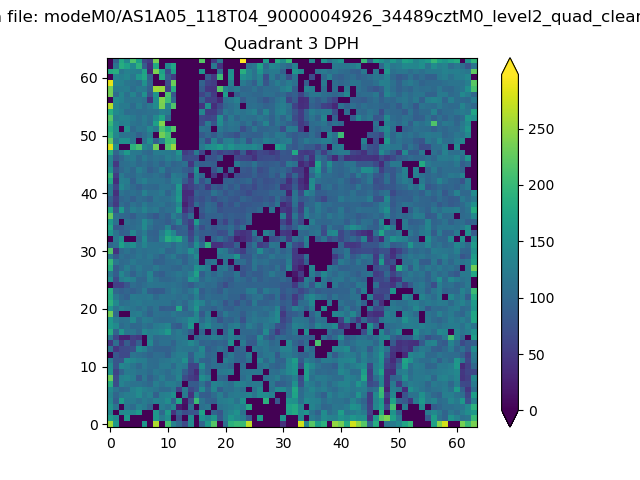 |
 |
Quadrant C |
| Plot type | Count rate plots | Images |
|---|---|---|
| Comparison with Poisson distribution Blue bars denote a histogram of data divided into 1 sec bins. Red curve is a Poisson curve with rate = median count rate of data. |
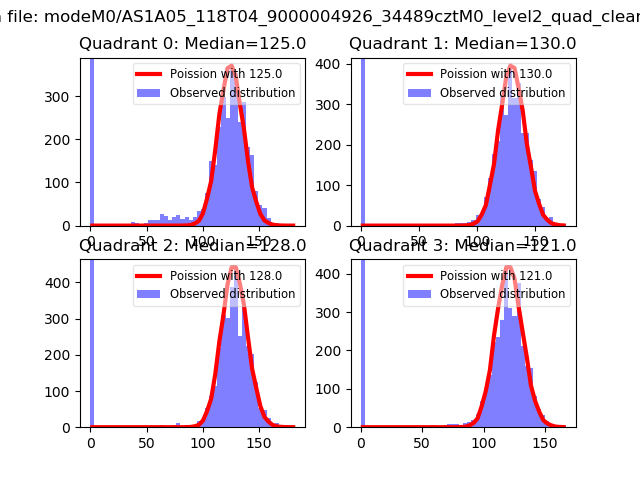 |
 |
| Quadrant-wise count rates Data is divided into 100 sec bins |
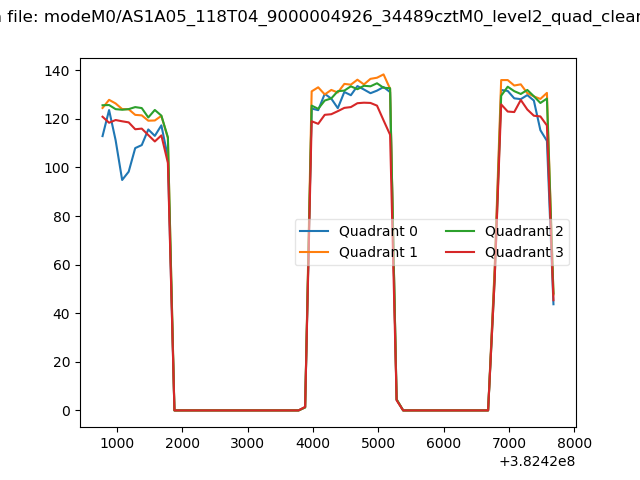 |
|
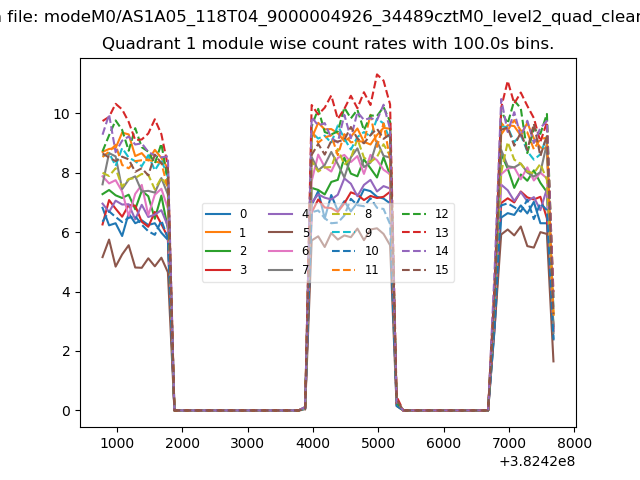
| Module-wise count rates for Quadrant A Data is divided into 100 sec bins |
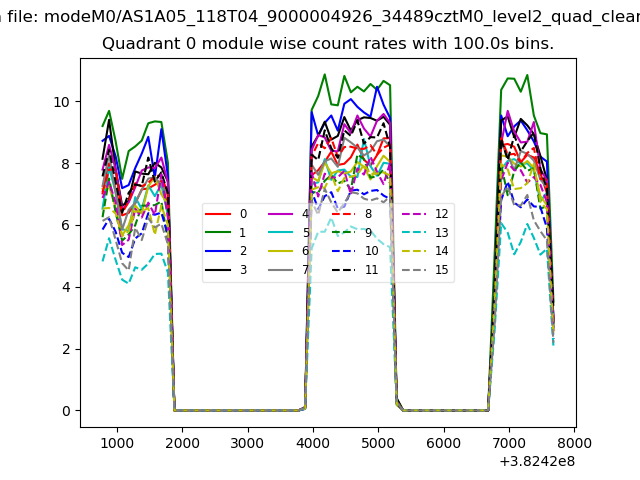 |
 |
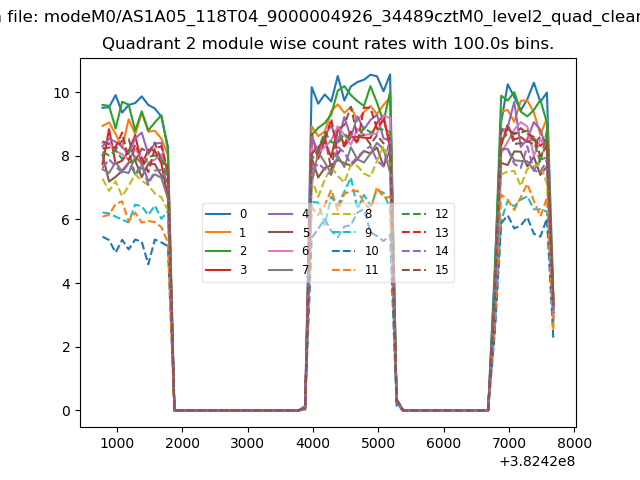
| Module-wise count rates for Quadrant B Data is divided into 100 sec bins |
 |
 |
| Module-wise count rates for Quadrant C Data is divided into 100 sec bins |
 |
 |
| Module-wise count rates for Quadrant D Data is divided into 100 sec bins |
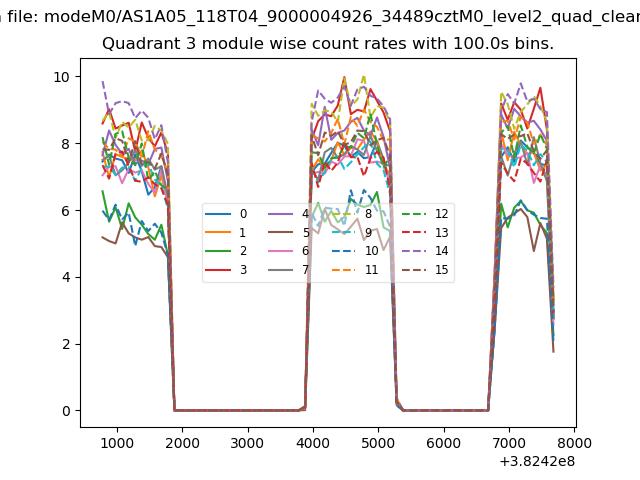 |
 |
| Parameter | Plot |
|---|---|
| CZT HV Monitor | 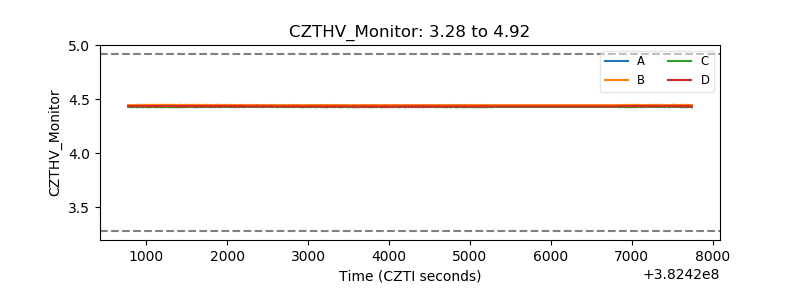 |
| D_VDD | 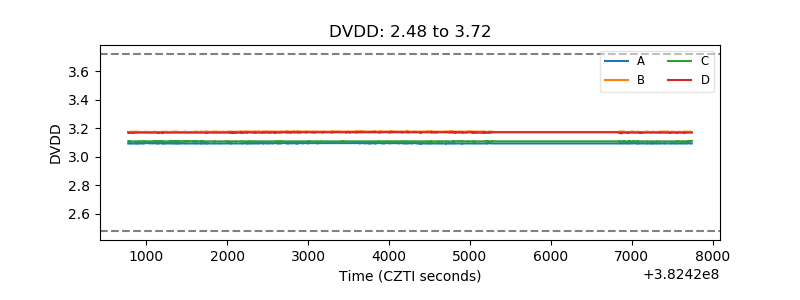 |
| Temperature 1 | 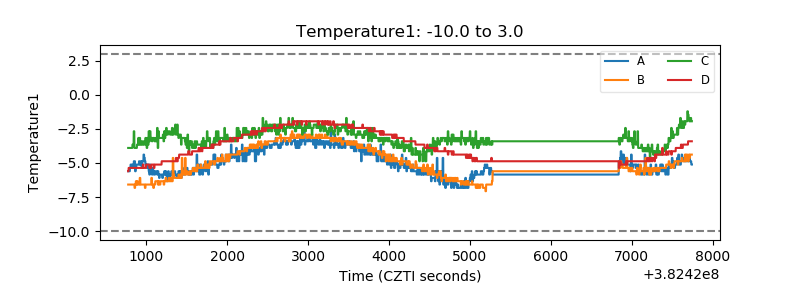 |
| Veto HV Monitor |  |
| Veto LLD | 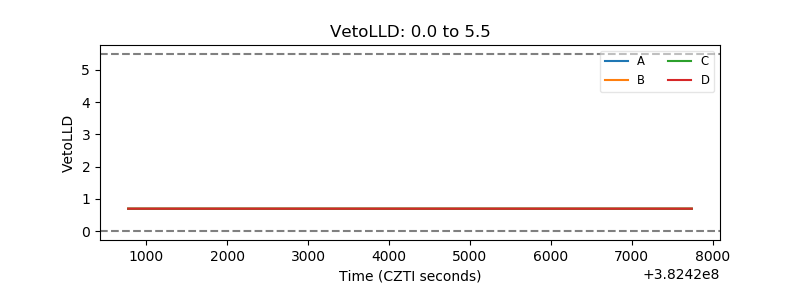 |
| Alpha Counter | 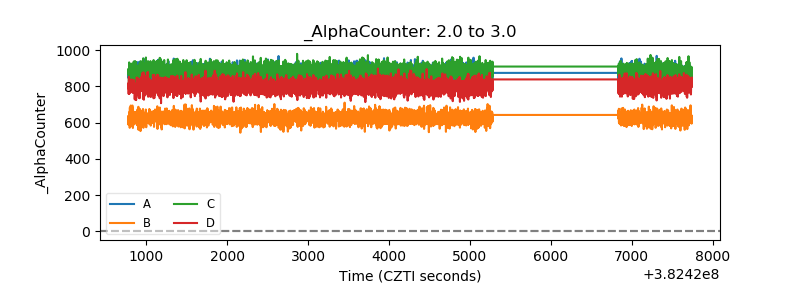 |
| _CPM_Rate | 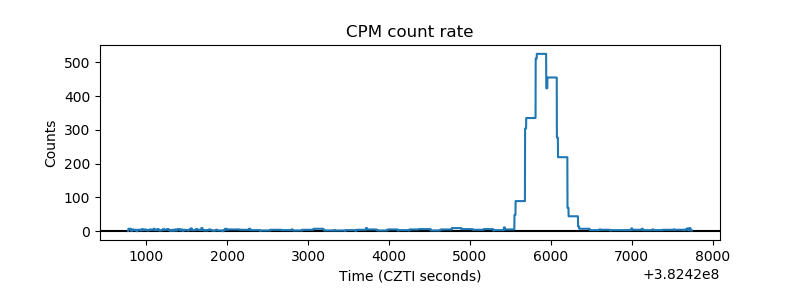 |
| CZT Counter | 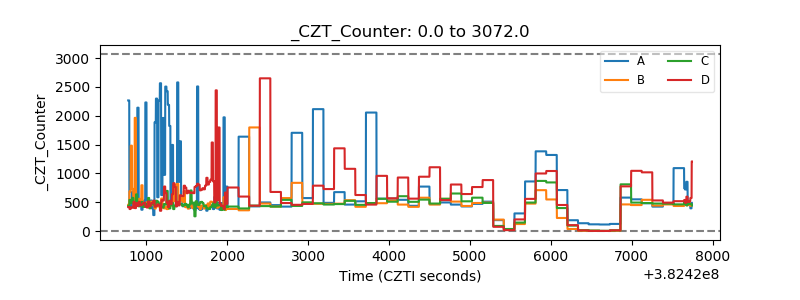 |
| +2.5 Volts monitor | 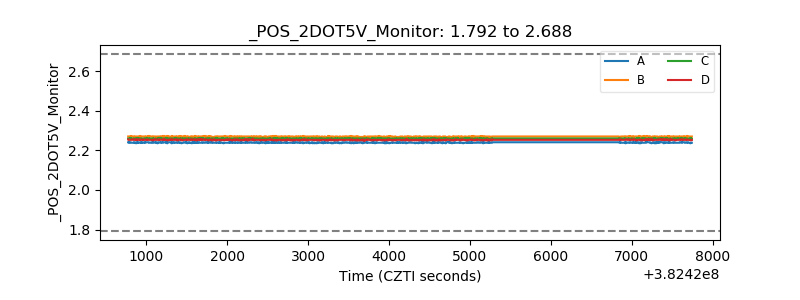 |
| +5 Volts monitor | 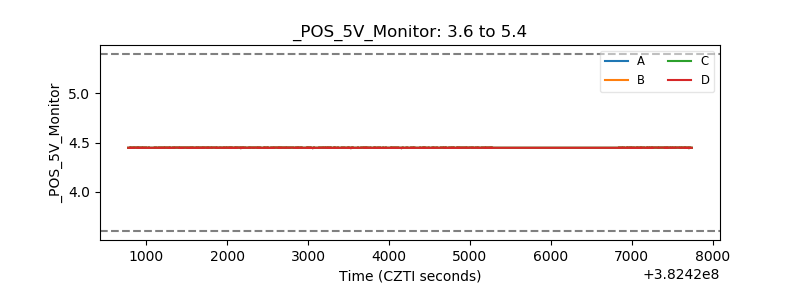 |
| _ROLL_ROT | 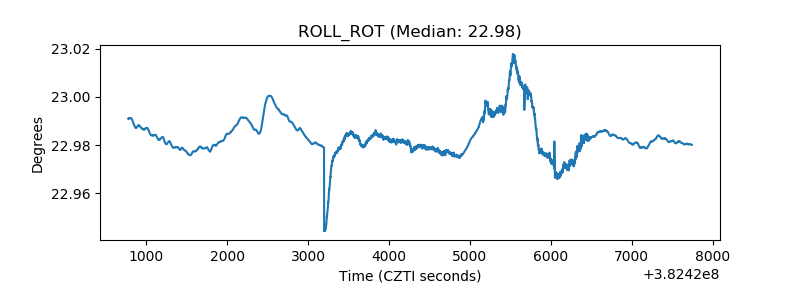 |
| _Roll_DEC | 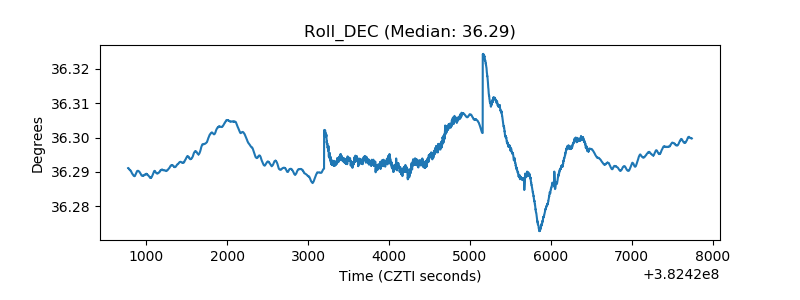 |
| _Roll_RA | 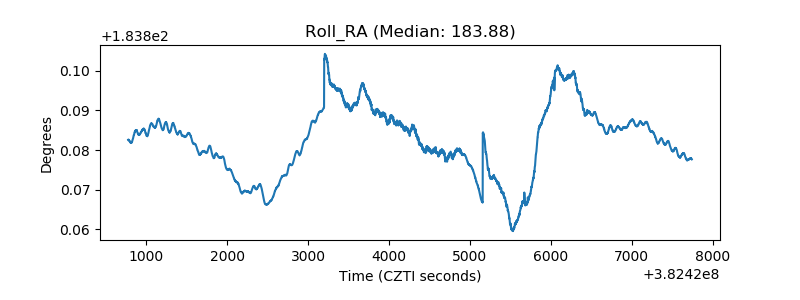 |
| Veto Counter | 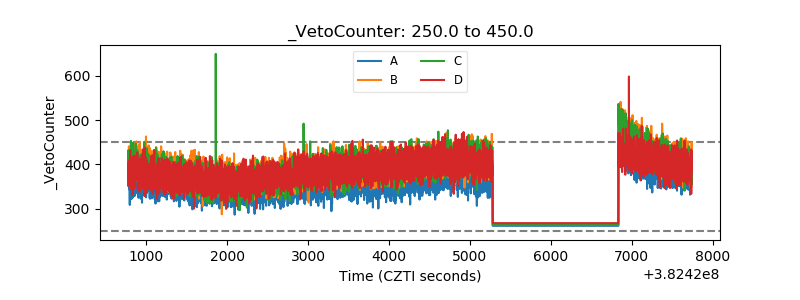 |