| Param | Original file | Final file |
|---|---|---|
| Filename | modeM0/AS1A05_118T04_9000004926_34488cztM0_level2.evt | modeM0/AS1A05_118T04_9000004926_34488cztM0_level2_quad_clean.evt |
| Size (bytes) | 863,593,920 | 133,853,760 |
| Size | 823.6 MB | 127.7 MB |
| Events in quadrant A | 5,766,431 | 818,757 |
| Events in quadrant B | 6,403,123 | 846,143 |
| Events in quadrant C | 5,635,306 | 841,352 |
| Events in quadrant D | 7,607,448 | 787,962 |
| Mode M9 | |||
|---|---|---|---|
| Quadrant | BADHDUFLAG | Total packets | Discarded packets |
| A | 0 | 41 | 0 |
| B | 0 | 41 | 0 |
| C | 0 | 41 | 0 |
| D | 0 | 41 | 0 |
| Mode SS | |||
|---|---|---|---|
| Quadrant | BADHDUFLAG | Total packets | Discarded packets |
| A | 0 | 226 | 0 |
| B | 0 | 226 | 0 |
| C | 0 | 226 | 0 |
| D | 0 | 226 | 0 |
| Mode M0 | |||
|---|---|---|---|
| Quadrant | BADHDUFLAG | Total packets | Discarded packets |
| A | 0 | 24282 | 4 |
| B | 0 | 26185 | 3 |
| C | 0 | 23580 | 3 |
| D | 0 | 30235 | 3 |
| Quadrant | Total seconds | Saturated seconds | Saturation percentage |
|---|---|---|---|
| A | 10971 | 199 | 1.813873% |
| B | 10971 | 371 | 3.381643% |
| C | 10971 | 29 | 0.264333% |
| D | 10971 | 142 | 1.294321% |
Noise dominated data is calculated using 1-second bins in cleaned event files. If a bin has >2000 counts, and if more than 50% of those come from <1% of pixels, then it is considered to be noise-dominated and hence unusable.
| Quadrant | # 1 sec bins | Bins with >0 counts | Bins with >2000 counts | High rate bins dominated by noise | Noise dominated (total time) | Noise dominated (detector-on time) | Marked lightcurve |
|---|---|---|---|---|---|---|---|
| A | 15120 | 10974 | 123 | 123 | 0.81% | 1.12% | 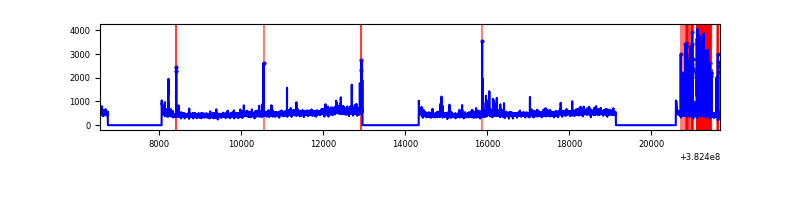 |
| B | 15120 | 10974 | 232 | 232 | 1.53% | 2.11% | 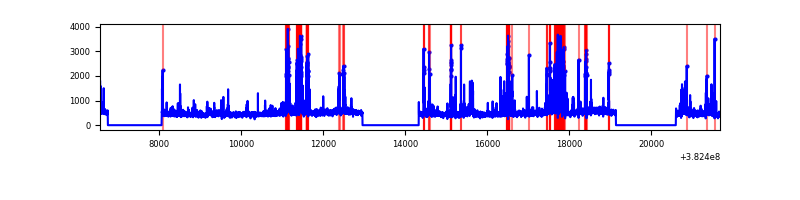 |
| C | 15120 | 10974 | 15 | 15 | 0.10% | 0.14% | 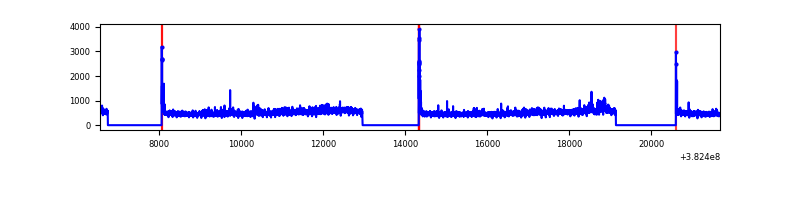 |
| D | 15120 | 10974 | 114 | 114 | 0.75% | 1.04% | 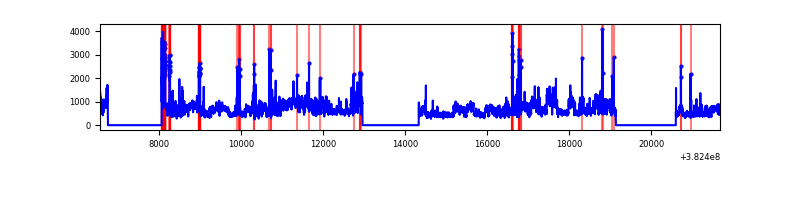 |
Top three noisy pixels from each quadrant. If the there are fewer than three noisy pixels in the level2.evt file, extra rows are filled as -1
| Pixel properties | Quadrant properties | ||||||
|---|---|---|---|---|---|---|---|
| Quadrant | DetID | PixID | Counts | Sigma | Mean | Median | Sigma |
| A | 15 | 169 | 797851 | 3165.73 | 1263 | 1239 | 251.6 |
| A | 10 | 83 | 59492 | 231.5 | 1263 | 1239 | 251.6 |
| A | 13 | 254 | 17516 | 64.68 | 1263 | 1239 | 251.6 |
| B | 5 | 172 | 1080776 | 4527.58 | 1248 | 1213 | 238.4 |
| B | 0 | 189 | 277314 | 1157.94 | 1248 | 1213 | 238.4 |
| B | 0 | 229 | 67019 | 275.98 | 1248 | 1213 | 238.4 |
| C | 15 | 214 | 461293 | 1624.79 | 1233 | 1243 | 283.1 |
| C | 14 | 67 | 186029 | 652.62 | 1233 | 1243 | 283.1 |
| C | 0 | 10 | 98759 | 344.4 | 1233 | 1243 | 283.1 |
| D | 8 | 195 | 2132912 | 7035.9 | 1231 | 1194 | 303.0 |
| D | 7 | 223 | 154817 | 507.04 | 1231 | 1194 | 303.0 |
| D | 1 | 52 | 128736 | 420.96 | 1231 | 1194 | 303.0 |
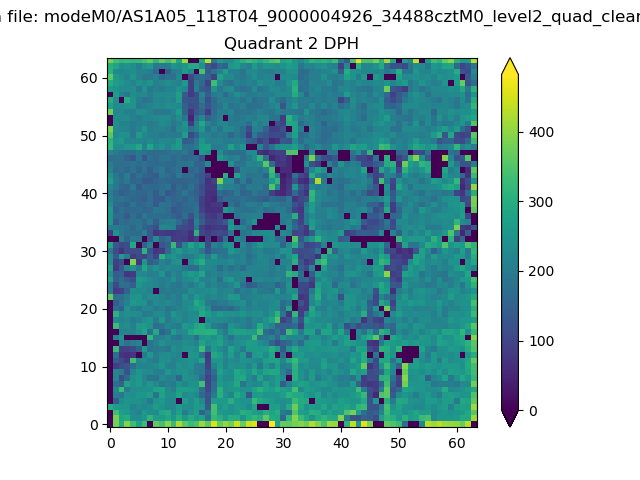
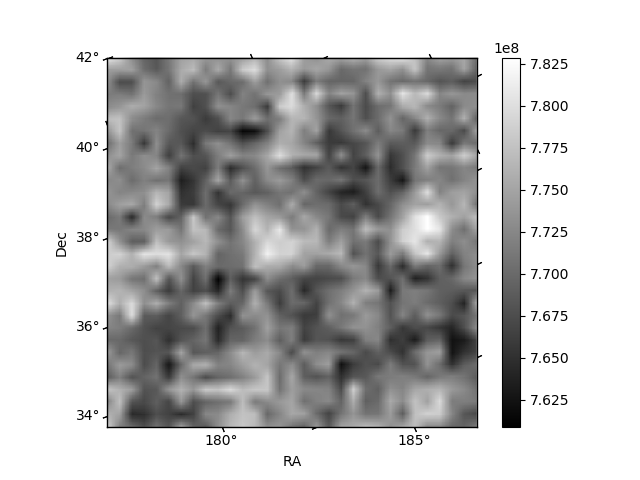
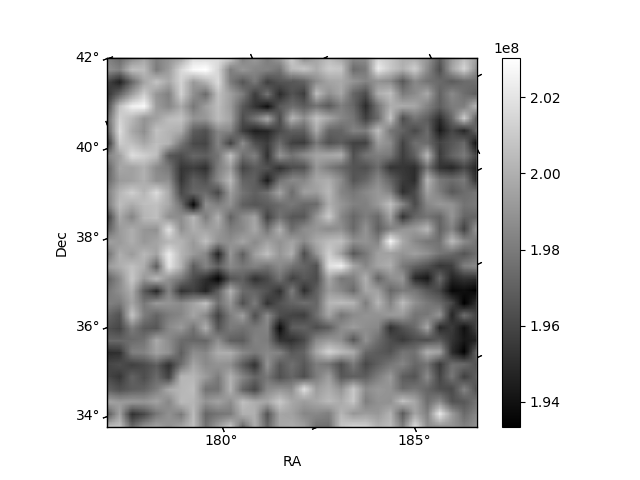
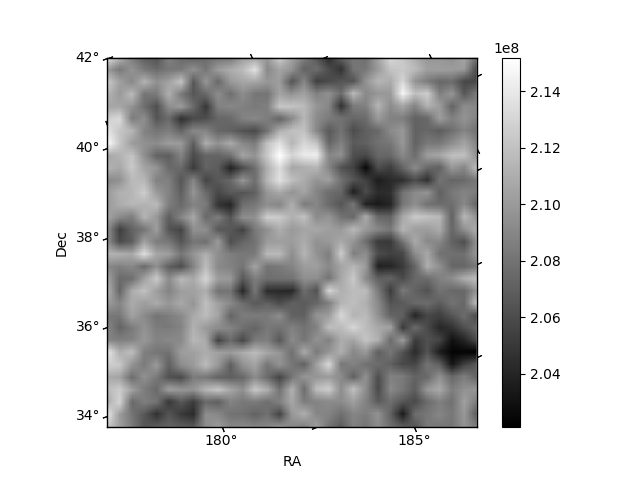
Histogram calculated using DETX and DETY for each event in the final _common_clean file
| Quadrant A |  |
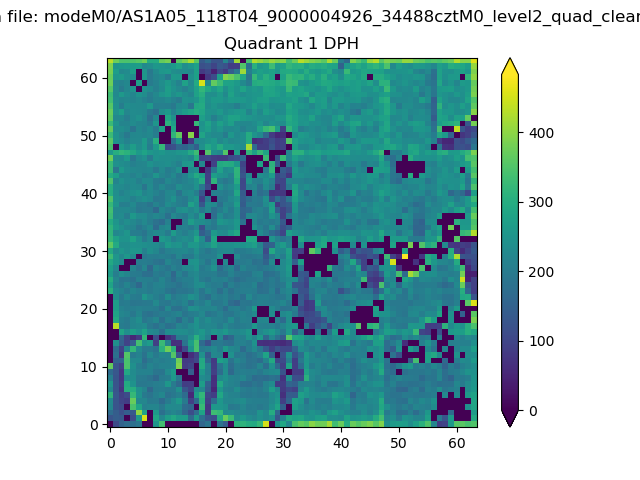 |
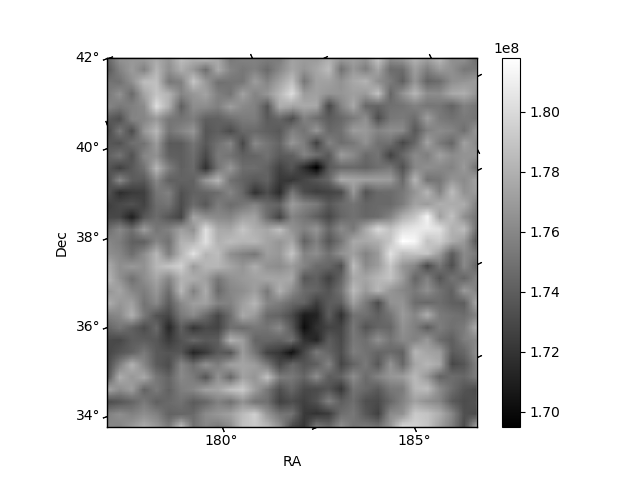
Quadrant B |
|---|---|---|---|
| Quadrant D | 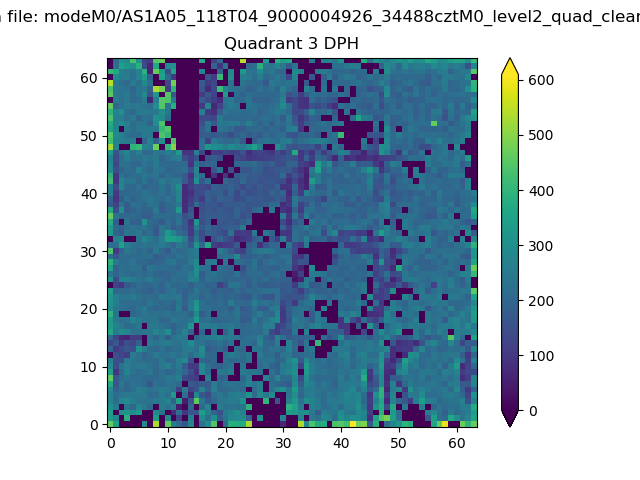 |
 |
Quadrant C |
| Plot type | Count rate plots | Images |
|---|---|---|
| Comparison with Poisson distribution Blue bars denote a histogram of data divided into 1 sec bins. Red curve is a Poisson curve with rate = median count rate of data. |
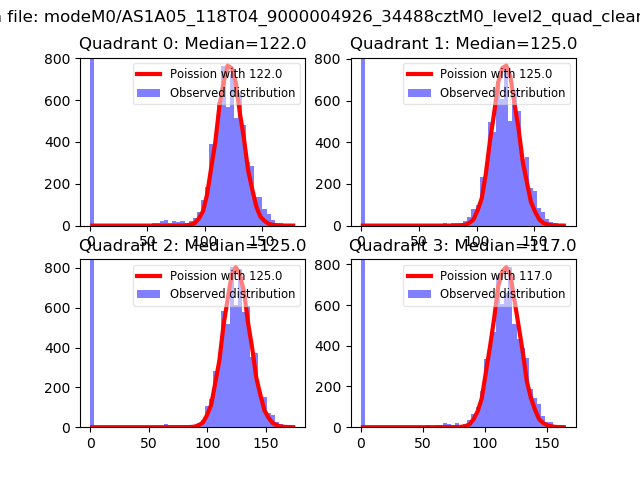 |
 |
| Quadrant-wise count rates Data is divided into 100 sec bins |
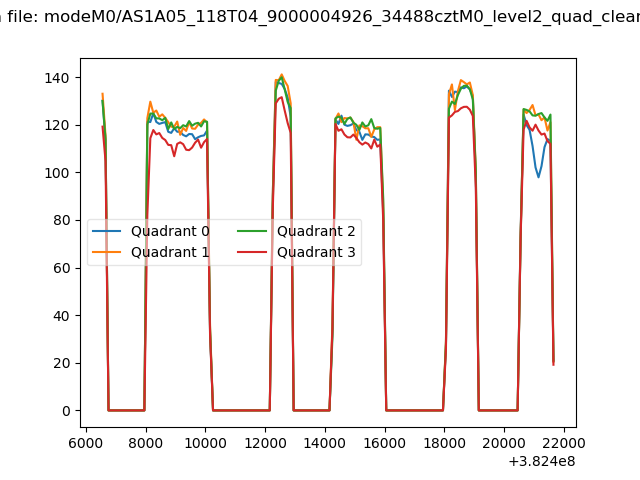 |
|
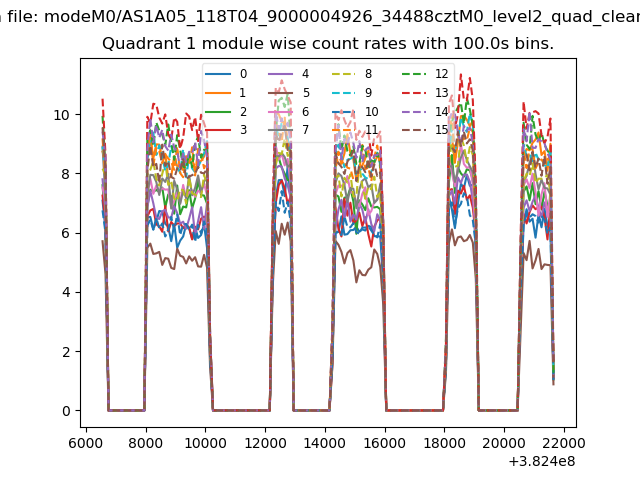
| Module-wise count rates for Quadrant A Data is divided into 100 sec bins |
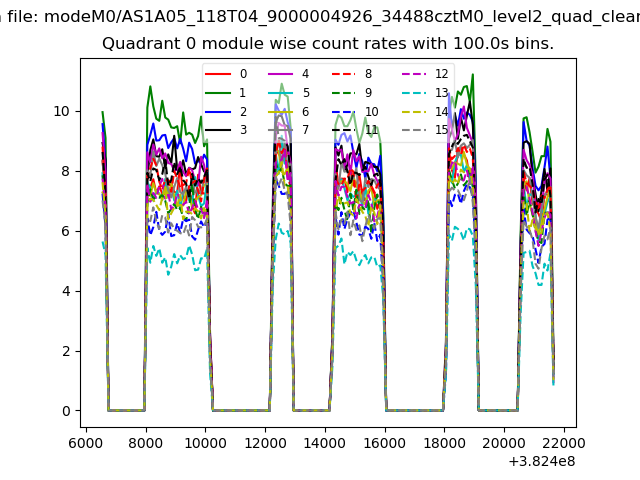 |
 |
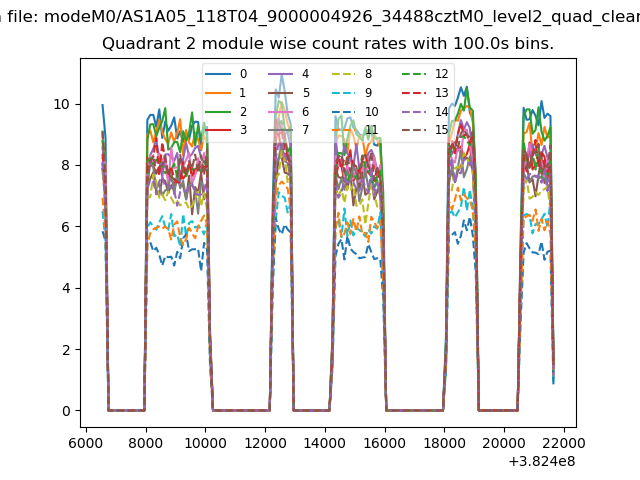
| Module-wise count rates for Quadrant B Data is divided into 100 sec bins |
 |
 |
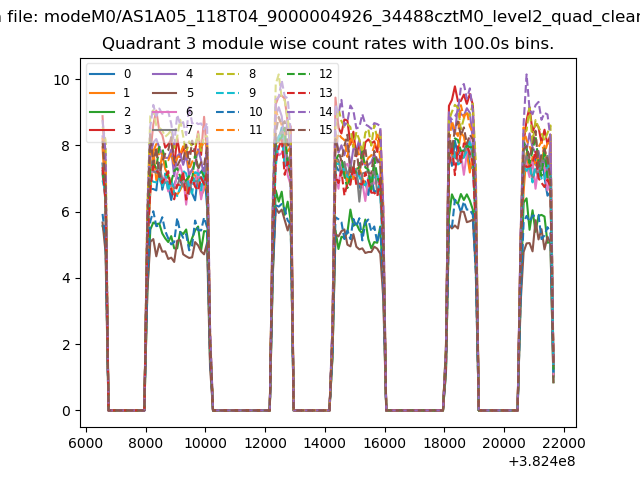
| Module-wise count rates for Quadrant C Data is divided into 100 sec bins |
 |
 |
| Module-wise count rates for Quadrant D Data is divided into 100 sec bins |
 |
 |
| Parameter | Plot |
|---|---|
| CZT HV Monitor |  |
| D_VDD | 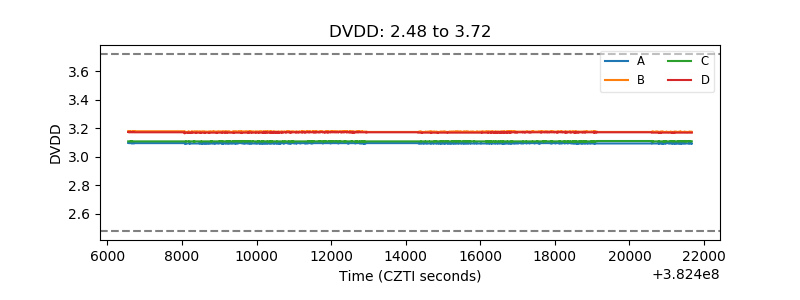 |
| Temperature 1 | 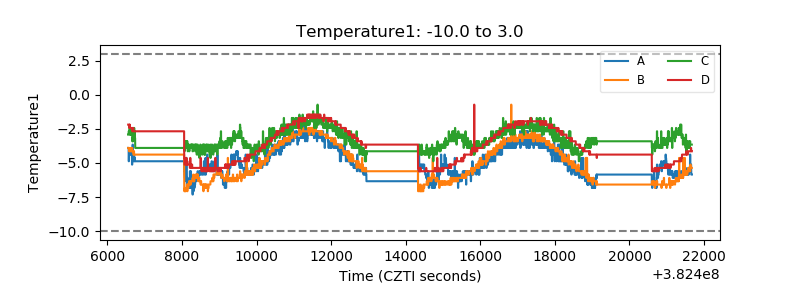 |
| Veto HV Monitor | 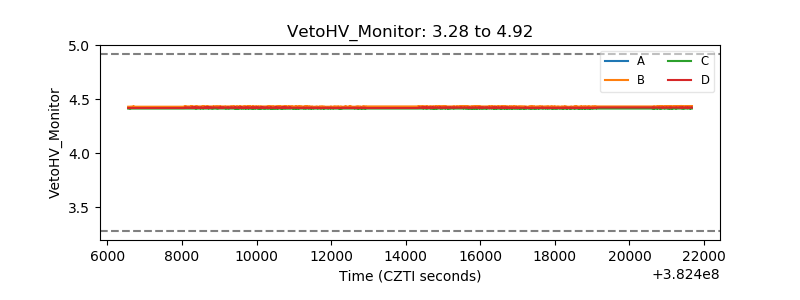 |
| Veto LLD | 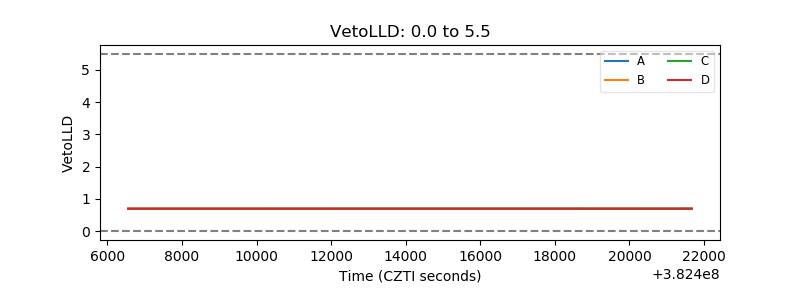 |
| Alpha Counter | 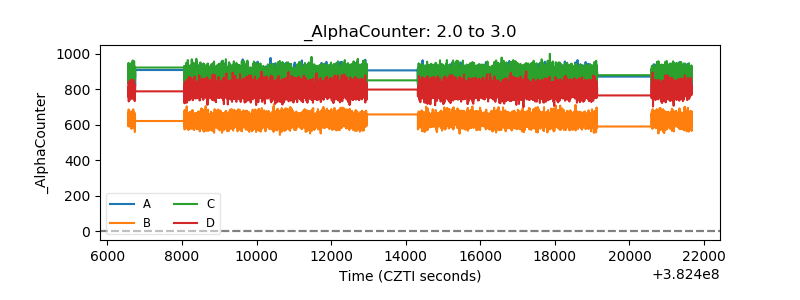 |
| _CPM_Rate | 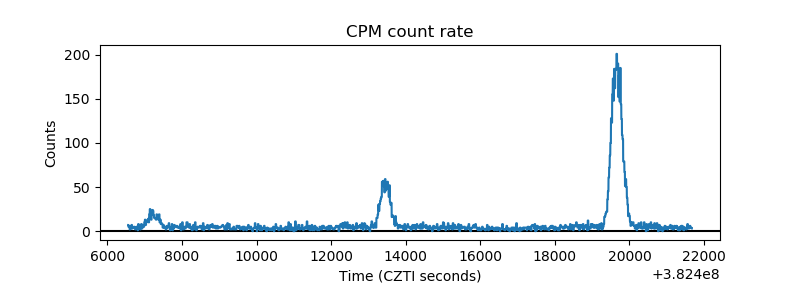 |
| CZT Counter | 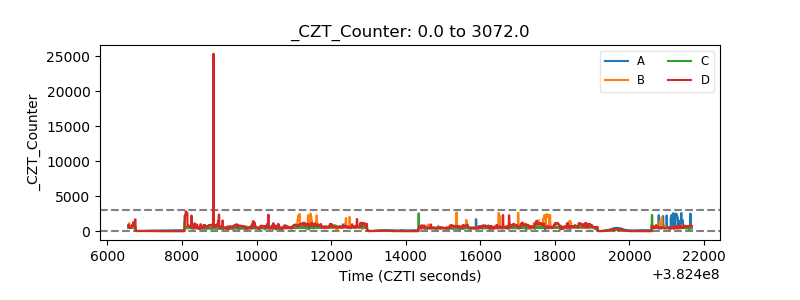 |
| +2.5 Volts monitor | 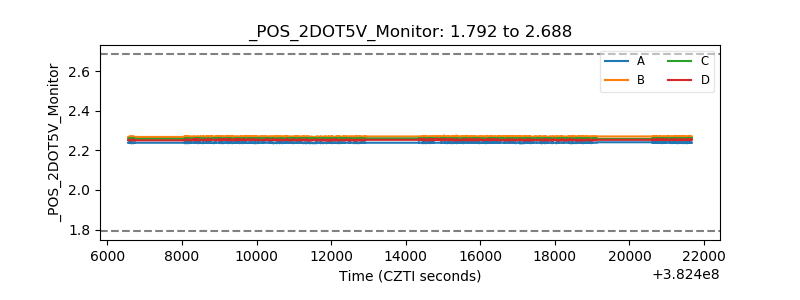 |
| +5 Volts monitor | 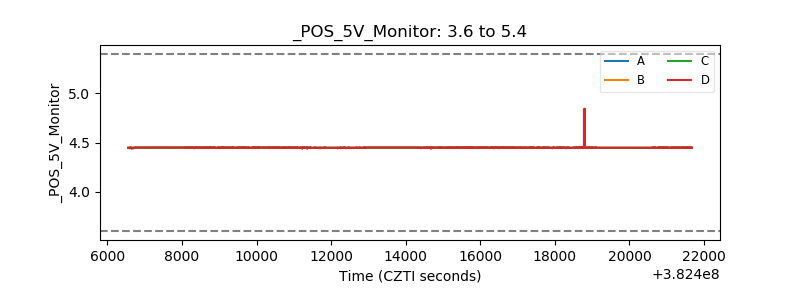 |
| _ROLL_ROT | 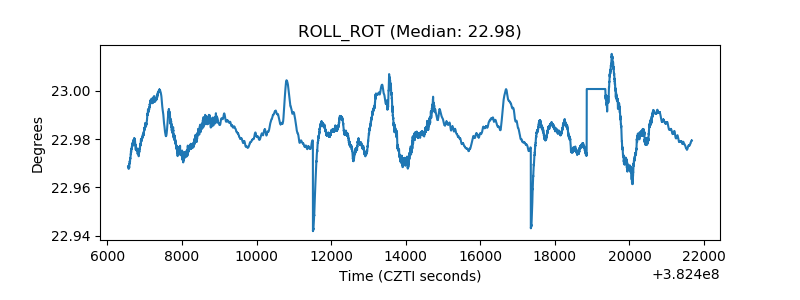 |
| _Roll_DEC | 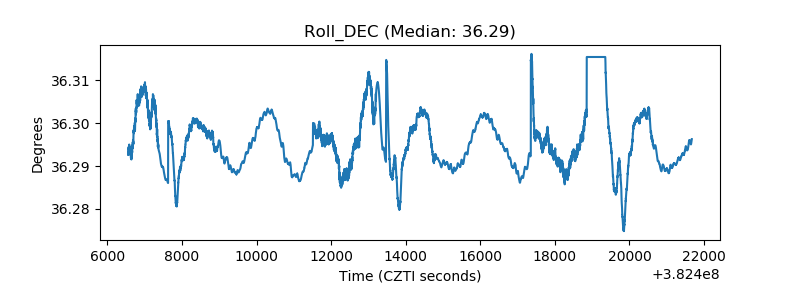 |
| _Roll_RA | 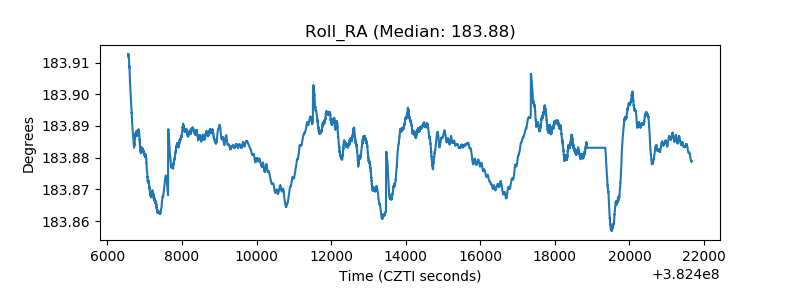 |
| Veto Counter | 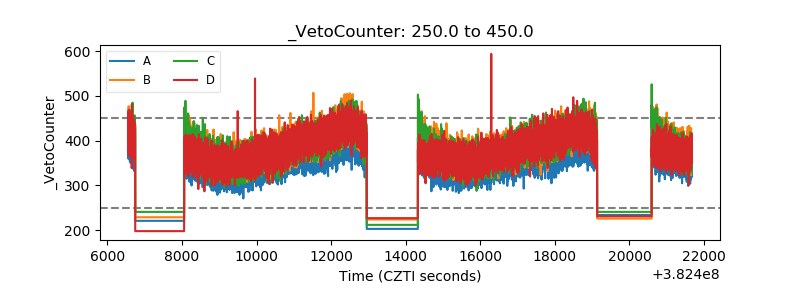 |