| Param | Original file | Final file |
|---|---|---|
| Filename | modeM0/AS1A05_118T04_9000004926_34486cztM0_level2.evt | modeM0/AS1A05_118T04_9000004926_34486cztM0_level2_quad_clean.evt |
| Size (bytes) | 368,879,040 | 45,734,400 |
| Size | 351.8 MB | 43.6 MB |
| Events in quadrant A | 2,097,608 | 272,168 |
| Events in quadrant B | 3,205,733 | 274,185 |
| Events in quadrant C | 2,205,782 | 276,001 |
| Events in quadrant D | 3,366,249 | 256,068 |
| Mode M9 | |||
|---|---|---|---|
| Quadrant | BADHDUFLAG | Total packets | Discarded packets |
| A | 0 | 13 | 0 |
| B | 0 | 13 | 0 |
| C | 0 | 13 | 0 |
| D | 0 | 13 | 0 |
| Mode SS | |||
|---|---|---|---|
| Quadrant | BADHDUFLAG | Total packets | Discarded packets |
| A | 0 | 88 | 0 |
| B | 0 | 88 | 0 |
| C | 0 | 88 | 0 |
| D | 0 | 88 | 0 |
| Mode M0 | |||
|---|---|---|---|
| Quadrant | BADHDUFLAG | Total packets | Discarded packets |
| A | 0 | 9069 | 2 |
| B | 0 | 12493 | 1 |
| C | 0 | 9208 | 1 |
| D | 0 | 13014 | 1 |
| Quadrant | Total seconds | Saturated seconds | Saturation percentage |
|---|---|---|---|
| A | 4351 | 17 | 0.390715% |
| B | 4351 | 508 | 11.675477% |
| C | 4351 | 13 | 0.298782% |
| D | 4351 | 268 | 6.159504% |
Noise dominated data is calculated using 1-second bins in cleaned event files. If a bin has >2000 counts, and if more than 50% of those come from <1% of pixels, then it is considered to be noise-dominated and hence unusable.
| Quadrant | # 1 sec bins | Bins with >0 counts | Bins with >2000 counts | High rate bins dominated by noise | Noise dominated (total time) | Noise dominated (detector-on time) | Marked lightcurve |
|---|---|---|---|---|---|---|---|
| A | 5664 | 4352 | 8 | 8 | 0.14% | 0.18% | 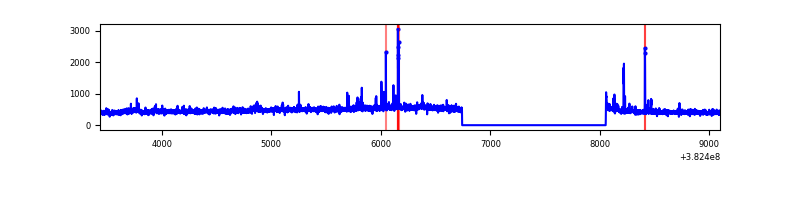 |
| B | 5664 | 4352 | 283 | 283 | 5.00% | 6.50% | 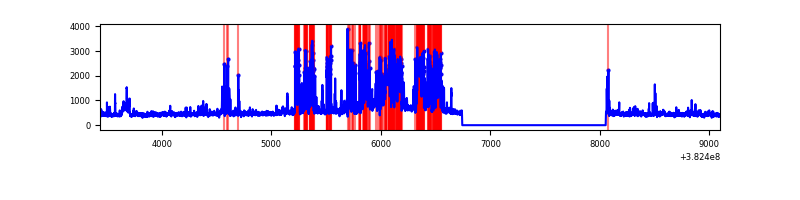 |
| C | 5664 | 4352 | 4 | 4 | 0.07% | 0.09% | 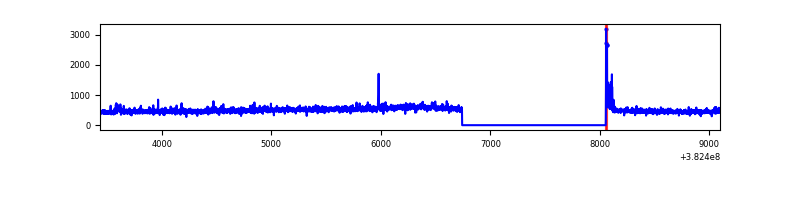 |
| D | 5664 | 4352 | 215 | 215 | 3.80% | 4.94% | 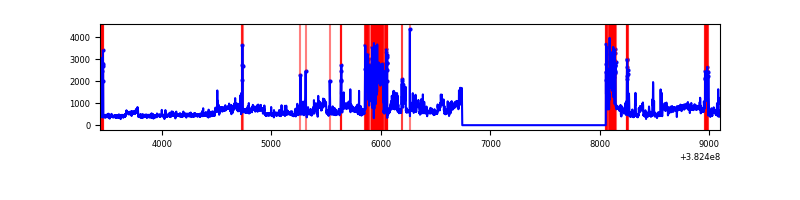 |
Top three noisy pixels from each quadrant. If the there are fewer than three noisy pixels in the level2.evt file, extra rows are filled as -1
| Pixel properties | Quadrant properties | ||||||
|---|---|---|---|---|---|---|---|
| Quadrant | DetID | PixID | Counts | Sigma | Mean | Median | Sigma |
| A | 15 | 169 | 52028 | 495.1 | 512 | 502 | 104.1 |
| A | 9 | 143 | 30635 | 289.54 | 512 | 502 | 104.1 |
| A | 10 | 83 | 21206 | 198.94 | 512 | 502 | 104.1 |
| B | 5 | 172 | 1045099 | 11191.38 | 480 | 468 | 93.3 |
| B | 0 | 189 | 129252 | 1379.69 | 480 | 468 | 93.3 |
| B | 5 | 255 | 59413 | 631.49 | 480 | 468 | 93.3 |
| C | 15 | 214 | 182214 | 1580.04 | 495 | 499 | 115.0 |
| C | 14 | 67 | 43852 | 376.96 | 495 | 499 | 115.0 |
| C | 0 | 10 | 35890 | 307.73 | 495 | 499 | 115.0 |
| D | 8 | 195 | 623804 | 5167.38 | 485 | 469 | 120.6 |
| D | 12 | 79 | 336258 | 2783.65 | 485 | 469 | 120.6 |
| D | 1 | 52 | 188164 | 1555.97 | 485 | 469 | 120.6 |
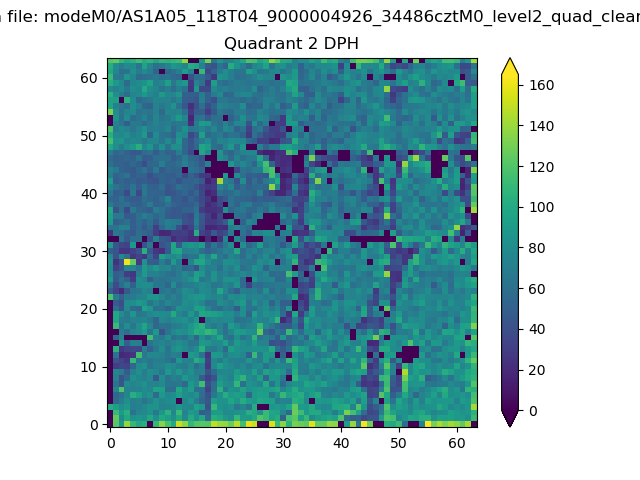
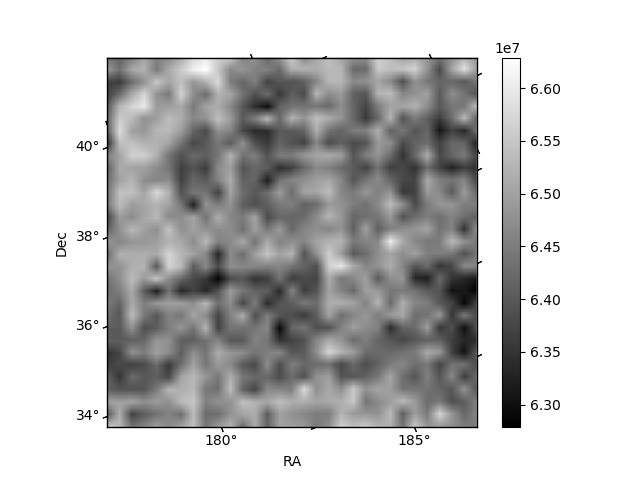
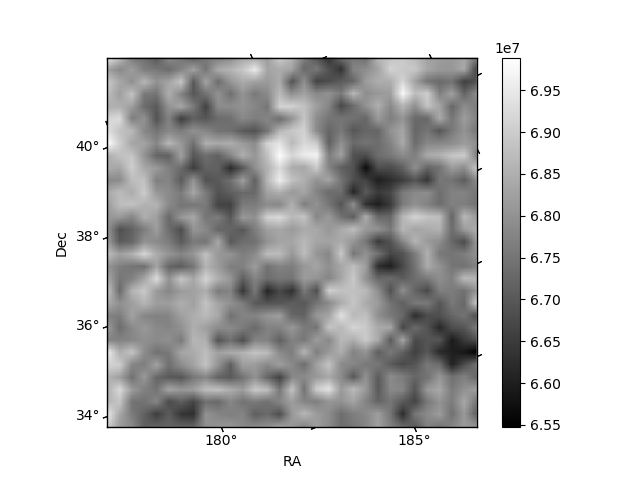
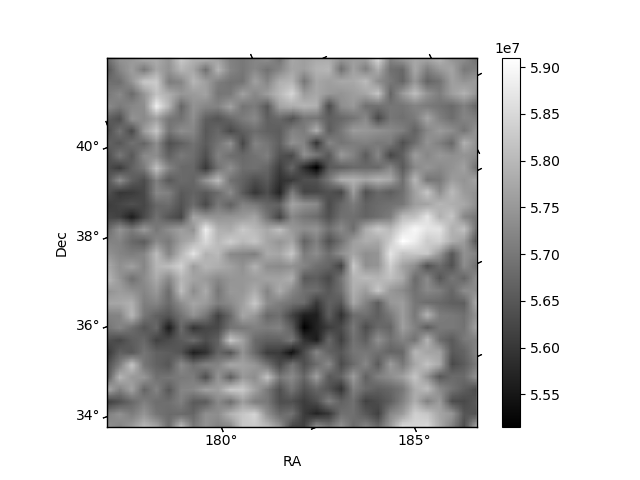
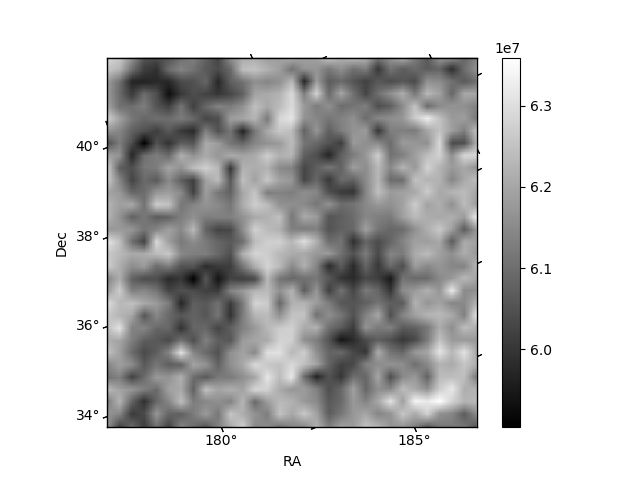
Histogram calculated using DETX and DETY for each event in the final _common_clean file
| Quadrant A | 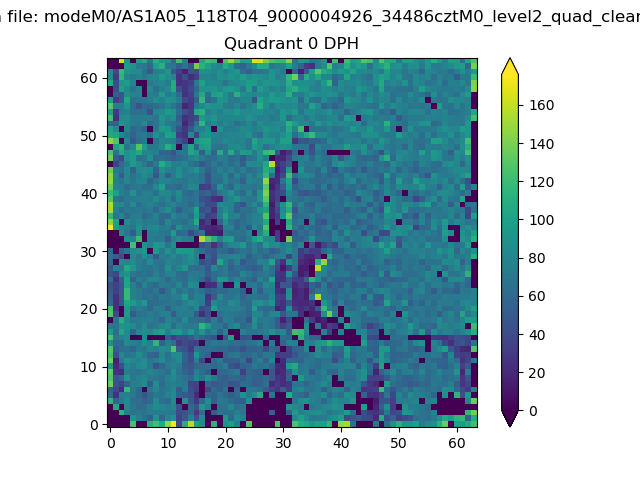 |
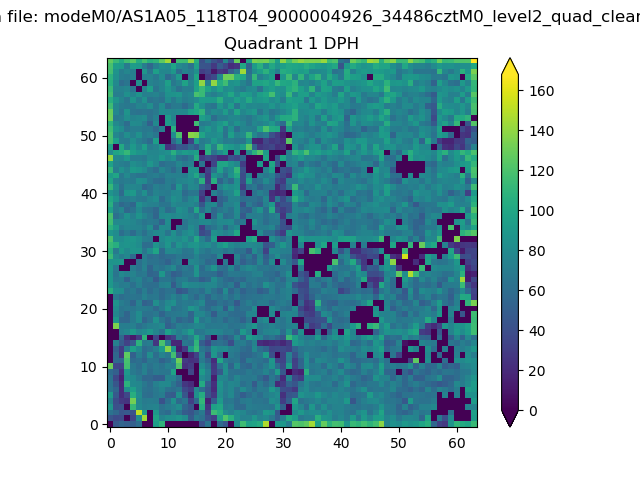 |
Quadrant B |
|---|---|---|---|
| Quadrant D | 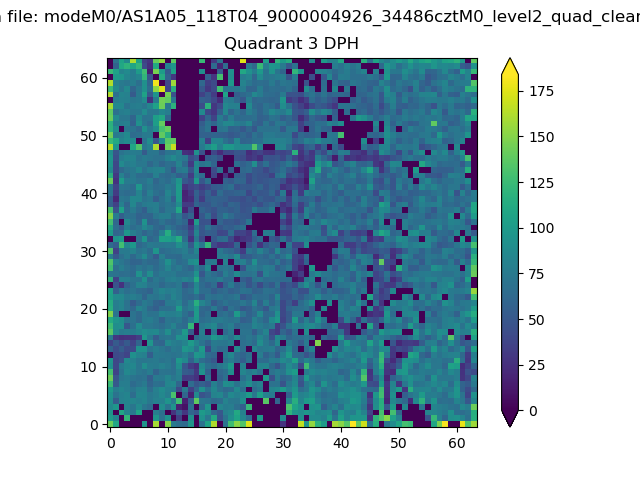 |
 |
Quadrant C |
| Plot type | Count rate plots | Images |
|---|---|---|
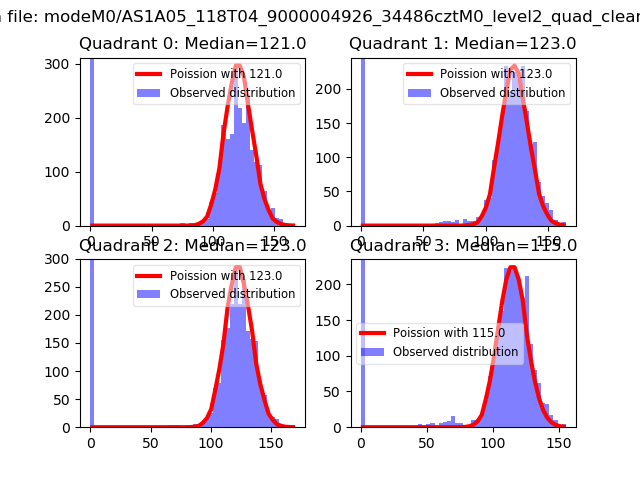
| Comparison with Poisson distribution Blue bars denote a histogram of data divided into 1 sec bins. Red curve is a Poisson curve with rate = median count rate of data. |
 |
 |
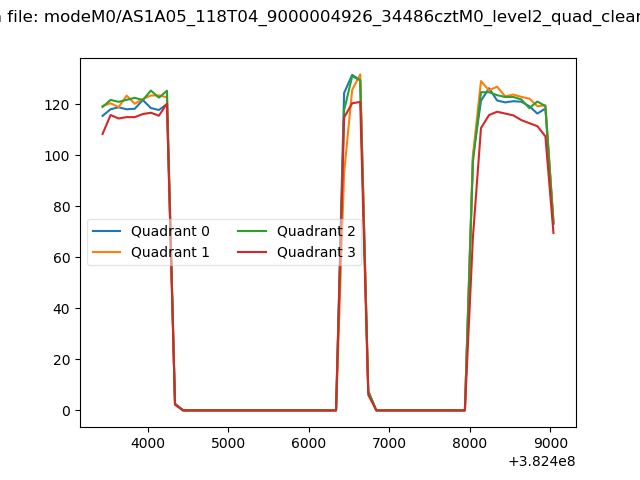
| Quadrant-wise count rates Data is divided into 100 sec bins |
 |
|
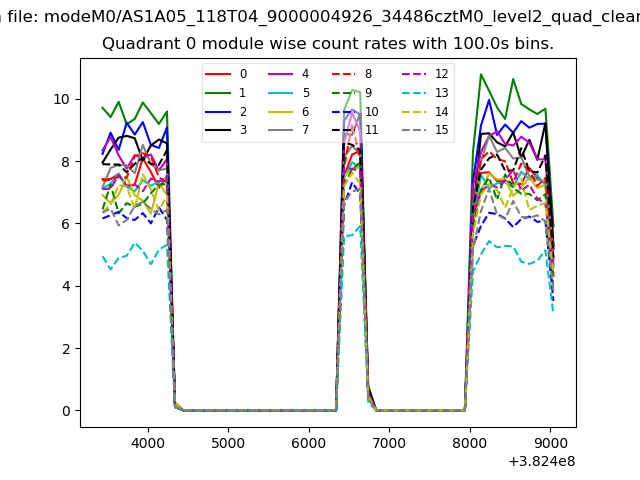
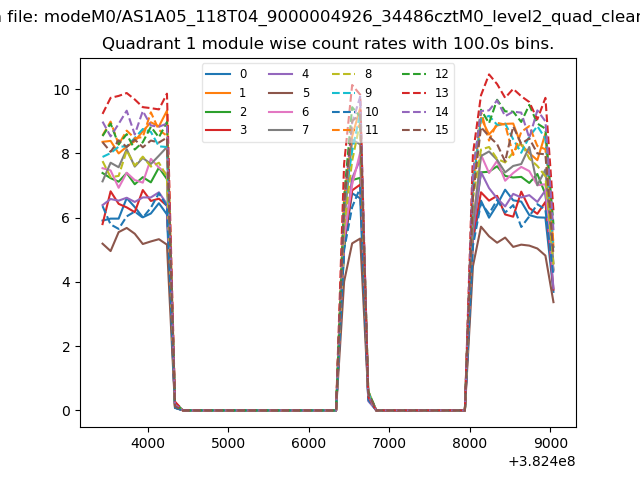
| Module-wise count rates for Quadrant A Data is divided into 100 sec bins |
 |
 |
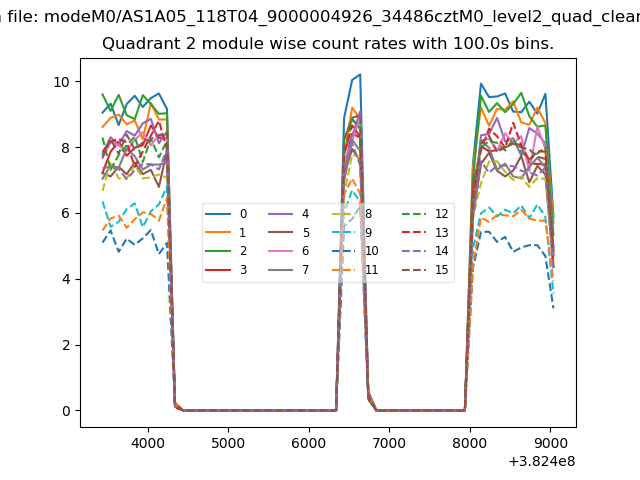
| Module-wise count rates for Quadrant B Data is divided into 100 sec bins |
 |
 |
| Module-wise count rates for Quadrant C Data is divided into 100 sec bins |
 |
 |
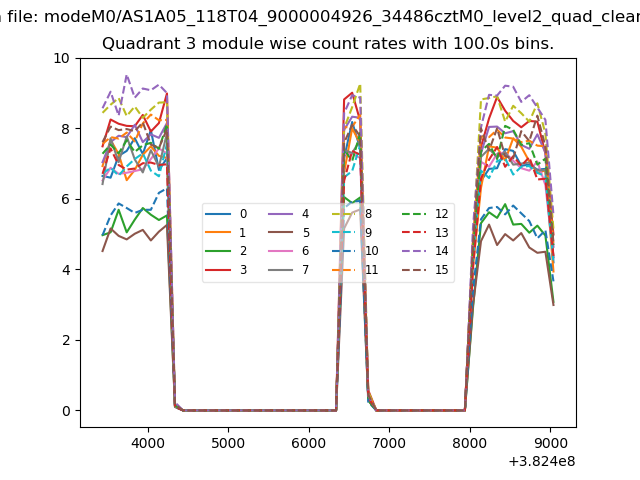
| Module-wise count rates for Quadrant D Data is divided into 100 sec bins |
 |
 |
| Parameter | Plot |
|---|---|
| CZT HV Monitor | 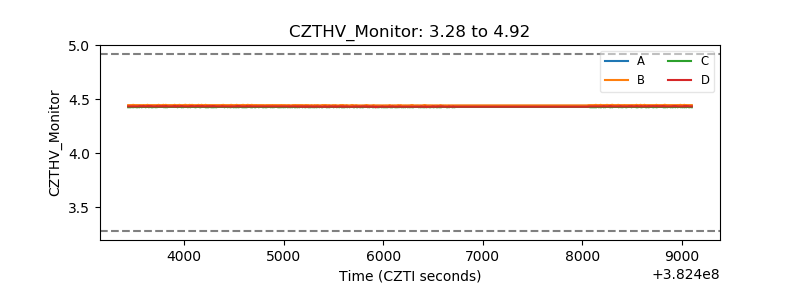 |
| D_VDD | 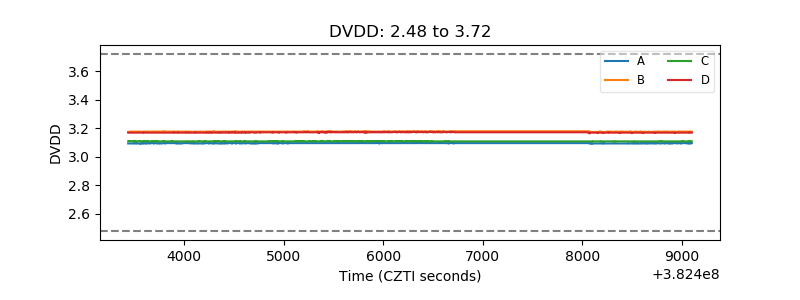 |
| Temperature 1 | 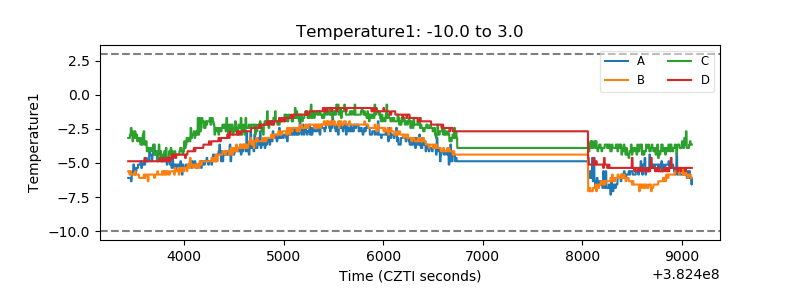 |
| Veto HV Monitor | 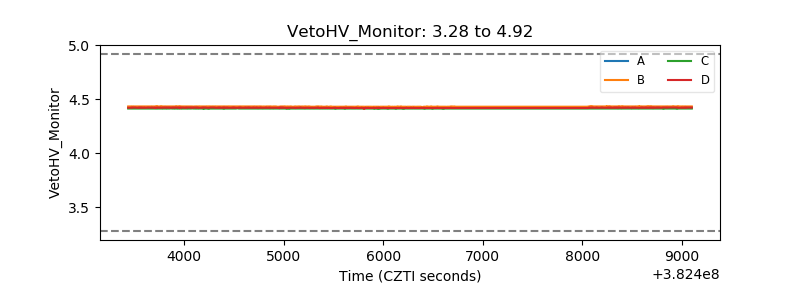 |
| Veto LLD | 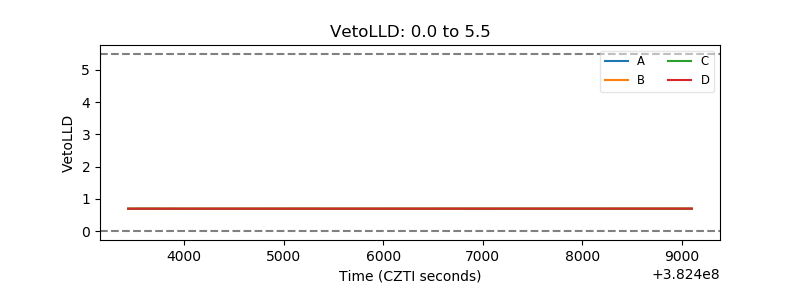 |
| Alpha Counter | 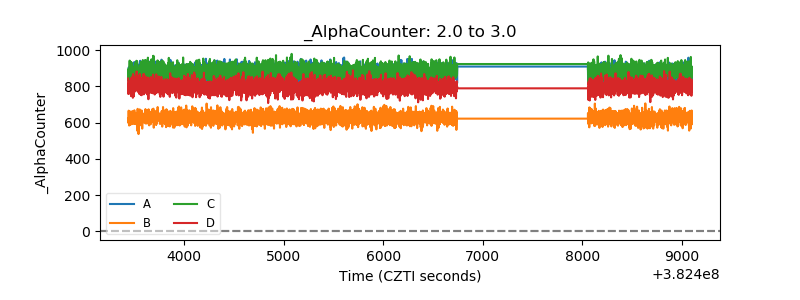 |
| _CPM_Rate | 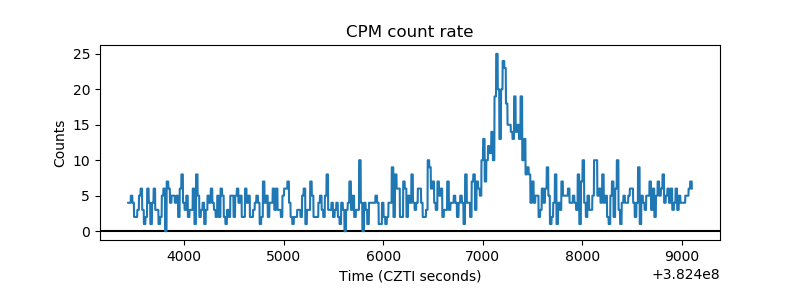 |
| CZT Counter | 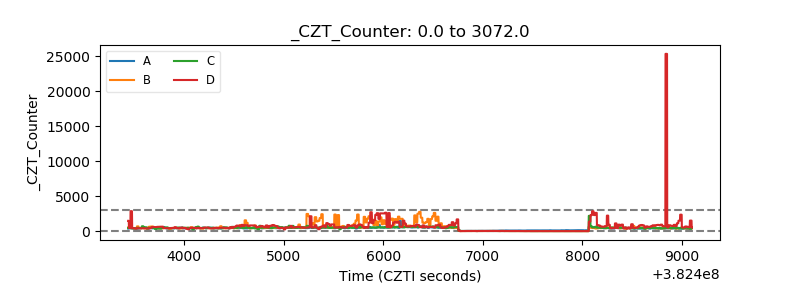 |
| +2.5 Volts monitor | 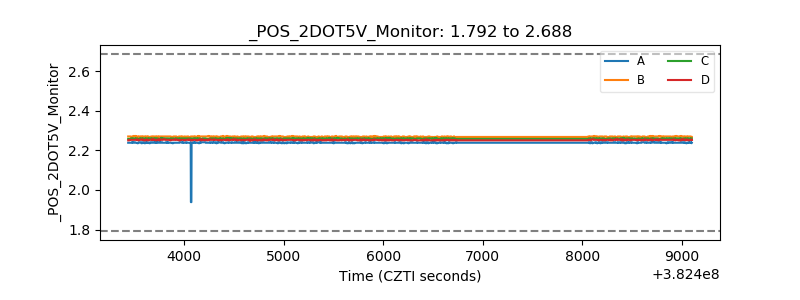 |
| +5 Volts monitor | 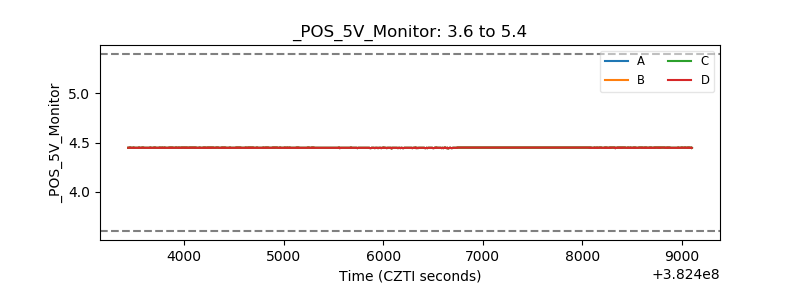 |
| _ROLL_ROT | 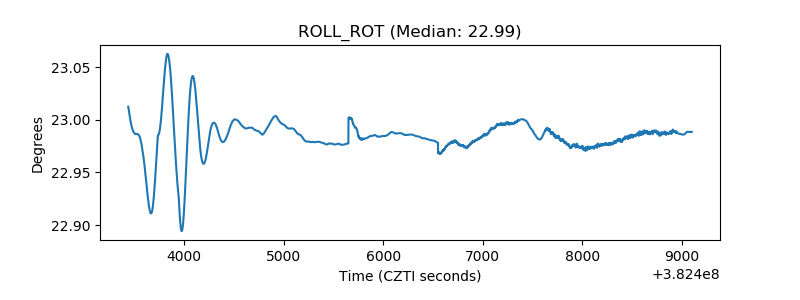 |
| _Roll_DEC | 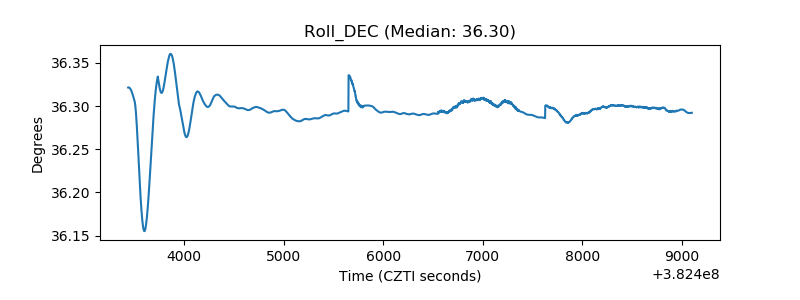 |
| _Roll_RA | 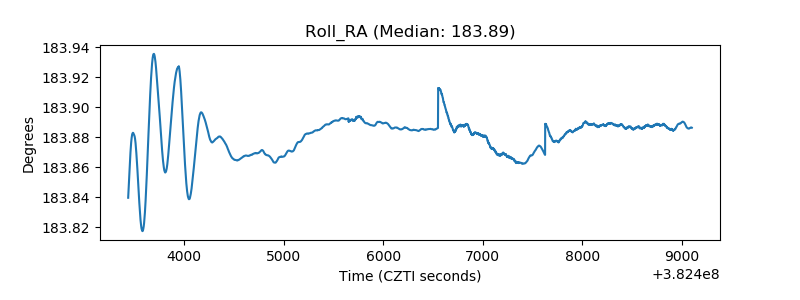 |
| Veto Counter | 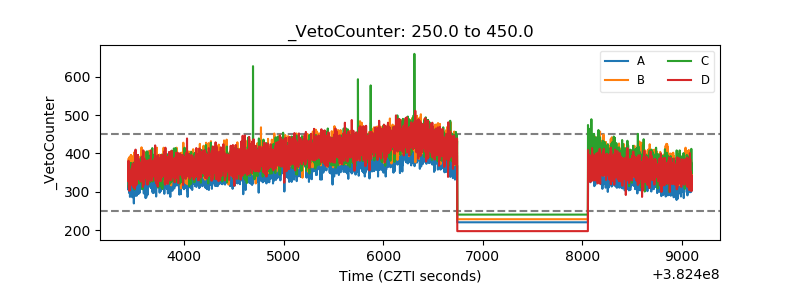 |