| Param | Original file | Final file |
|---|---|---|
| Filename | modeM0/AS1A10_071T13_9000004922_34470cztM0_level2.evt | modeM0/AS1A10_071T13_9000004922_34470cztM0_level2_quad_clean.evt |
| Size (bytes) | 564,364,800 | 76,953,600 |
| Size | 538.2 MB | 73.4 MB |
| Events in quadrant A | 2,740,946 | 496,538 |
| Events in quadrant B | 3,294,212 | 498,751 |
| Events in quadrant C | 2,929,713 | 496,174 |
| Events in quadrant D | 7,739,884 | 438,740 |
| Mode M9 | |||
|---|---|---|---|
| Quadrant | BADHDUFLAG | Total packets | Discarded packets |
| A | 0 | 22 | 0 |
| B | 0 | 22 | 0 |
| C | 0 | 22 | 0 |
| D | 0 | 23 | 0 |
| Mode SS | |||
|---|---|---|---|
| Quadrant | BADHDUFLAG | Total packets | Discarded packets |
| A | 0 | 116 | 0 |
| B | 0 | 116 | 0 |
| C | 0 | 116 | 0 |
| D | 0 | 116 | 0 |
| Mode M0 | |||
|---|---|---|---|
| Quadrant | BADHDUFLAG | Total packets | Discarded packets |
| A | 0 | 11914 | 3 |
| B | 0 | 13588 | 2 |
| C | 0 | 12122 | 2 |
| D | 0 | 26979 | 2 |
| Quadrant | Total seconds | Saturated seconds | Saturation percentage |
|---|---|---|---|
| A | 5720 | 19 | 0.332168% |
| B | 5720 | 190 | 3.321678% |
| C | 5720 | 10 | 0.174825% |
| D | 5720 | 878 | 15.349650% |
Noise dominated data is calculated using 1-second bins in cleaned event files. If a bin has >2000 counts, and if more than 50% of those come from <1% of pixels, then it is considered to be noise-dominated and hence unusable.
| Quadrant | # 1 sec bins | Bins with >0 counts | Bins with >2000 counts | High rate bins dominated by noise | Noise dominated (total time) | Noise dominated (detector-on time) | Marked lightcurve |
|---|---|---|---|---|---|---|---|
| A | 7123 | 5721 | 4 | 4 | 0.06% | 0.07% | 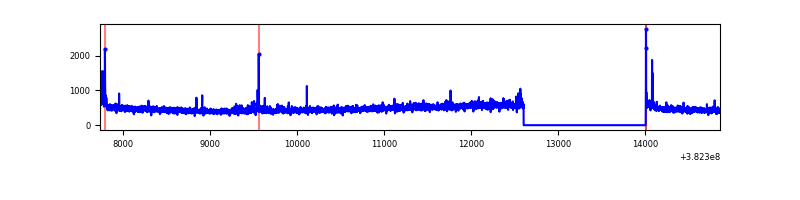 |
| B | 7123 | 5721 | 120 | 120 | 1.68% | 2.10% | 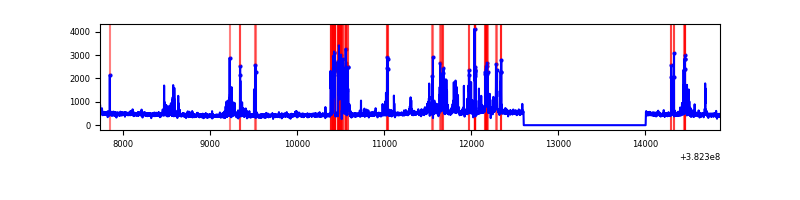 |
| C | 7123 | 5721 | 6 | 6 | 0.08% | 0.10% | 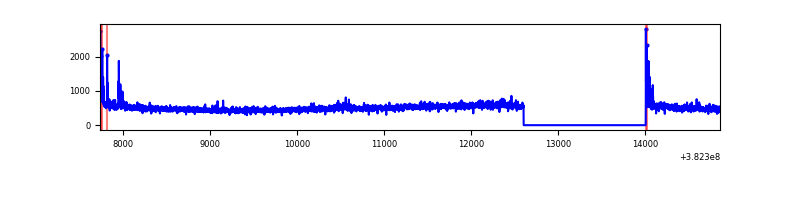 |
| D | 7123 | 5721 | 927 | 927 | 13.01% | 16.20% | 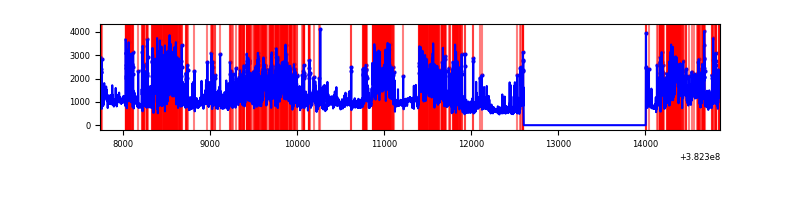 |
Top three noisy pixels from each quadrant. If the there are fewer than three noisy pixels in the level2.evt file, extra rows are filled as -1
| Pixel properties | Quadrant properties | ||||||
|---|---|---|---|---|---|---|---|
| Quadrant | DetID | PixID | Counts | Sigma | Mean | Median | Sigma |
| A | 15 | 169 | 62922 | 460.47 | 673 | 660 | 135.2 |
| A | 10 | 83 | 36403 | 264.34 | 673 | 660 | 135.2 |
| A | 13 | 6 | 19698 | 140.8 | 673 | 660 | 135.2 |
| B | 5 | 172 | 573183 | 4482.69 | 662 | 645 | 127.7 |
| B | 0 | 229 | 49076 | 379.19 | 662 | 645 | 127.7 |
| B | 5 | 173 | 26113 | 199.4 | 662 | 645 | 127.7 |
| C | 15 | 214 | 241381 | 1592.04 | 653 | 661 | 151.2 |
| C | 0 | 10 | 51323 | 335.06 | 653 | 661 | 151.2 |
| C | 15 | 208 | 30620 | 198.14 | 653 | 661 | 151.2 |
| D | 7 | 223 | 2998561 | 19337.23 | 625 | 608 | 155.0 |
| D | 10 | 203 | 1145459 | 7384.45 | 625 | 608 | 155.0 |
| D | 8 | 195 | 512670 | 3302.87 | 625 | 608 | 155.0 |
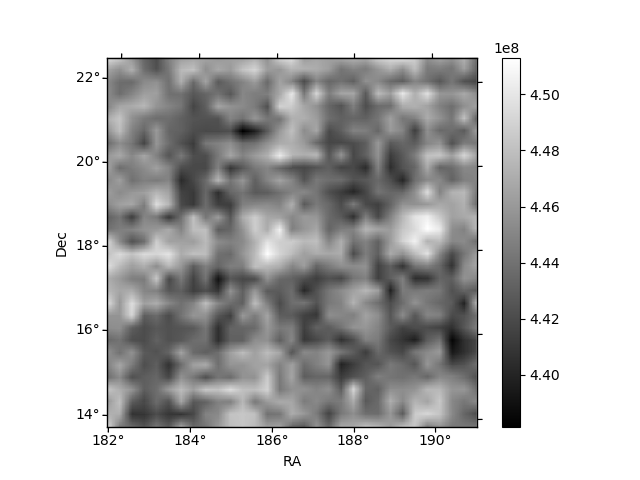
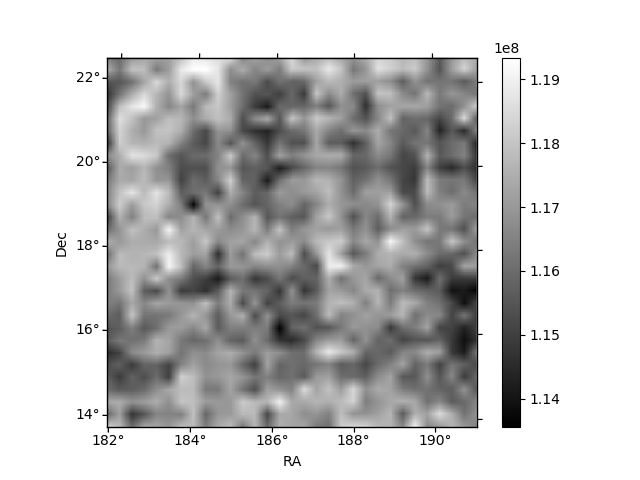
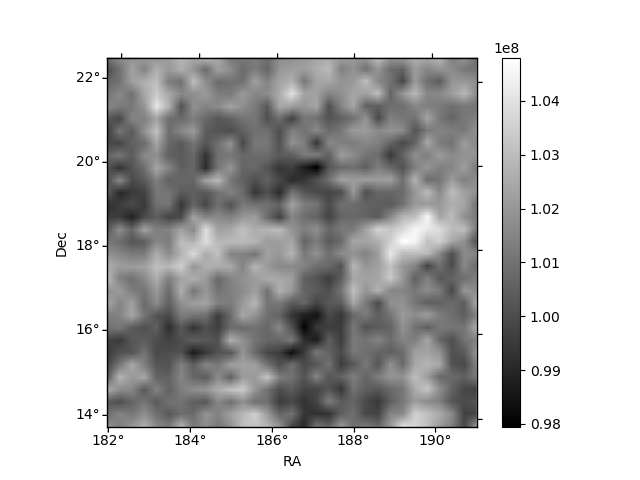
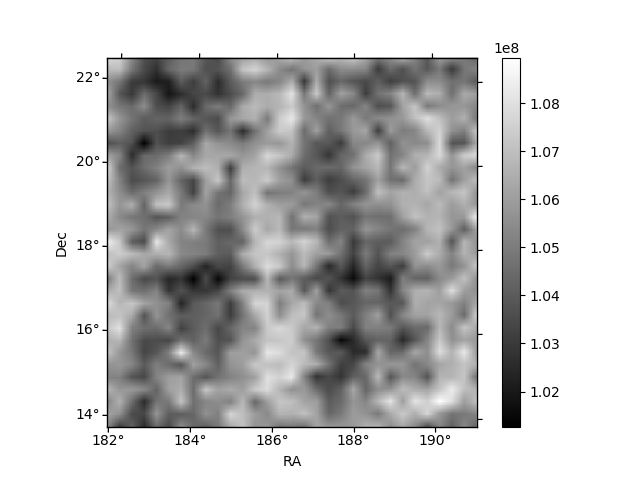
Histogram calculated using DETX and DETY for each event in the final _common_clean file
| Quadrant A | 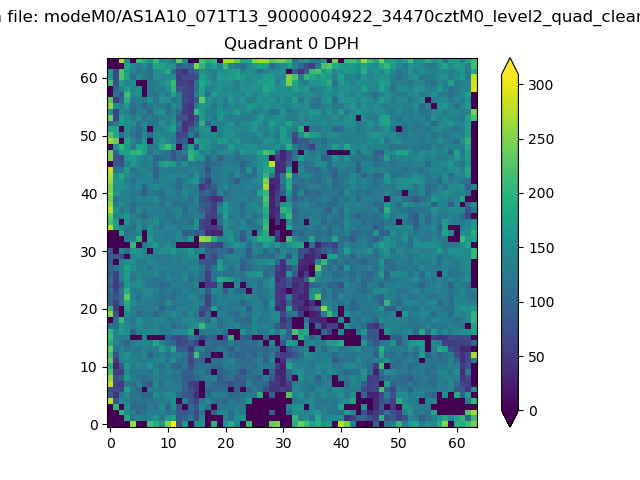 |
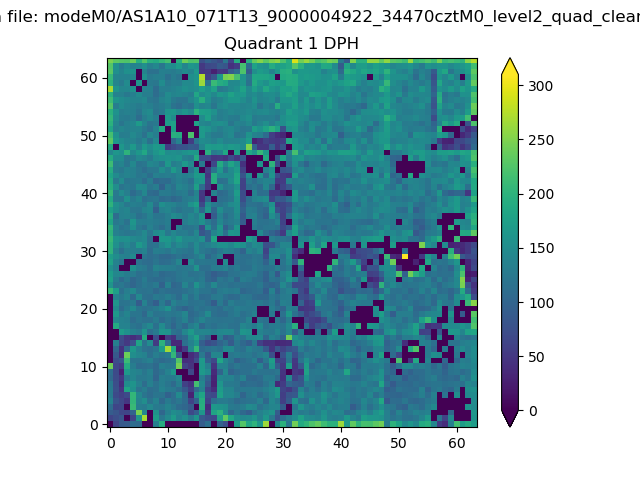 |
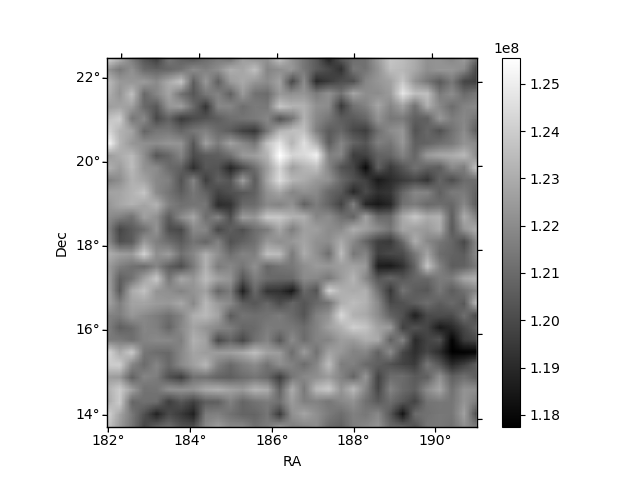
Quadrant B |
|---|---|---|---|
| Quadrant D | 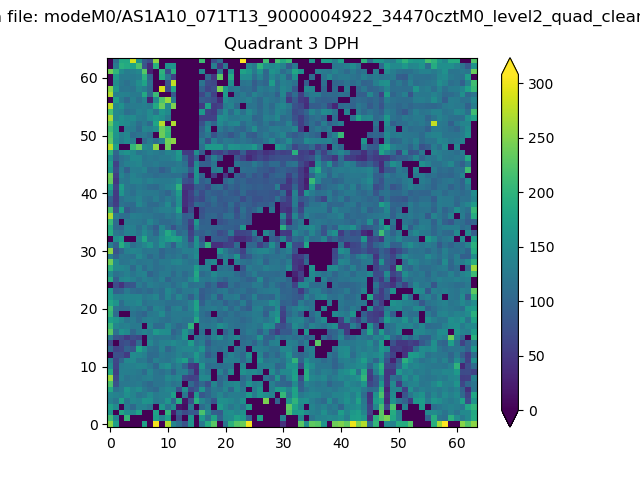 |
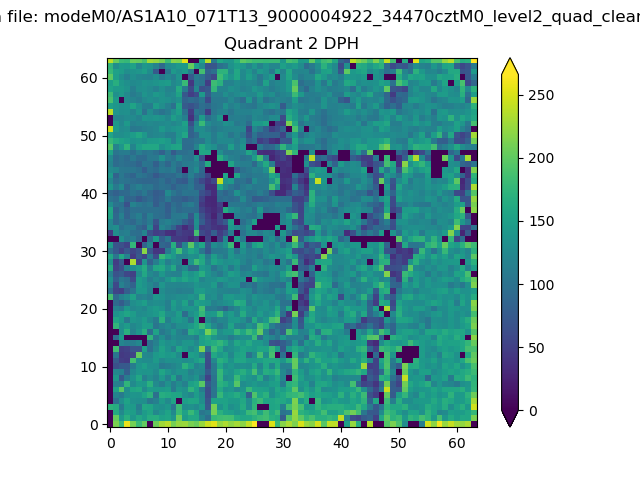 |
Quadrant C |
| Plot type | Count rate plots | Images |
|---|---|---|
| Comparison with Poisson distribution Blue bars denote a histogram of data divided into 1 sec bins. Red curve is a Poisson curve with rate = median count rate of data. |
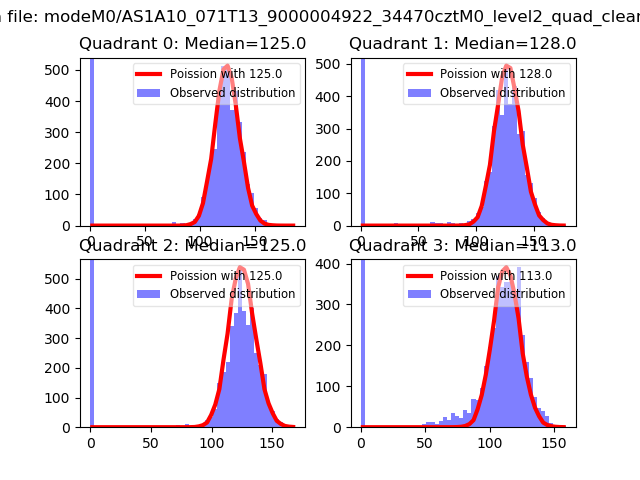 |
 |
| Quadrant-wise count rates Data is divided into 100 sec bins |
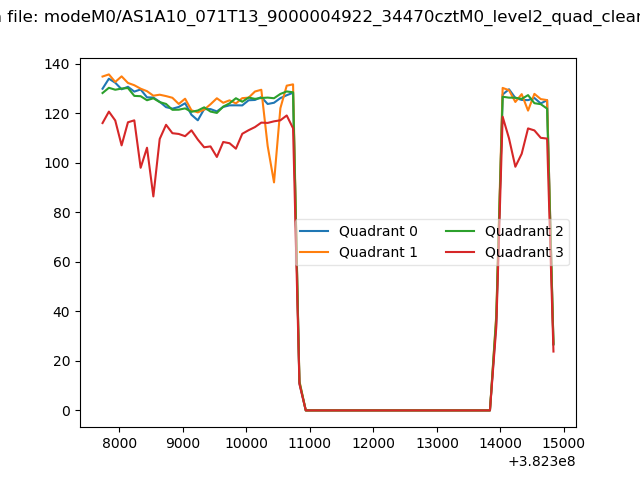 |
|
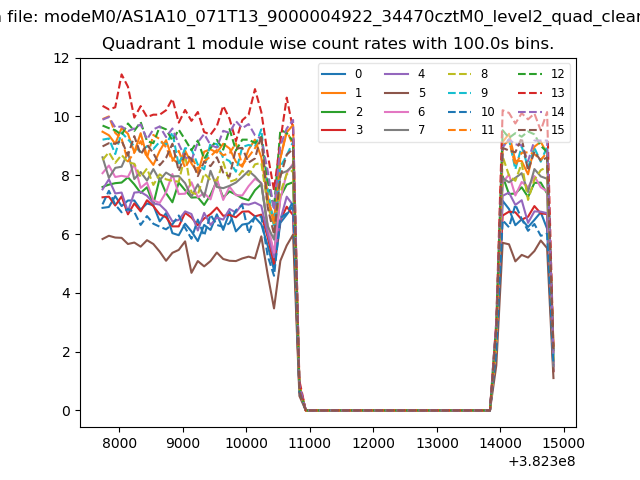
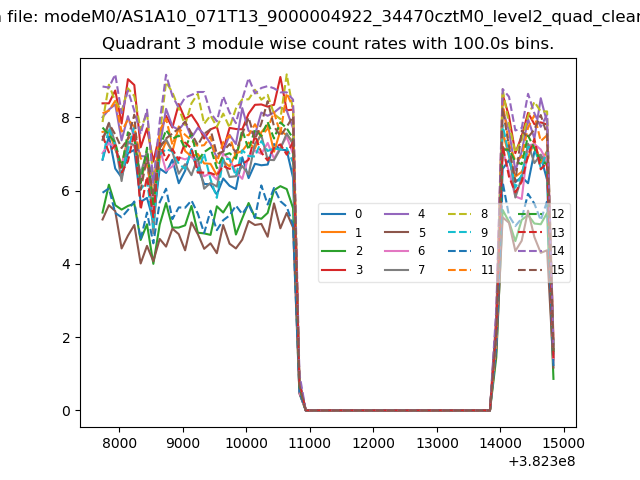
| Module-wise count rates for Quadrant A Data is divided into 100 sec bins |
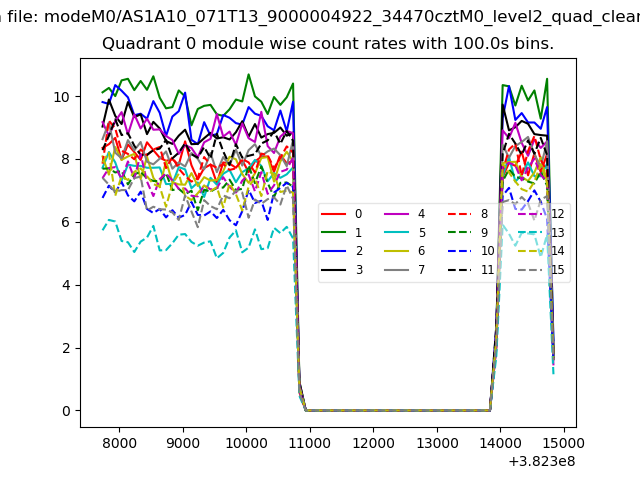 |
 |
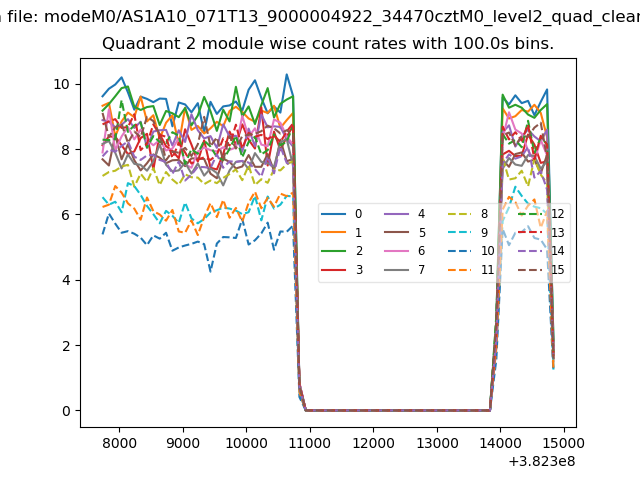
| Module-wise count rates for Quadrant B Data is divided into 100 sec bins |
 |
 |
| Module-wise count rates for Quadrant C Data is divided into 100 sec bins |
 |
 |
| Module-wise count rates for Quadrant D Data is divided into 100 sec bins |
 |
 |
| Parameter | Plot |
|---|---|
| CZT HV Monitor | 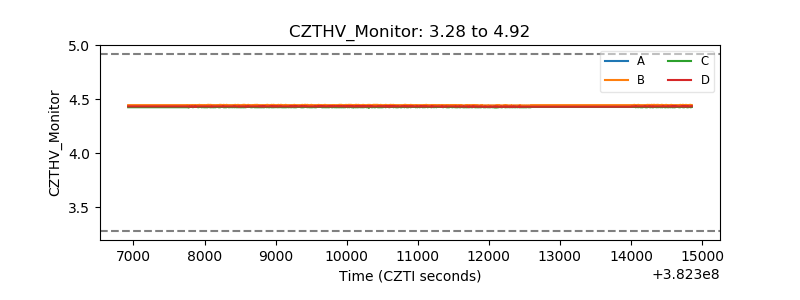 |
| D_VDD | 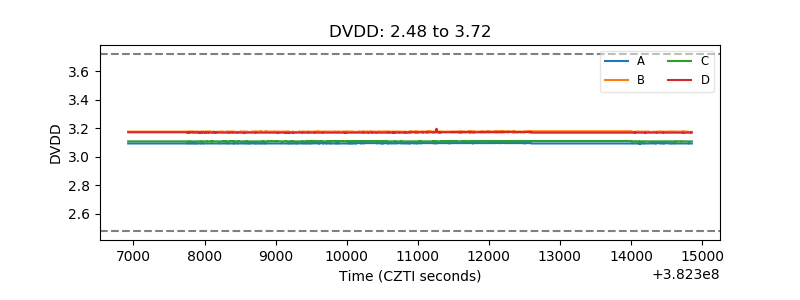 |
| Temperature 1 | 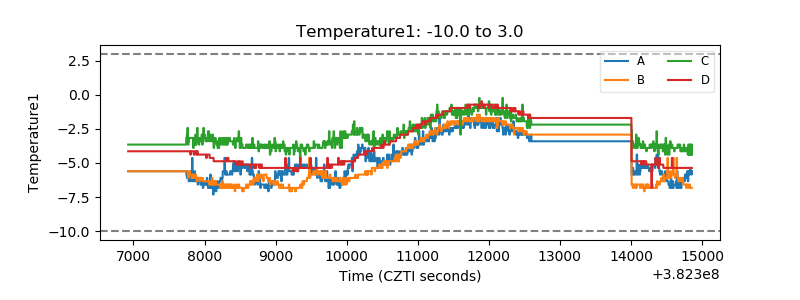 |
| Veto HV Monitor | 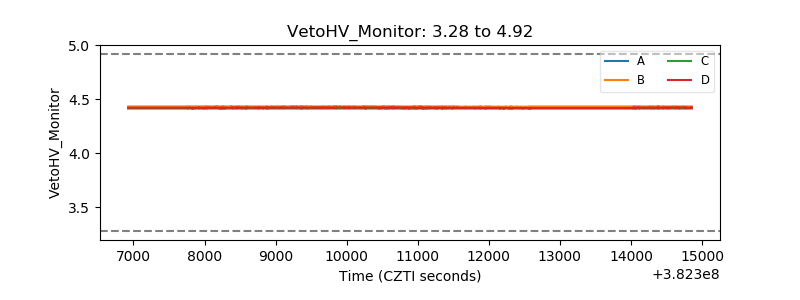 |
| Veto LLD | 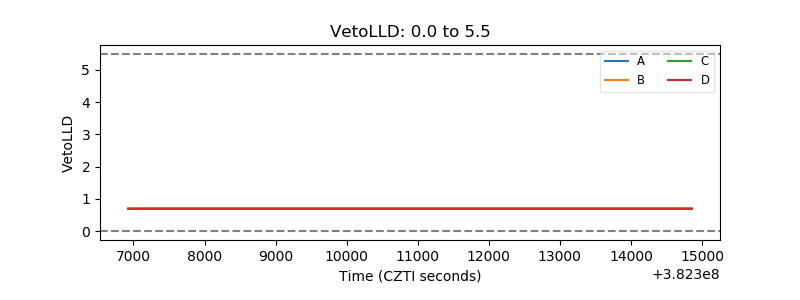 |
| Alpha Counter | 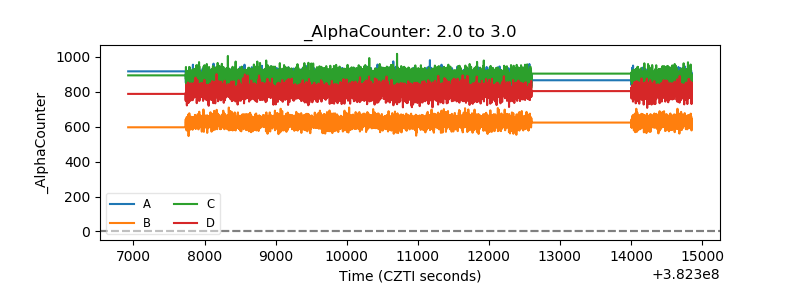 |
| _CPM_Rate | 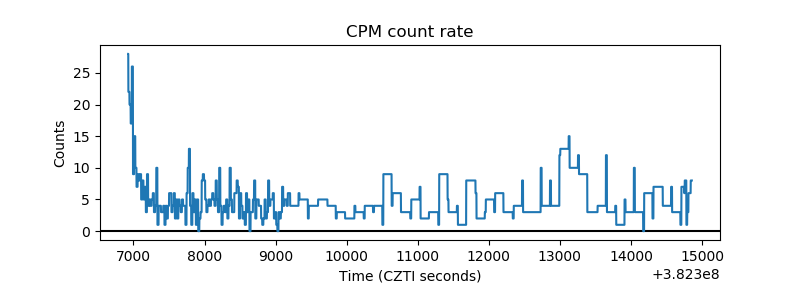 |
| CZT Counter | 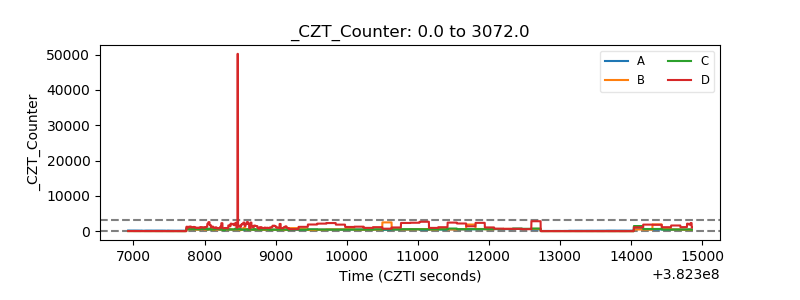 |
| +2.5 Volts monitor | 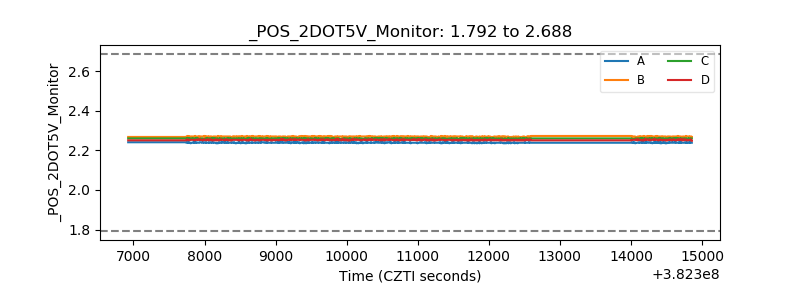 |
| +5 Volts monitor | 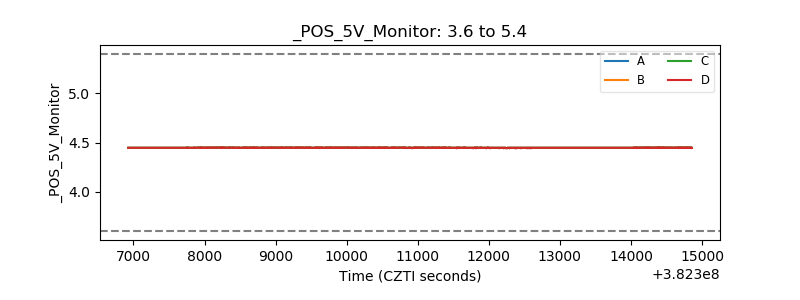 |
| _ROLL_ROT | 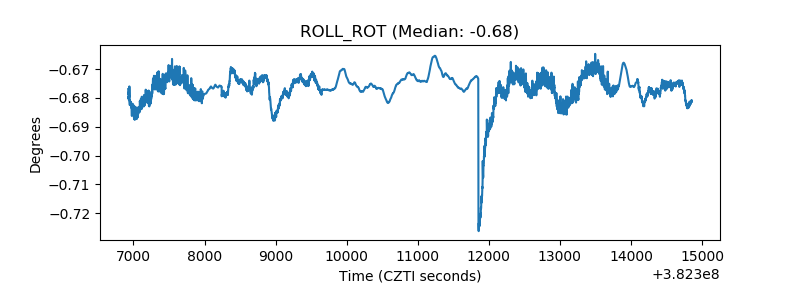 |
| _Roll_DEC | 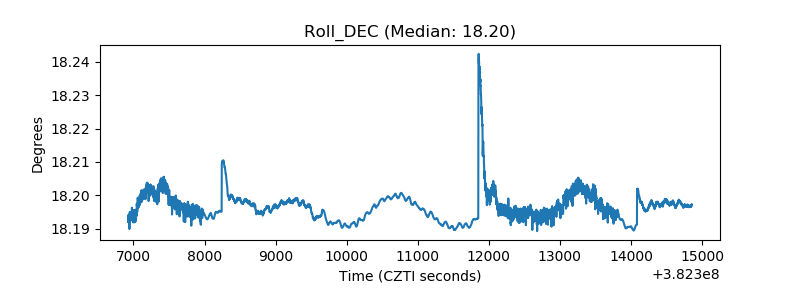 |
| _Roll_RA | 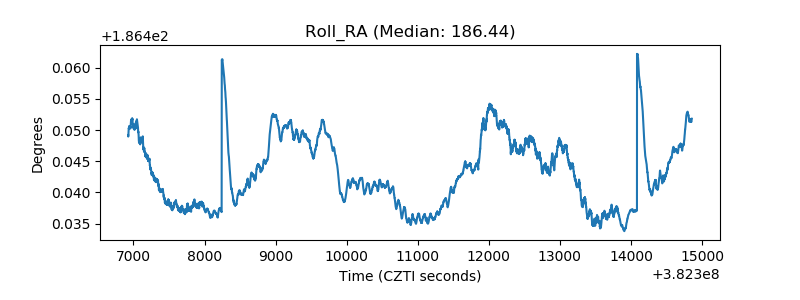 |
| Veto Counter | 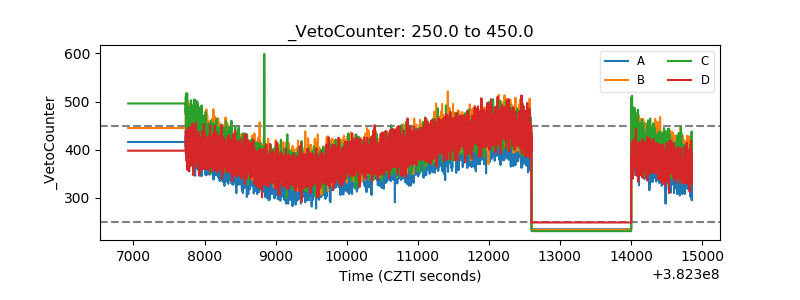 |