| Param | Original file | Final file |
|---|---|---|
| Filename | modeM0/AS1A10_071T13_9000004922cztM0_level2_bc.evt | modeM0/AS1A10_071T13_9000004922cztM0_level2_quad_clean.evt |
| Size (bytes) | 2,061,524,160 | 464,353,920 |
| Size | 1.9 GB | 442.8 MB |
| Events in quadrant A | 9,543,930 | 2,918,741 |
| Events in quadrant B | 11,493,492 | 2,947,088 |
| Events in quadrant C | 11,032,449 | 2,908,688 |
| Events in quadrant D | 27,715,322 | 2,616,229 |
| Mode M9 | |||
|---|---|---|---|
| Quadrant | BADHDUFLAG | Total packets | Discarded packets |
| A | 0 | 142 | 0 |
| B | 0 | 142 | 0 |
| C | 0 | 142 | 0 |
| D | 0 | 142 | 0 |
| Mode SS | |||
|---|---|---|---|
| Quadrant | BADHDUFLAG | Total packets | Discarded packets |
| A | 0 | 794 | 0 |
| B | 0 | 794 | 0 |
| C | 0 | 794 | 0 |
| D | 0 | 794 | 0 |
| Mode M0 | |||
|---|---|---|---|
| Quadrant | BADHDUFLAG | Total packets | Discarded packets |
| A | 0 | 84538 | 0 |
| B | 0 | 93984 | 0 |
| C | 0 | 86170 | 0 |
| D | 0 | 151702 | 0 |
| Quadrant | Total seconds | Saturated seconds | Saturation percentage |
|---|---|---|---|
| A | 38928 | 201 | 0.516338% |
| B | 38928 | 1334 | 3.426839% |
| C | 38928 | 249 | 0.639642% |
| D | 38928 | 4688 | 12.042746% |
Noise dominated data is calculated using 1-second bins in cleaned event files. If a bin has >2000 counts, and if more than 50% of those come from <1% of pixels, then it is considered to be noise-dominated and hence unusable.
| Quadrant | # 1 sec bins | Bins with >0 counts | Bins with >2000 counts | High rate bins dominated by noise | Noise dominated (total time) | Noise dominated (detector-on time) | Marked lightcurve |
|---|---|---|---|---|---|---|---|
| A | 63245 | 38936 | 20 | 20 | 0.03% | 0.05% | 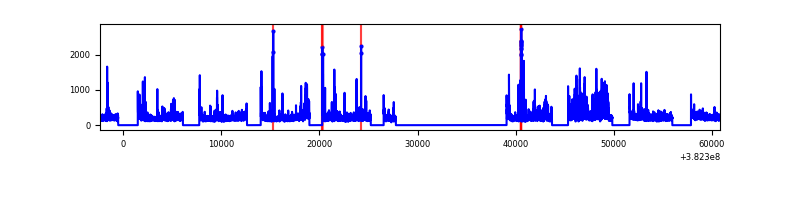 |
| B | 63245 | 38928 | 50 | 50 | 0.08% | 0.13% | 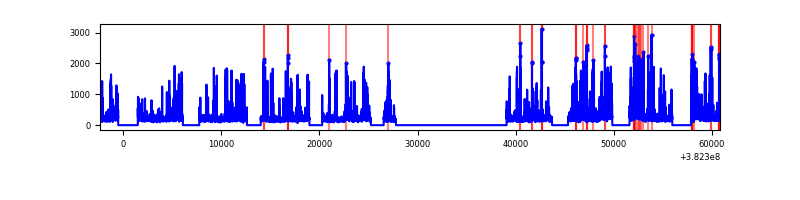 |
| C | 63245 | 38928 | 55 | 55 | 0.09% | 0.14% | 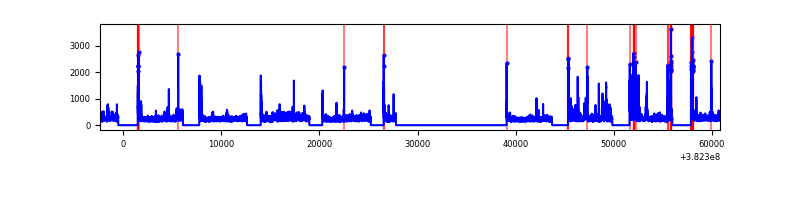 |
| D | 63245 | 38927 | 517 | 517 | 0.82% | 1.33% | 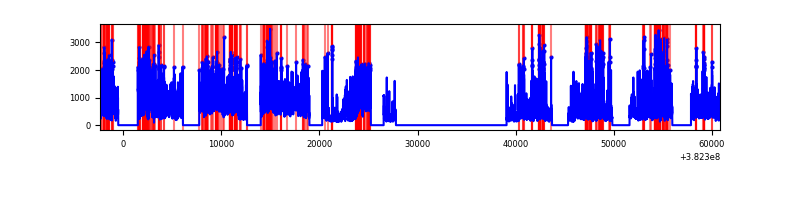 |
Top three noisy pixels from each quadrant. If the there are fewer than three noisy pixels in the level2.evt file, extra rows are filled as -1
| Pixel properties | Quadrant properties | ||||||
|---|---|---|---|---|---|---|---|
| Quadrant | DetID | PixID | Counts | Sigma | Mean | Median | Sigma |
| A | 15 | 169 | 1008554 | 2210.53 | 2067 | 2035 | 455.3 |
| A | 10 | 83 | 174648 | 379.09 | 2067 | 2035 | 455.3 |
| A | 9 | 143 | 127240 | 274.98 | 2067 | 2035 | 455.3 |
| B | 5 | 172 | 2350003 | 5807.38 | 2047 | 2005 | 404.3 |
| B | 5 | 31 | 332957 | 818.55 | 2047 | 2005 | 404.3 |
| B | 0 | 189 | 322723 | 793.24 | 2047 | 2005 | 404.3 |
| C | 15 | 214 | 1552318 | 3405.1 | 2011 | 1998 | 455.3 |
| C | 15 | 208 | 650743 | 1424.9 | 2011 | 1998 | 455.3 |
| C | 14 | 67 | 362891 | 792.66 | 2011 | 1998 | 455.3 |
| D | 7 | 223 | 7501316 | 16475.04 | 1917 | 1858 | 455.2 |
| D | 8 | 195 | 4788520 | 10515.48 | 1917 | 1858 | 455.2 |
| D | 10 | 203 | 1999138 | 4387.69 | 1917 | 1858 | 455.2 |
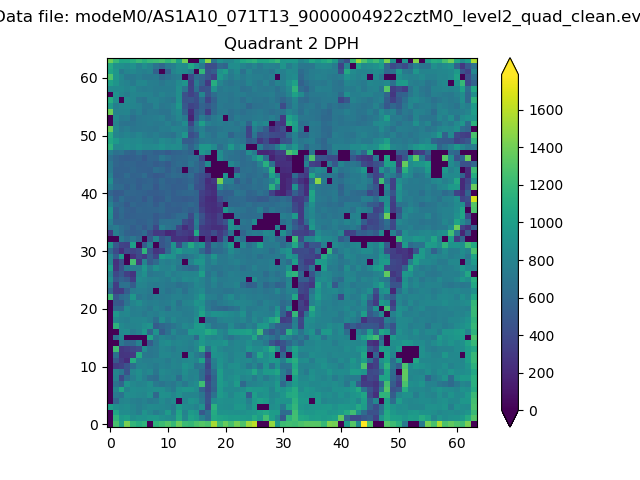
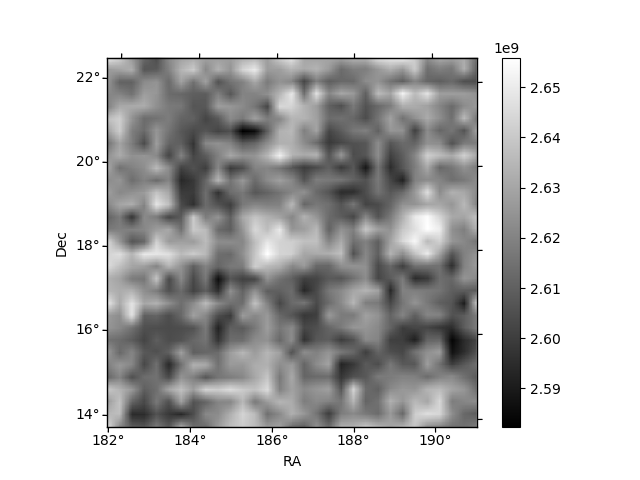
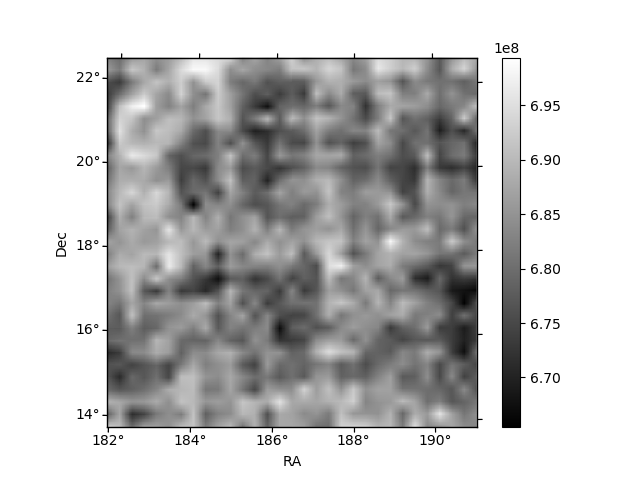
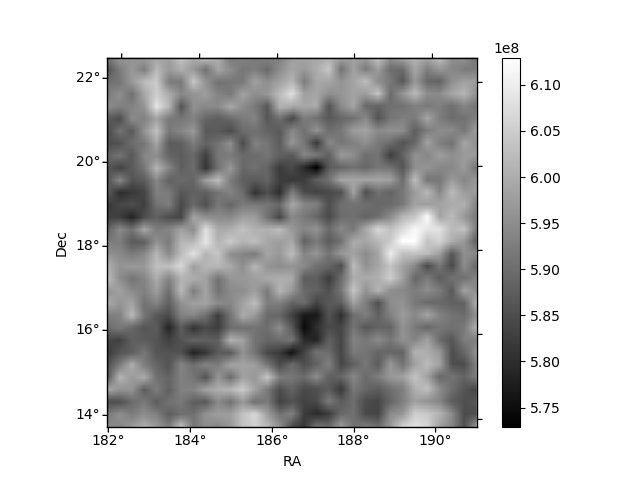
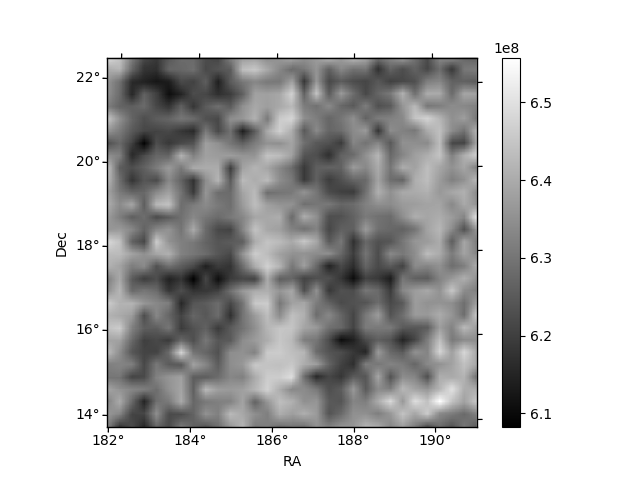
Histogram calculated using DETX and DETY for each event in the final _common_clean file
| Quadrant A | 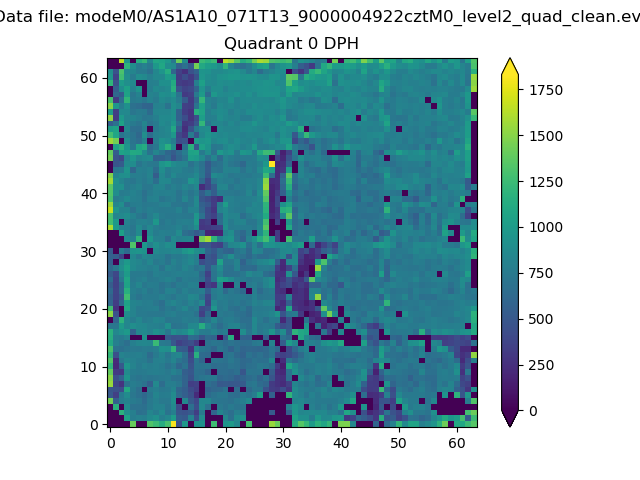 |
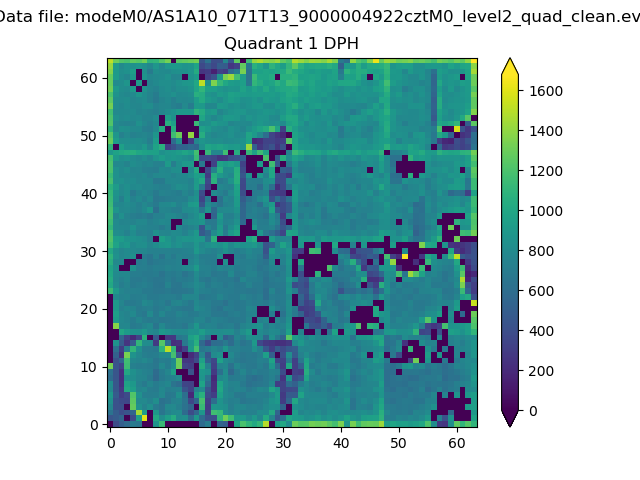 |
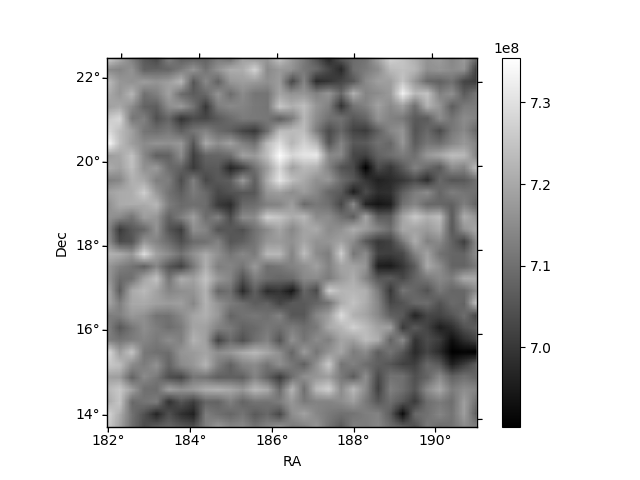
Quadrant B |
|---|---|---|---|
| Quadrant D | 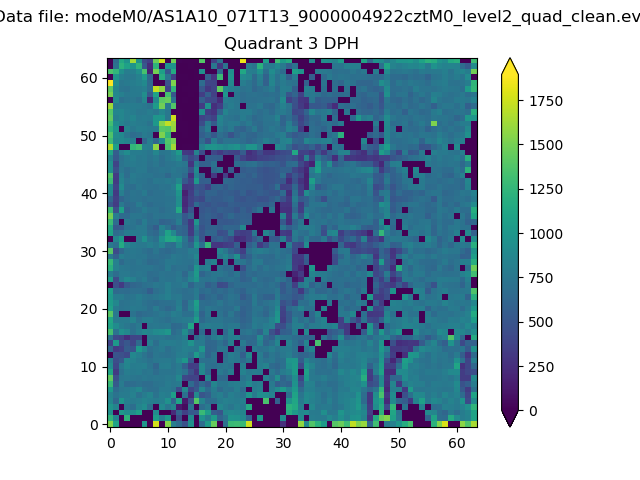 |
 |
Quadrant C |
| Plot type | Count rate plots | Images |
|---|---|---|
| Comparison with Poisson distribution Blue bars denote a histogram of data divided into 1 sec bins. Red curve is a Poisson curve with rate = median count rate of data. |
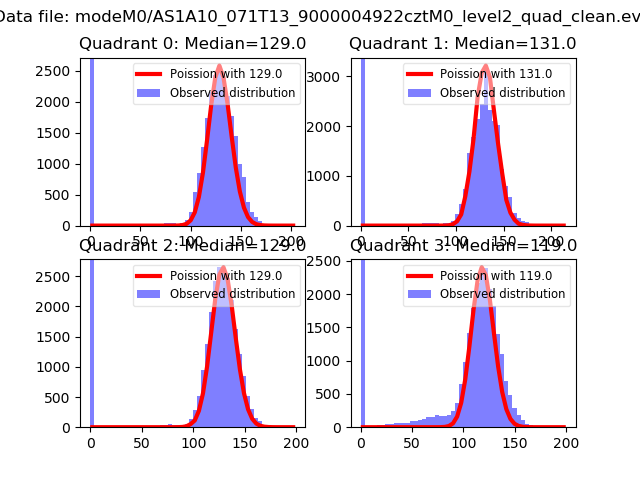 |
 |
| Quadrant-wise count rates Data is divided into 100 sec bins |
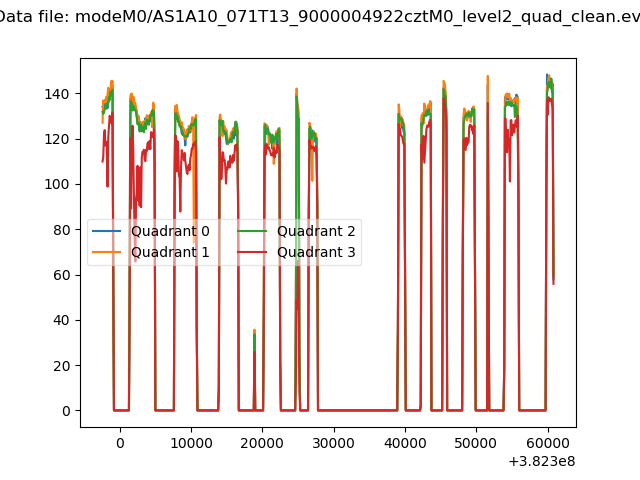 |
|
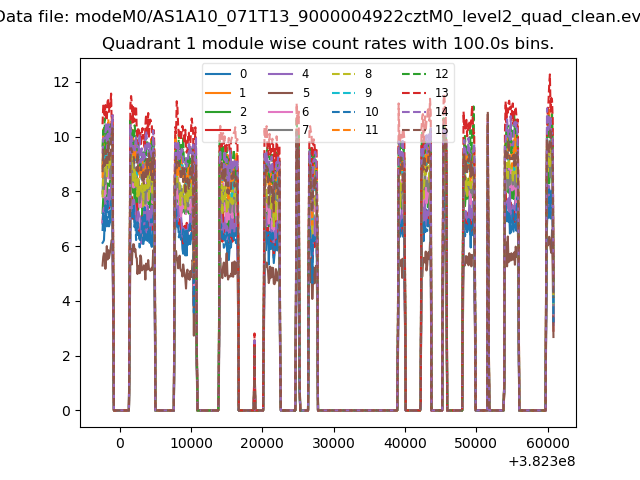
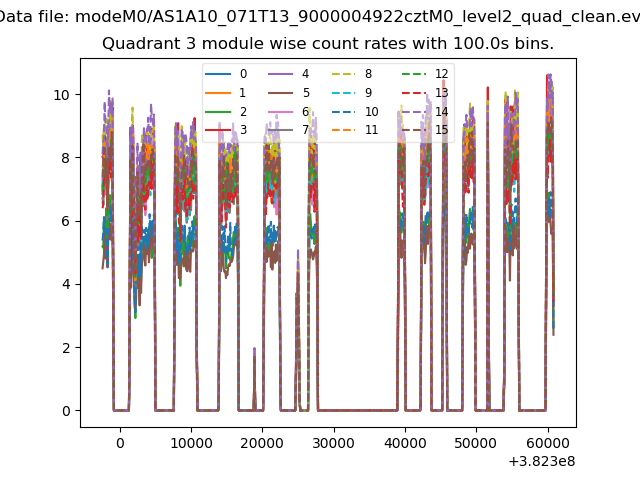
| Module-wise count rates for Quadrant A Data is divided into 100 sec bins |
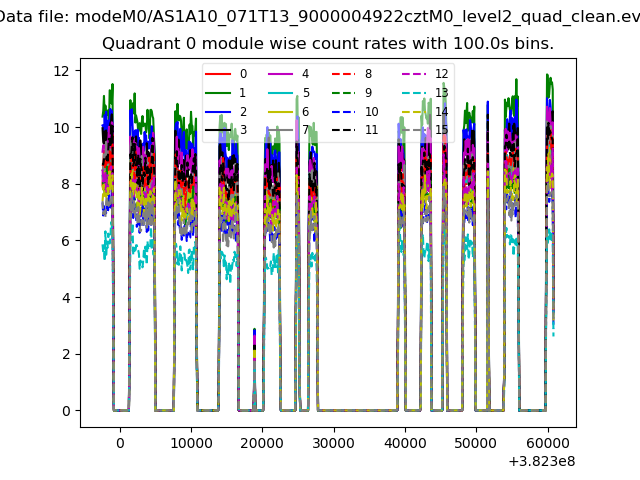 |
 |
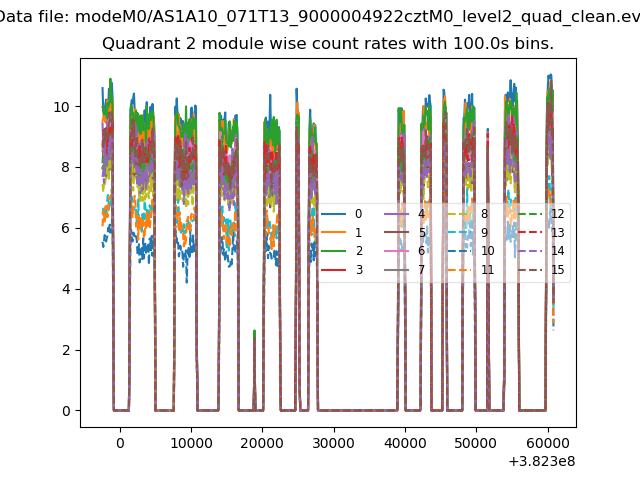
| Module-wise count rates for Quadrant B Data is divided into 100 sec bins |
 |
 |
| Module-wise count rates for Quadrant C Data is divided into 100 sec bins |
 |
 |
| Module-wise count rates for Quadrant D Data is divided into 100 sec bins |
 |
 |
| Parameter | Plot |
|---|---|
| CZT HV Monitor | 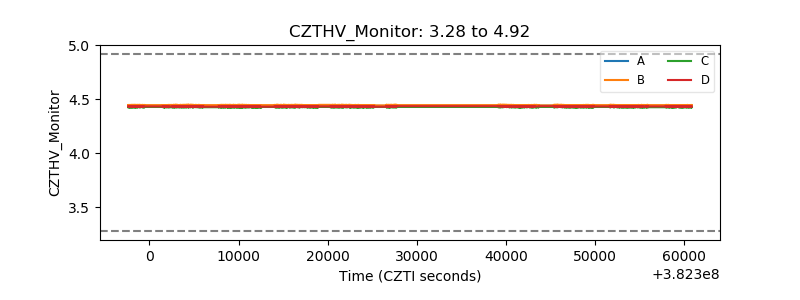 |
| D_VDD | 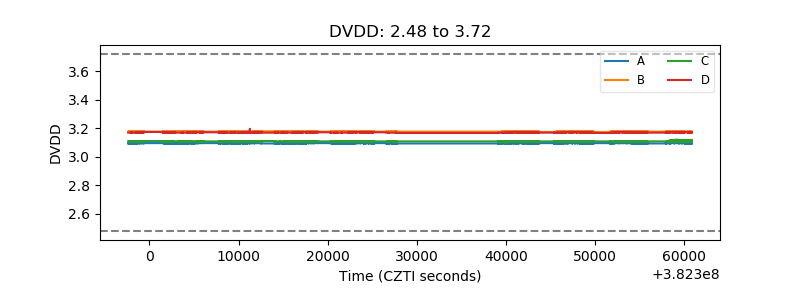 |
| Temperature 1 | 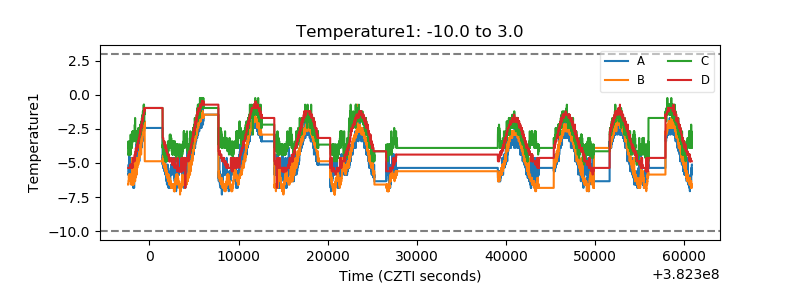 |
| Veto HV Monitor | 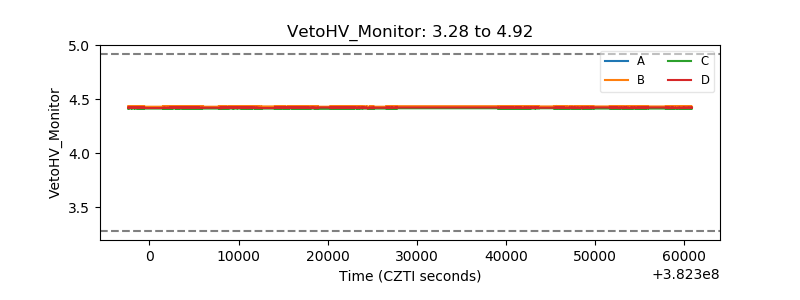 |
| Veto LLD | 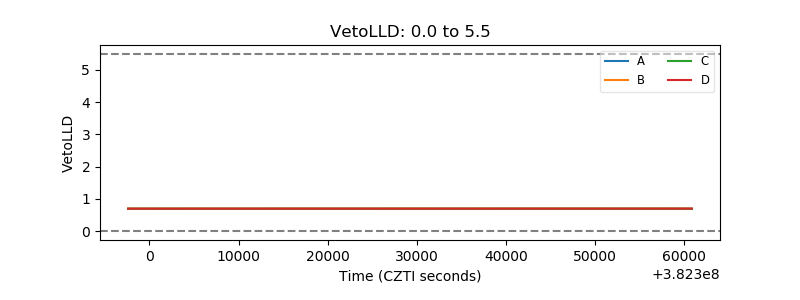 |
| Alpha Counter | 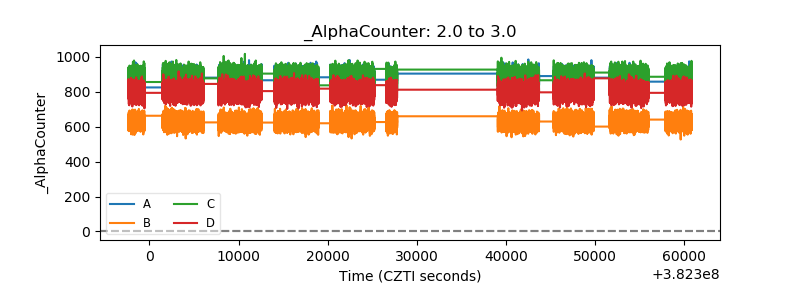 |
| _CPM_Rate | 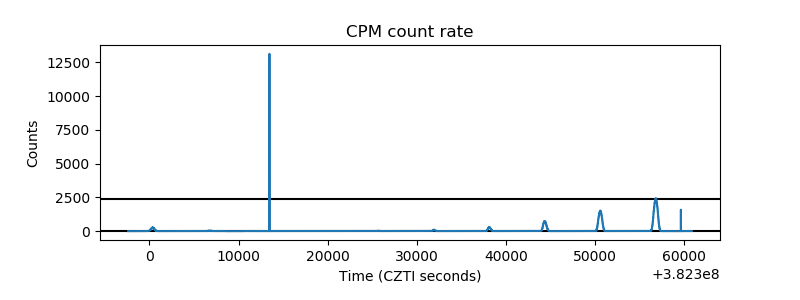 |
| CZT Counter | 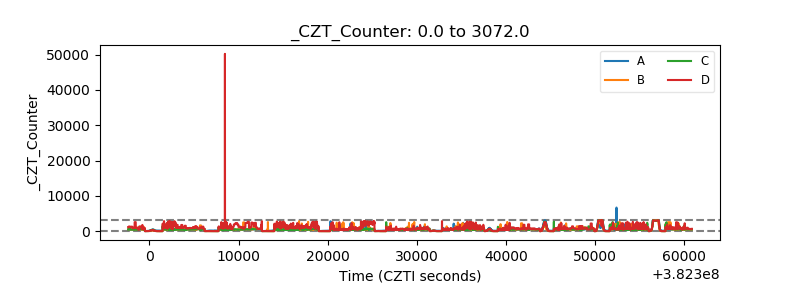 |
| +2.5 Volts monitor | 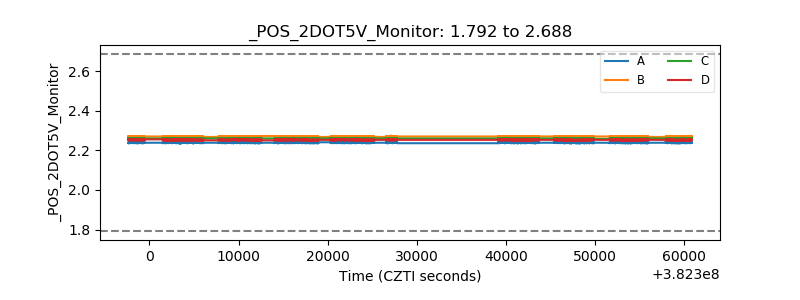 |
| +5 Volts monitor | 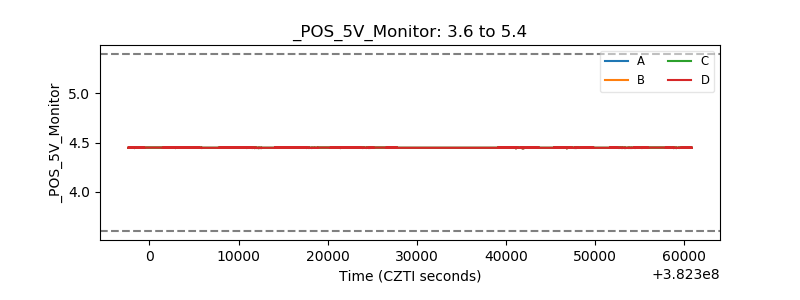 |
| _ROLL_ROT | 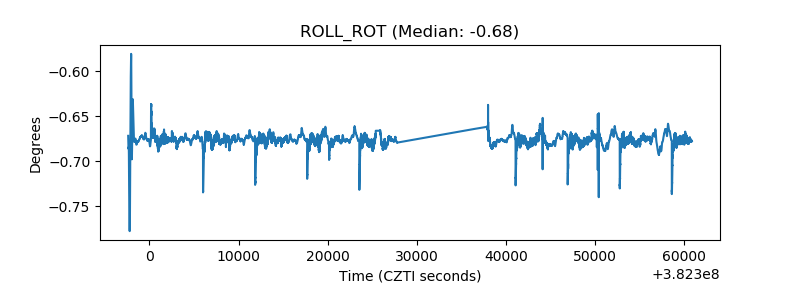 |
| _Roll_DEC | 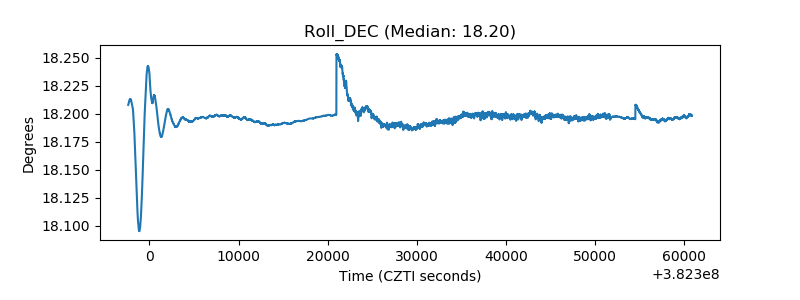 |
| _Roll_RA | 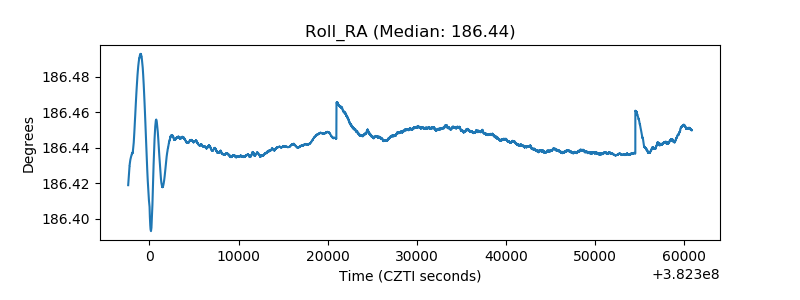 |
| Veto Counter | 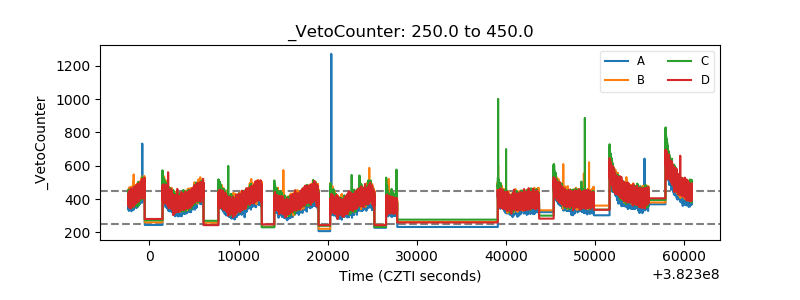 |