| Param | Original file | Final file |
|---|---|---|
| Filename | modeM0/AS1A10_058T06_9000004920_34465cztM0_level2.evt | modeM0/AS1A10_058T06_9000004920_34465cztM0_level2_quad_clean.evt |
| Size (bytes) | 487,434,240 | 54,947,520 |
| Size | 464.9 MB | 52.4 MB |
| Events in quadrant A | 2,938,735 | 330,740 |
| Events in quadrant B | 3,240,819 | 330,168 |
| Events in quadrant C | 3,638,996 | 324,122 |
| Events in quadrant D | 4,583,731 | 306,457 |
| Mode SS | |||
|---|---|---|---|
| Quadrant | BADHDUFLAG | Total packets | Discarded packets |
| A | 0 | 108 | 0 |
| B | 0 | 108 | 0 |
| C | 0 | 108 | 0 |
| D | 0 | 108 | 0 |
| Mode M0 | |||
|---|---|---|---|
| Quadrant | BADHDUFLAG | Total packets | Discarded packets |
| A | 0 | 11983 | 3 |
| B | 0 | 12859 | 2 |
| C | 0 | 14327 | 2 |
| D | 0 | 17444 | 2 |
| Mode M9 | |||
|---|---|---|---|
| Quadrant | BADHDUFLAG | Total packets | Discarded packets |
| A | 0 | 23 | 0 |
| B | 0 | 23 | 0 |
| C | 0 | 23 | 0 |
| D | 0 | 24 | 0 |
| Quadrant | Total seconds | Saturated seconds | Saturation percentage |
|---|---|---|---|
| A | 5313 | 43 | 0.809336% |
| B | 5313 | 78 | 1.468097% |
| C | 5313 | 185 | 3.482025% |
| D | 5313 | 125 | 2.352720% |
Noise dominated data is calculated using 1-second bins in cleaned event files. If a bin has >2000 counts, and if more than 50% of those come from <1% of pixels, then it is considered to be noise-dominated and hence unusable.
| Quadrant | # 1 sec bins | Bins with >0 counts | Bins with >2000 counts | High rate bins dominated by noise | Noise dominated (total time) | Noise dominated (detector-on time) | Marked lightcurve |
|---|---|---|---|---|---|---|---|
| A | 7377 | 5314 | 27 | 27 | 0.37% | 0.51% | 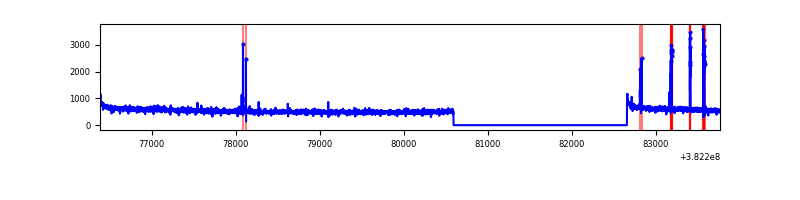 |
| B | 7377 | 5314 | 40 | 40 | 0.54% | 0.75% | 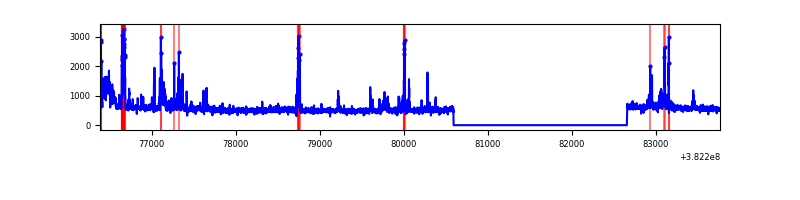 |
| C | 7376 | 5313 | 150 | 150 | 2.03% | 2.82% | 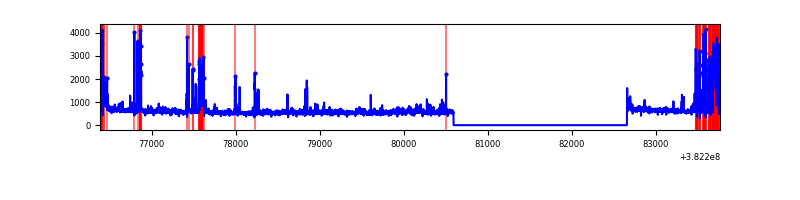 |
| D | 7377 | 5314 | 78 | 78 | 1.06% | 1.47% | 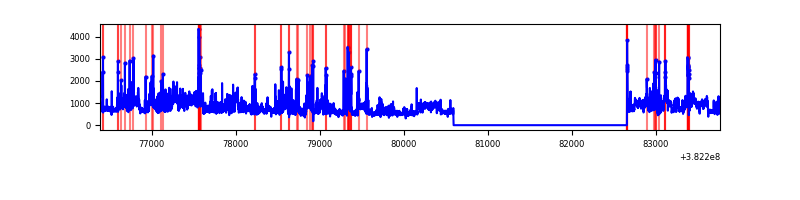 |
Top three noisy pixels from each quadrant. If the there are fewer than three noisy pixels in the level2.evt file, extra rows are filled as -1
| Pixel properties | Quadrant properties | ||||||
|---|---|---|---|---|---|---|---|
| Quadrant | DetID | PixID | Counts | Sigma | Mean | Median | Sigma |
| A | 15 | 169 | 48087 | 330.16 | 725 | 714 | 143.5 |
| A | 10 | 83 | 38140 | 260.84 | 725 | 714 | 143.5 |
| A | 9 | 191 | 25788 | 174.75 | 725 | 714 | 143.5 |
| B | 5 | 172 | 180057 | 1345.4 | 713 | 696 | 133.3 |
| B | 0 | 229 | 112413 | 838.0 | 713 | 696 | 133.3 |
| B | 4 | 232 | 100501 | 748.65 | 713 | 696 | 133.3 |
| C | 15 | 208 | 574891 | 3694.38 | 683 | 694 | 155.4 |
| C | 15 | 214 | 221495 | 1420.63 | 683 | 694 | 155.4 |
| C | 14 | 67 | 105025 | 671.27 | 683 | 694 | 155.4 |
| D | 8 | 195 | 1019920 | 6069.5 | 692 | 674 | 167.9 |
| D | 2 | 250 | 240317 | 1427.05 | 692 | 674 | 167.9 |
| D | 1 | 52 | 191059 | 1133.72 | 692 | 674 | 167.9 |
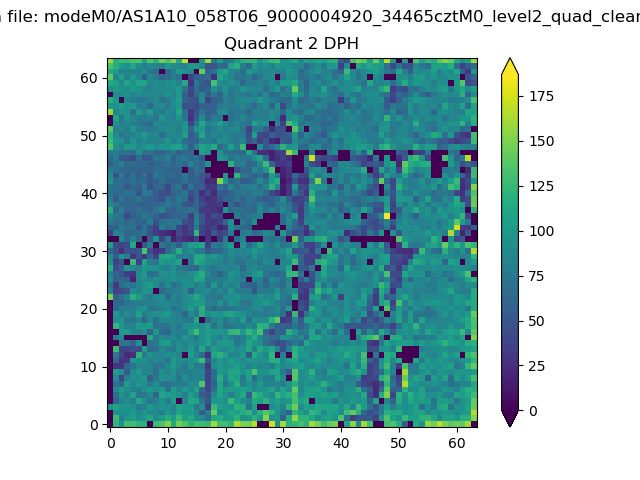
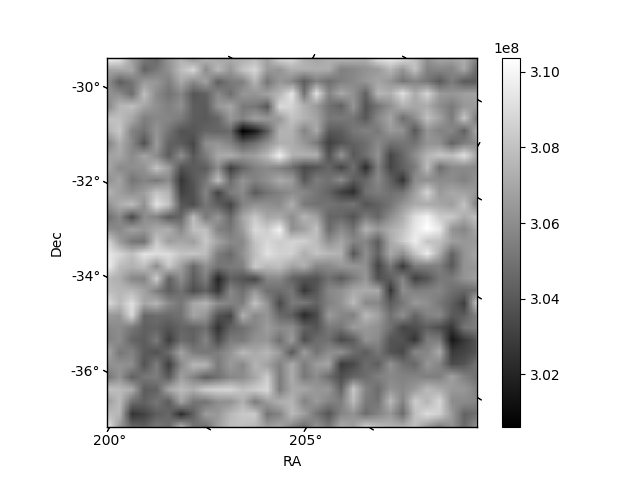
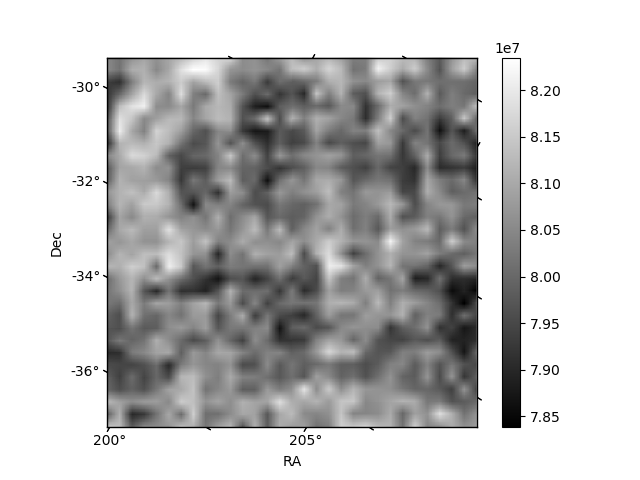
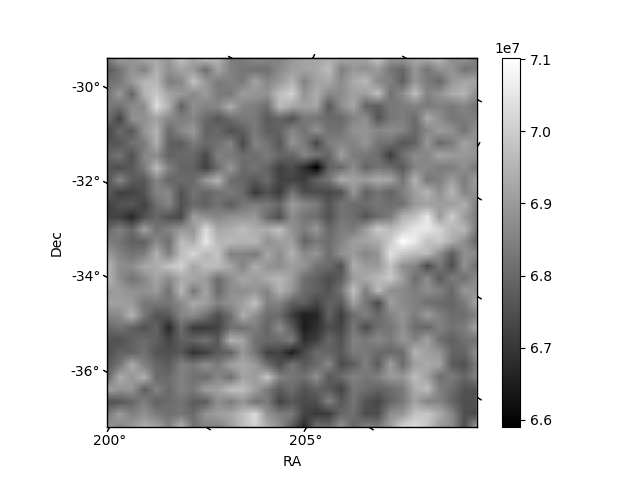
Histogram calculated using DETX and DETY for each event in the final _common_clean file
| Quadrant A | 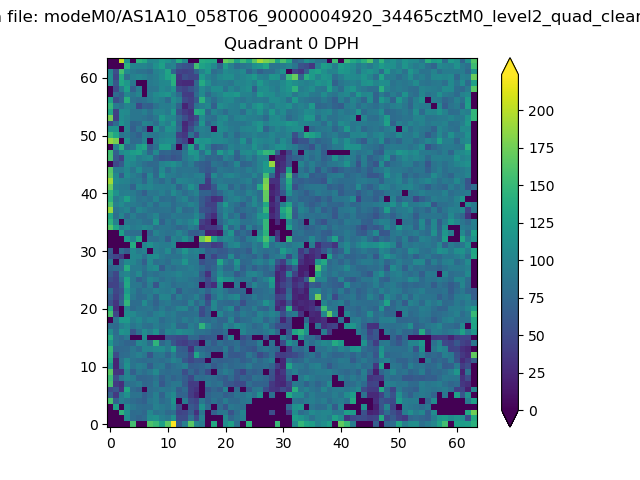 |
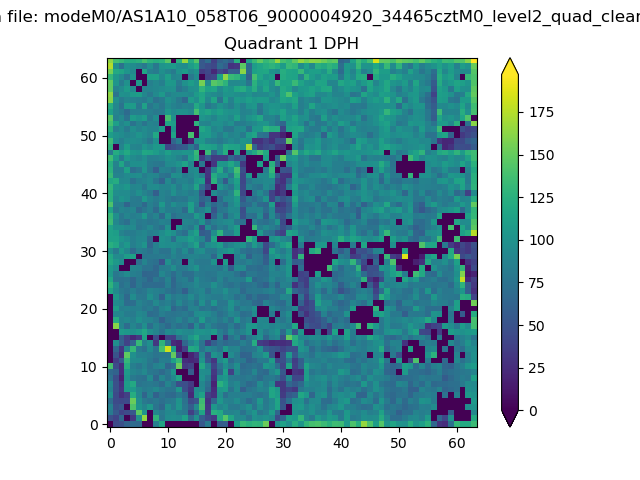 |
Quadrant B |
|---|---|---|---|
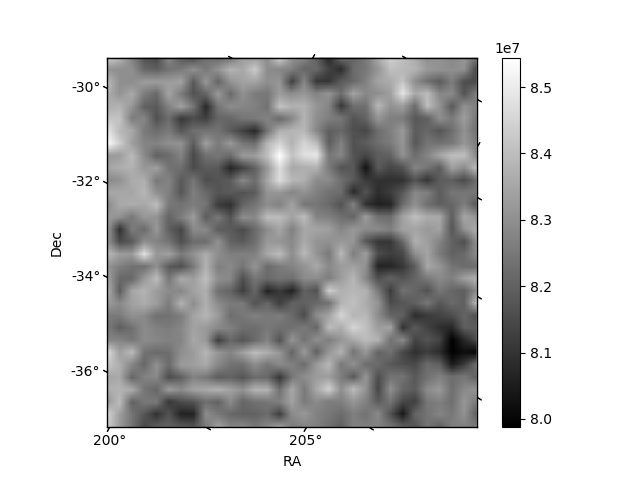
| Quadrant D | 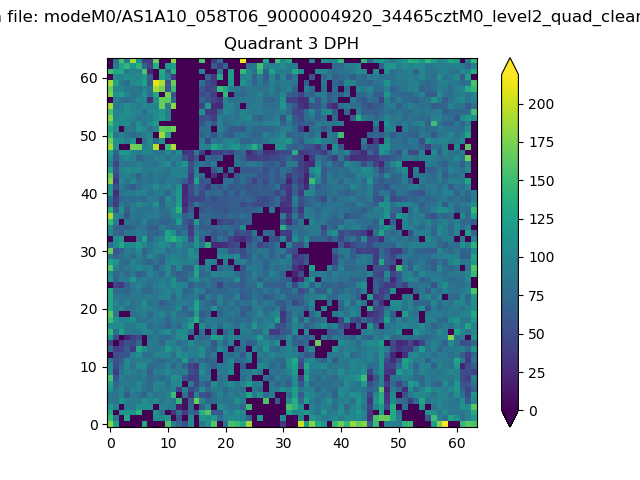 |
 |
Quadrant C |
| Plot type | Count rate plots | Images |
|---|---|---|
| Comparison with Poisson distribution Blue bars denote a histogram of data divided into 1 sec bins. Red curve is a Poisson curve with rate = median count rate of data. |
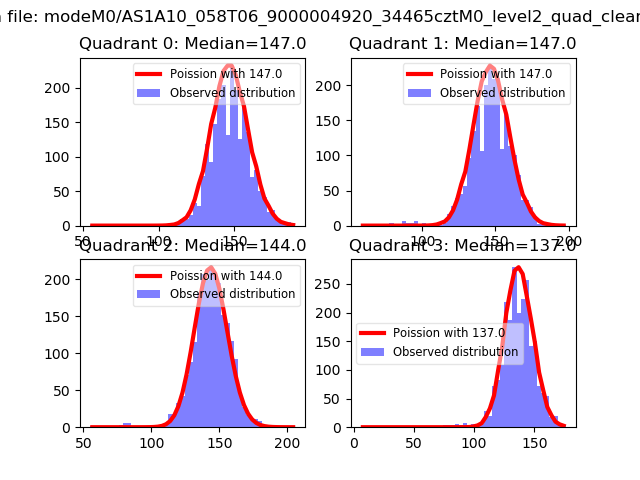 |
 |
| Quadrant-wise count rates Data is divided into 100 sec bins |
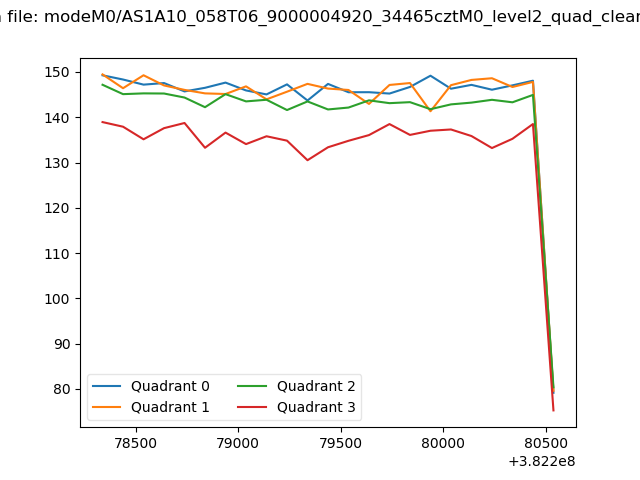 |
|
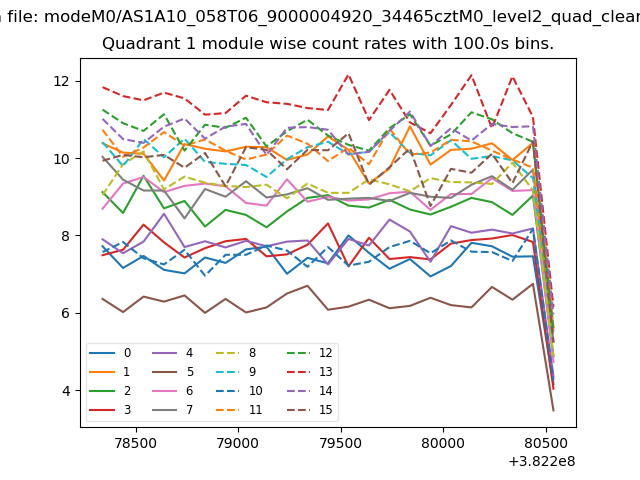
| Module-wise count rates for Quadrant A Data is divided into 100 sec bins |
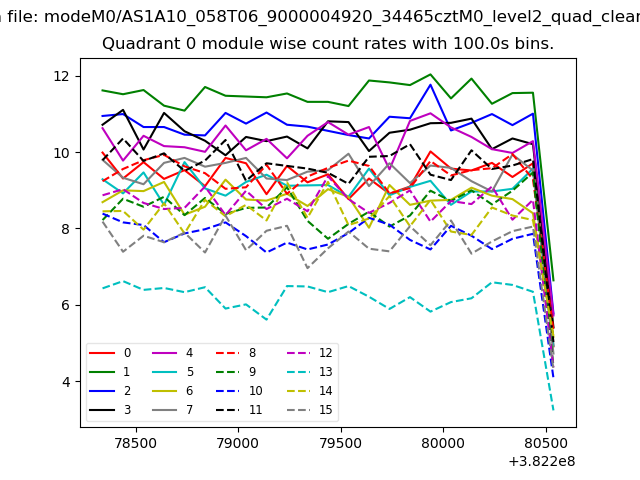 |
 |
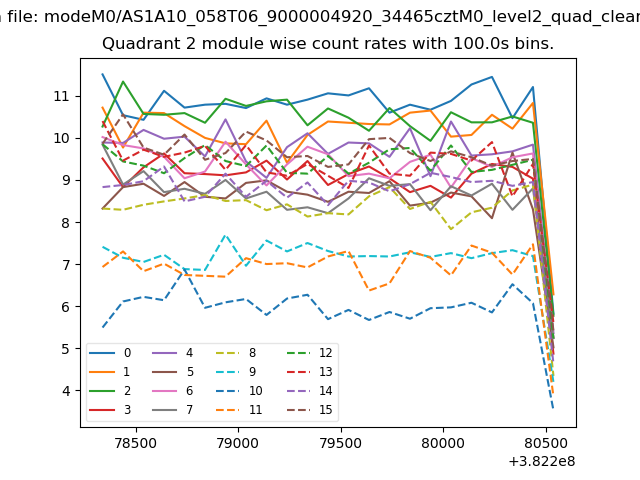
| Module-wise count rates for Quadrant B Data is divided into 100 sec bins |
 |
 |
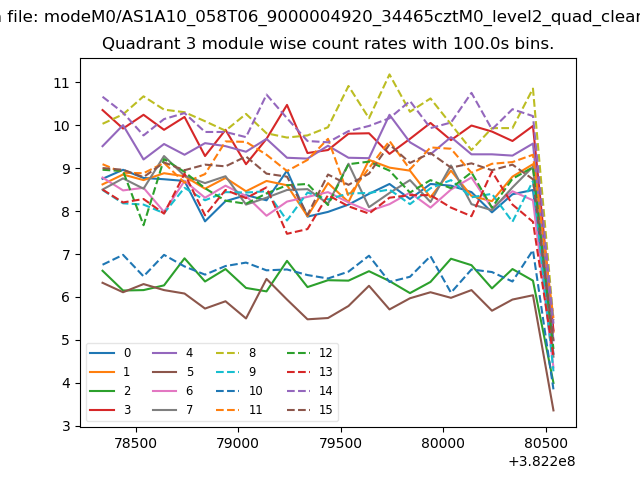
| Module-wise count rates for Quadrant C Data is divided into 100 sec bins |
 |
 |
| Module-wise count rates for Quadrant D Data is divided into 100 sec bins |
 |
 |
| Parameter | Plot |
|---|---|
| CZT HV Monitor | 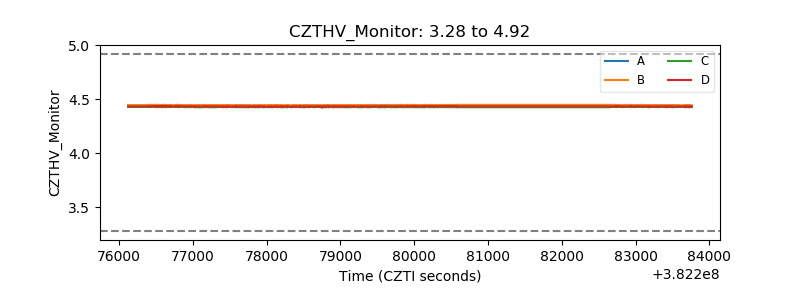 |
| D_VDD | 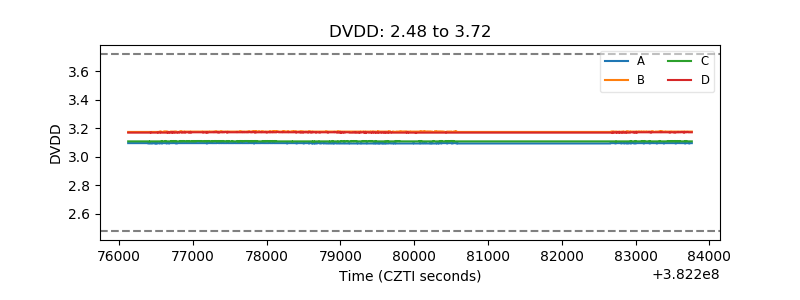 |
| Temperature 1 | 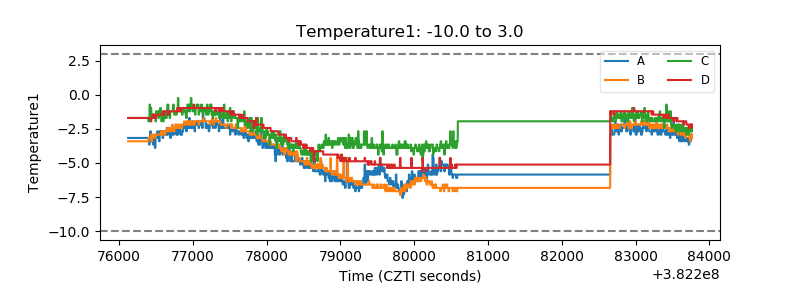 |
| Veto HV Monitor | 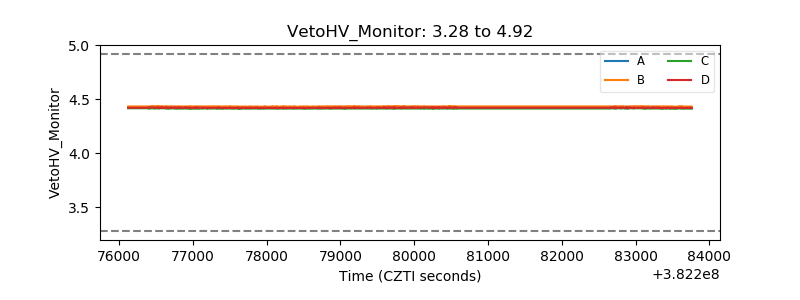 |
| Veto LLD | 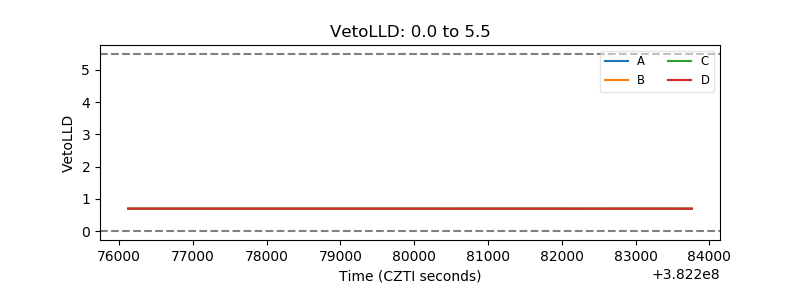 |
| Alpha Counter | 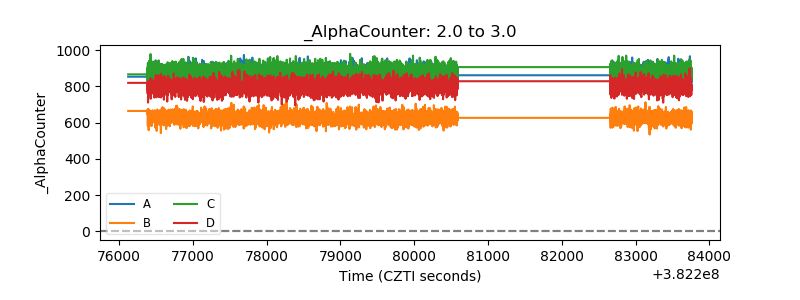 |
| _CPM_Rate | 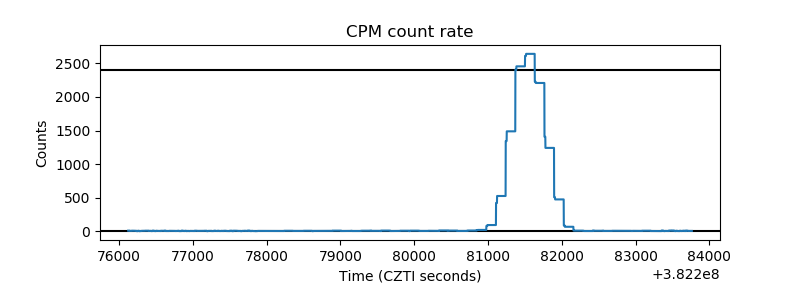 |
| CZT Counter | 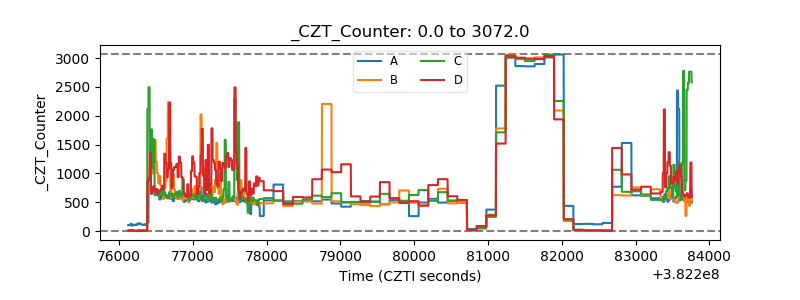 |
| +2.5 Volts monitor | 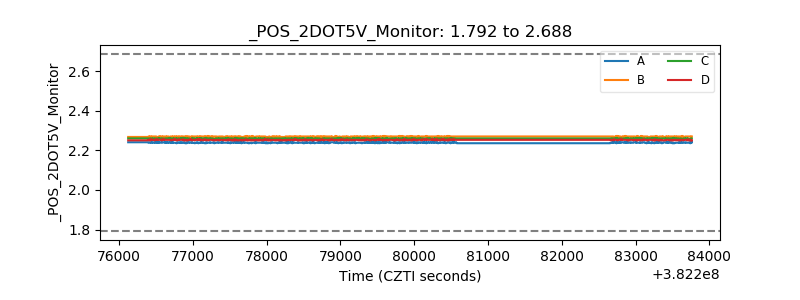 |
| +5 Volts monitor | 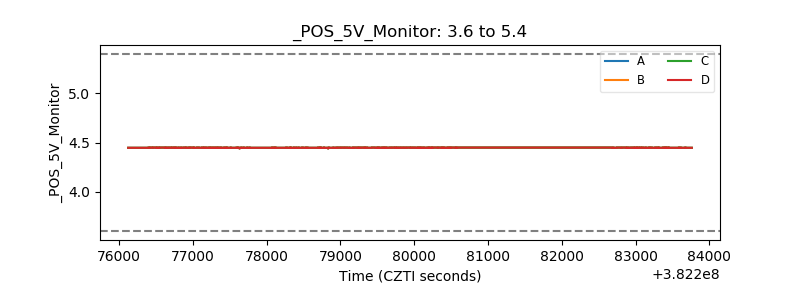 |
| _ROLL_ROT | 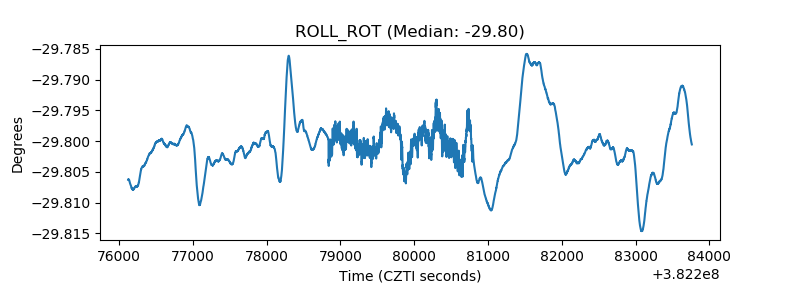 |
| _Roll_DEC | 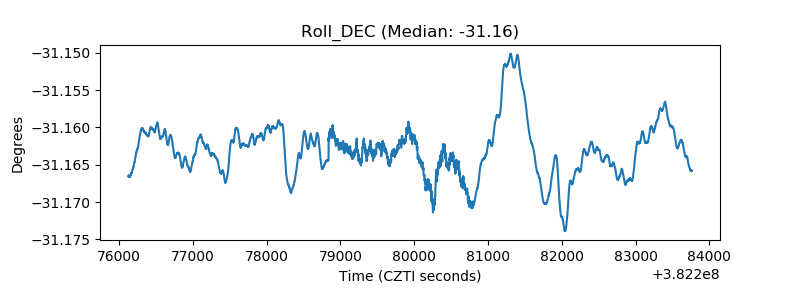 |
| _Roll_RA | 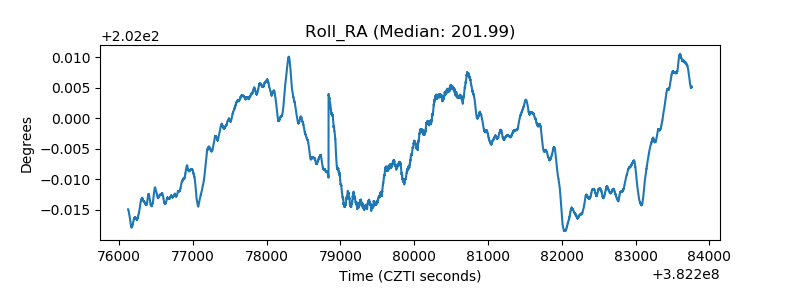 |
| Veto Counter | 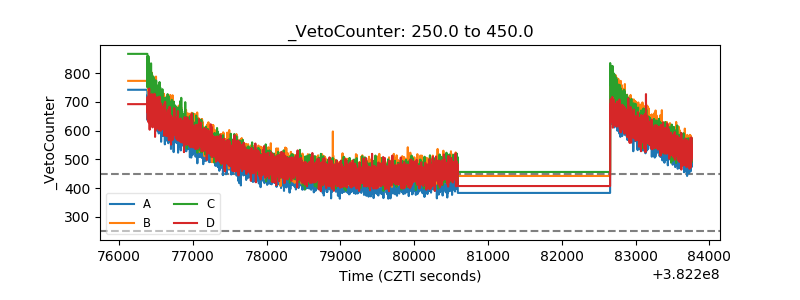 |