| Param | Original file | Final file |
|---|---|---|
| Filename | modeM0/AS1A10_058T05_9000004918_34437cztM0_level2.evt | modeM0/AS1A10_058T05_9000004918_34437cztM0_level2_quad_clean.evt |
| Size (bytes) | 551,154,240 | 65,744,640 |
| Size | 525.6 MB | 62.7 MB |
| Events in quadrant A | 2,681,421 | 439,006 |
| Events in quadrant B | 3,919,469 | 440,373 |
| Events in quadrant C | 2,859,599 | 423,754 |
| Events in quadrant D | 6,895,653 | 339,400 |
| Mode M9 | |||
|---|---|---|---|
| Quadrant | BADHDUFLAG | Total packets | Discarded packets |
| A | 0 | 21 | 0 |
| B | 0 | 21 | 0 |
| C | 0 | 21 | 0 |
| D | 0 | 21 | 0 |
| Mode M0 | |||
|---|---|---|---|
| Quadrant | BADHDUFLAG | Total packets | Discarded packets |
| A | 0 | 10954 | 2 |
| B | 0 | 14804 | 1 |
| C | 0 | 11465 | 1 |
| D | 0 | 23995 | 1 |
| Mode SS | |||
|---|---|---|---|
| Quadrant | BADHDUFLAG | Total packets | Discarded packets |
| A | 0 | 102 | 0 |
| B | 0 | 102 | 0 |
| C | 0 | 102 | 0 |
| D | 0 | 102 | 0 |
| Quadrant | Total seconds | Saturated seconds | Saturation percentage |
|---|---|---|---|
| A | 4955 | 33 | 0.665994% |
| B | 4955 | 527 | 10.635721% |
| C | 4955 | 31 | 0.625631% |
| D | 4955 | 1125 | 22.704339% |
Noise dominated data is calculated using 1-second bins in cleaned event files. If a bin has >2000 counts, and if more than 50% of those come from <1% of pixels, then it is considered to be noise-dominated and hence unusable.
| Quadrant | # 1 sec bins | Bins with >0 counts | Bins with >2000 counts | High rate bins dominated by noise | Noise dominated (total time) | Noise dominated (detector-on time) | Marked lightcurve |
|---|---|---|---|---|---|---|---|
| A | 7078 | 4956 | 25 | 25 | 0.35% | 0.50% | 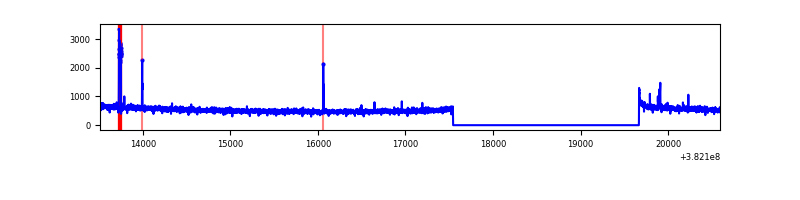 |
| B | 7078 | 4956 | 411 | 411 | 5.81% | 8.29% | 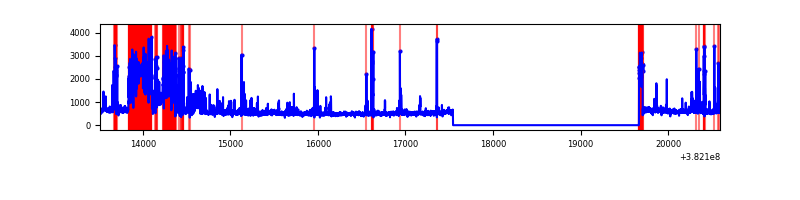 |
| C | 7078 | 4956 | 23 | 23 | 0.32% | 0.46% | 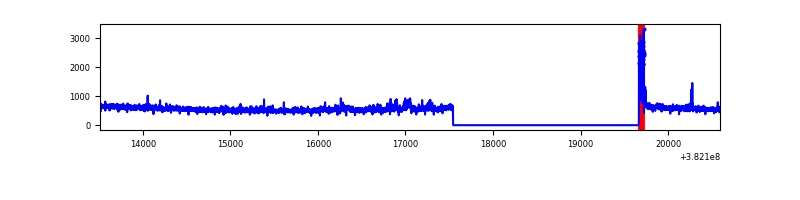 |
| D | 7078 | 4956 | 1042 | 1042 | 14.72% | 21.03% | 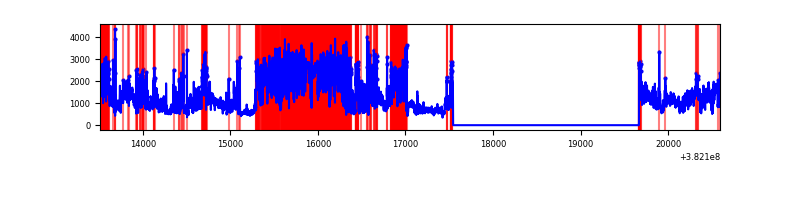 |
Top three noisy pixels from each quadrant. If the there are fewer than three noisy pixels in the level2.evt file, extra rows are filled as -1
| Pixel properties | Quadrant properties | ||||||
|---|---|---|---|---|---|---|---|
| Quadrant | DetID | PixID | Counts | Sigma | Mean | Median | Sigma |
| A | 9 | 143 | 81045 | 611.56 | 665 | 655 | 131.5 |
| A | 10 | 83 | 26481 | 196.47 | 665 | 655 | 131.5 |
| A | 13 | 254 | 8546 | 60.03 | 665 | 655 | 131.5 |
| B | 5 | 172 | 1232358 | 10524.06 | 625 | 613 | 117.0 |
| B | 4 | 171 | 139022 | 1182.57 | 625 | 613 | 117.0 |
| B | 15 | 85 | 33562 | 281.52 | 625 | 613 | 117.0 |
| C | 15 | 214 | 206644 | 1420.78 | 637 | 644 | 145.0 |
| C | 0 | 10 | 115542 | 792.45 | 637 | 644 | 145.0 |
| C | 14 | 67 | 42707 | 290.11 | 637 | 644 | 145.0 |
| D | 10 | 118 | 2043420 | 14365.04 | 585 | 570 | 142.2 |
| D | 7 | 223 | 1171943 | 8236.93 | 585 | 570 | 142.2 |
| D | 8 | 195 | 1094235 | 7690.5 | 585 | 570 | 142.2 |
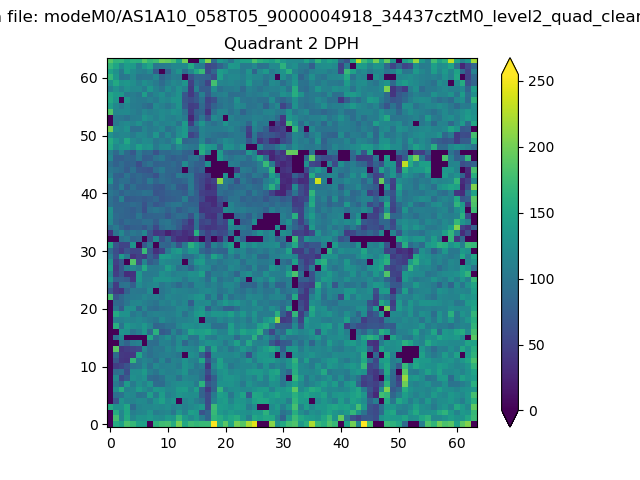
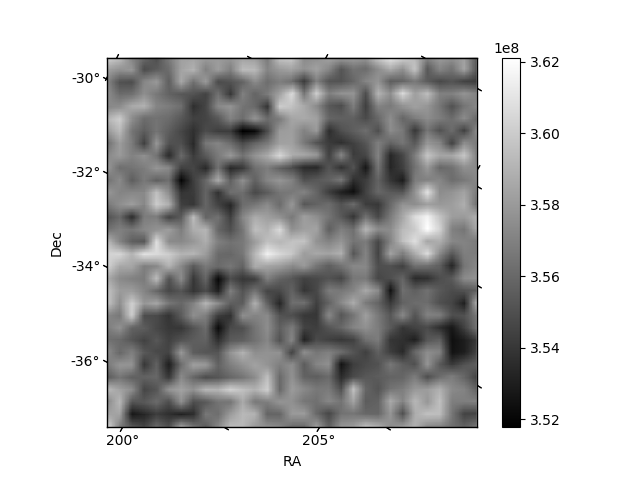
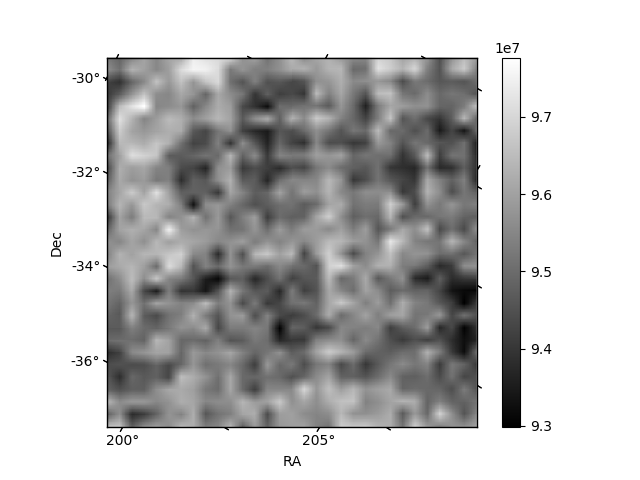
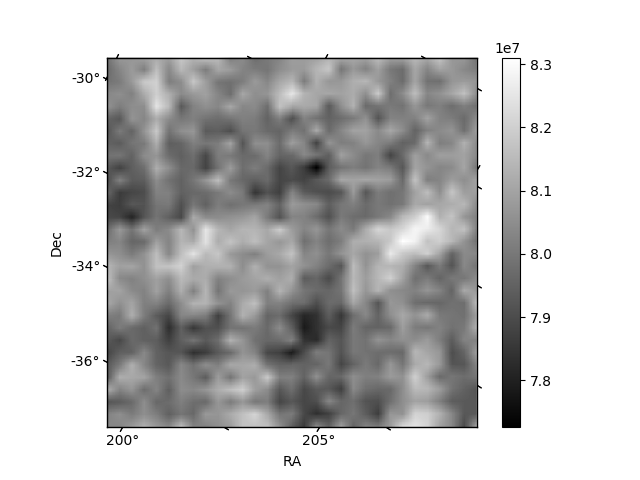
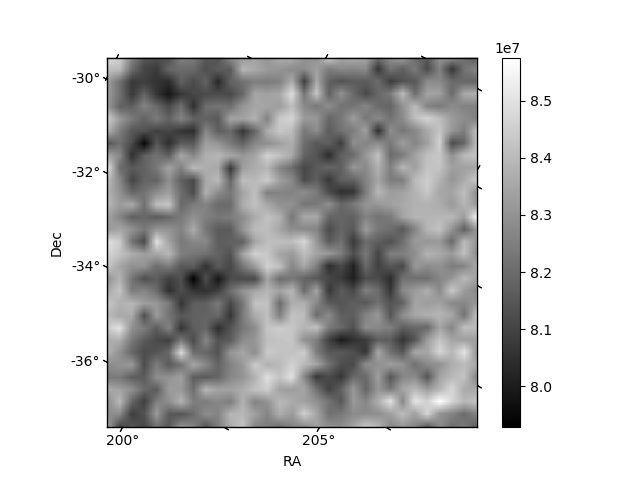
Histogram calculated using DETX and DETY for each event in the final _common_clean file
| Quadrant A | 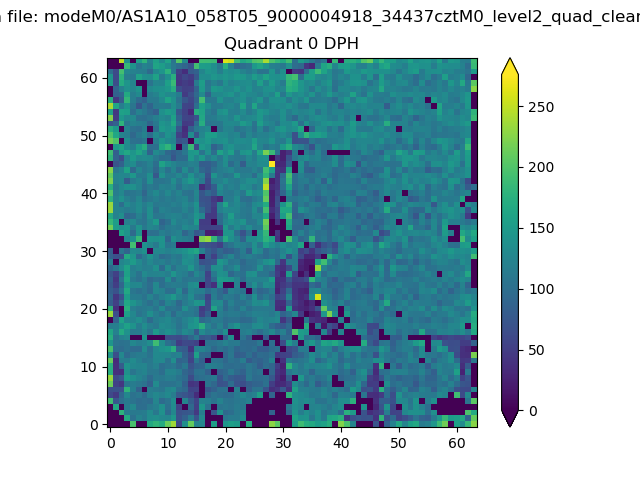 |
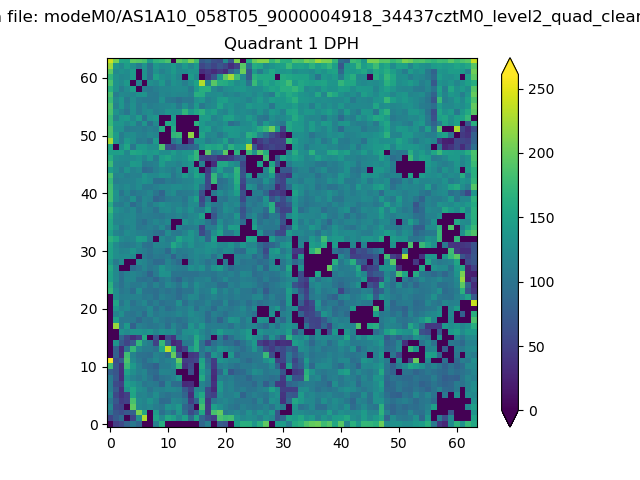 |
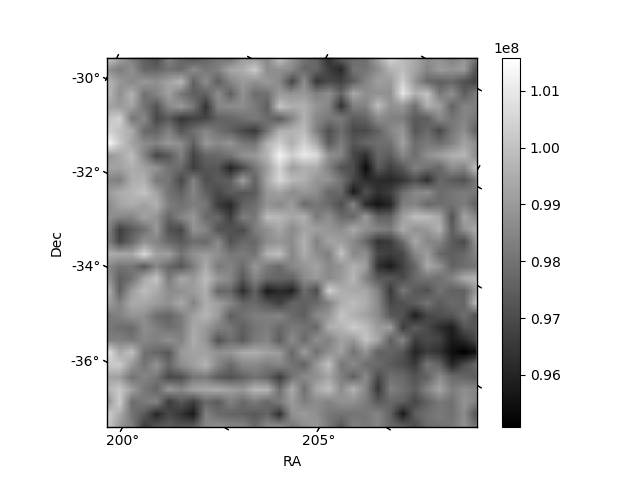
Quadrant B |
|---|---|---|---|
| Quadrant D | 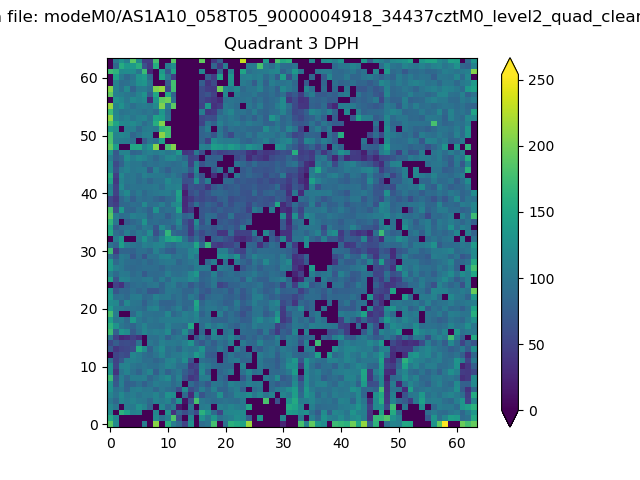 |
 |
Quadrant C |
| Plot type | Count rate plots | Images |
|---|---|---|
| Comparison with Poisson distribution Blue bars denote a histogram of data divided into 1 sec bins. Red curve is a Poisson curve with rate = median count rate of data. |
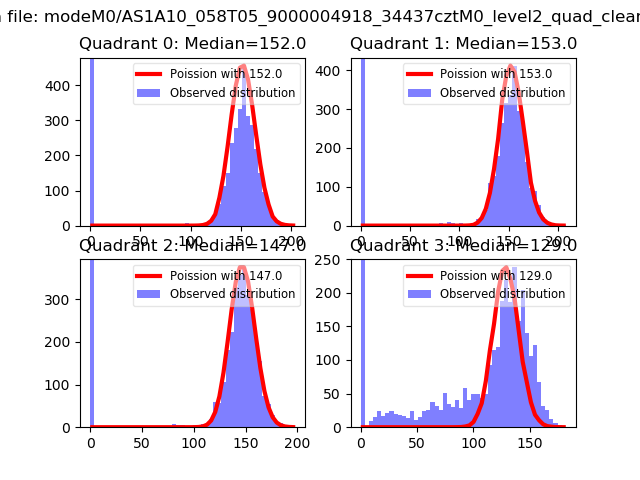 |
 |
| Quadrant-wise count rates Data is divided into 100 sec bins |
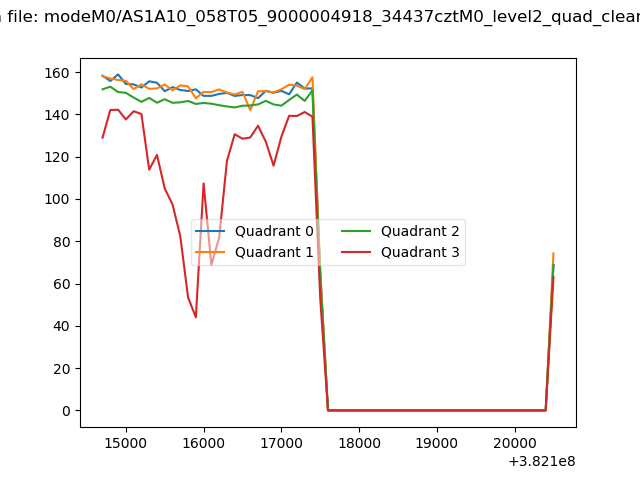 |
|
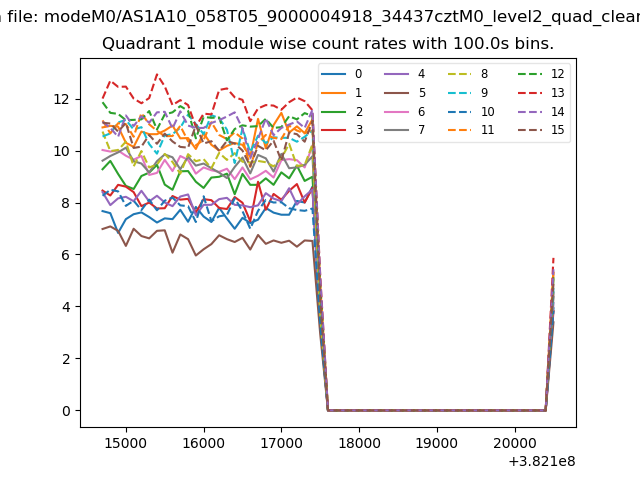
| Module-wise count rates for Quadrant A Data is divided into 100 sec bins |
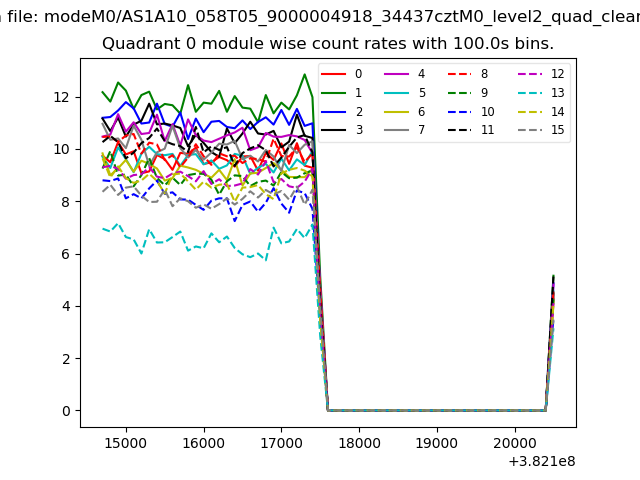 |
 |
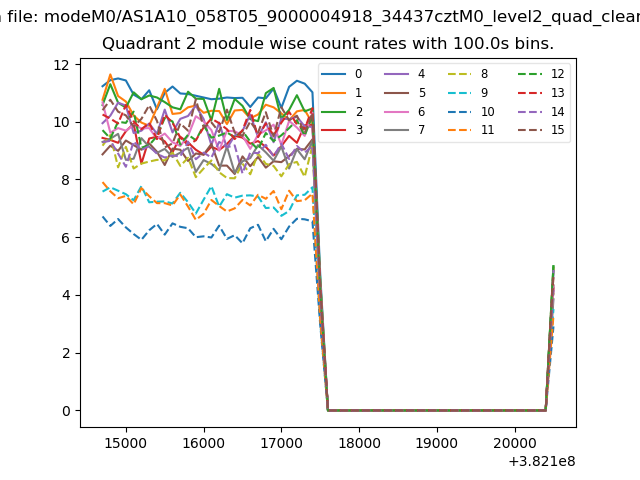
| Module-wise count rates for Quadrant B Data is divided into 100 sec bins |
 |
 |
| Module-wise count rates for Quadrant C Data is divided into 100 sec bins |
 |
 |
| Module-wise count rates for Quadrant D Data is divided into 100 sec bins |
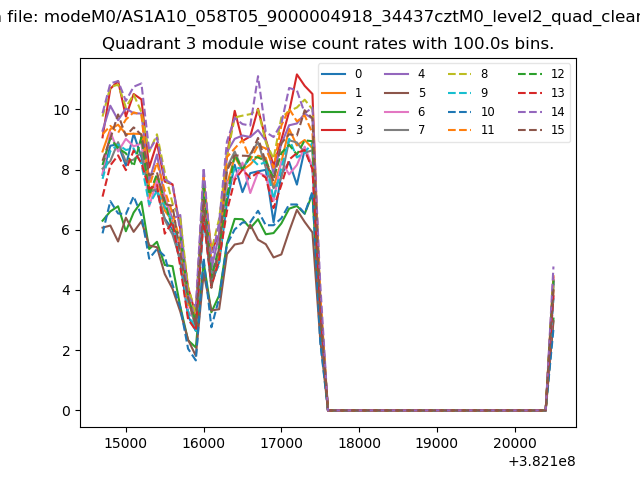 |
 |
| Parameter | Plot |
|---|---|
| CZT HV Monitor | 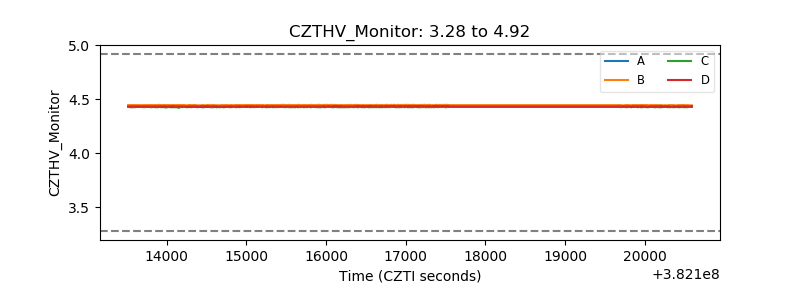 |
| D_VDD | 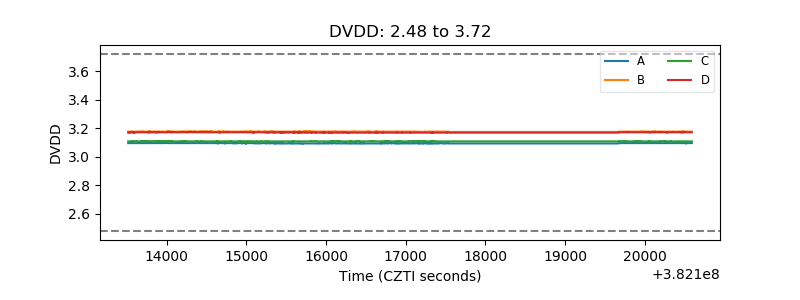 |
| Temperature 1 | 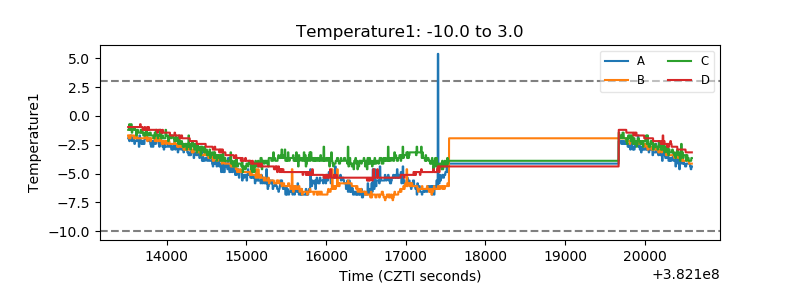 |
| Veto HV Monitor |  |
| Veto LLD | 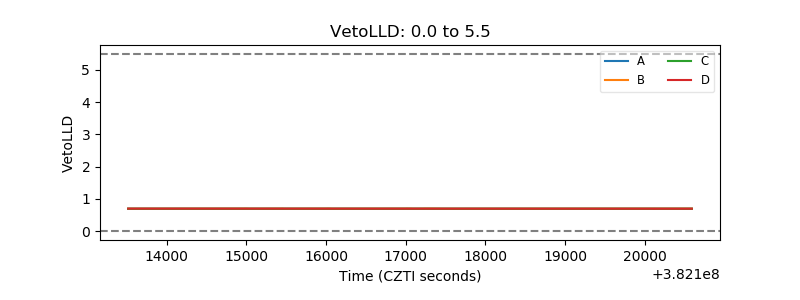 |
| Alpha Counter | 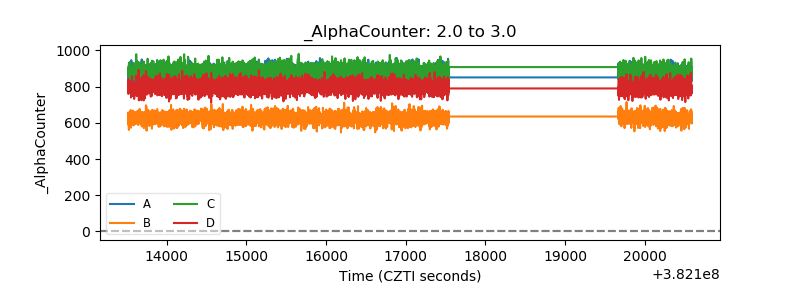 |
| _CPM_Rate | 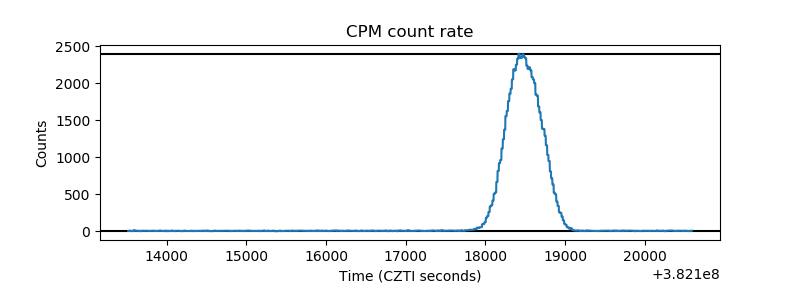 |
| CZT Counter | 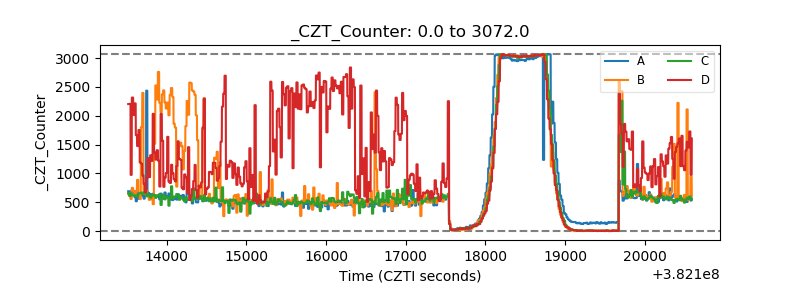 |
| +2.5 Volts monitor | 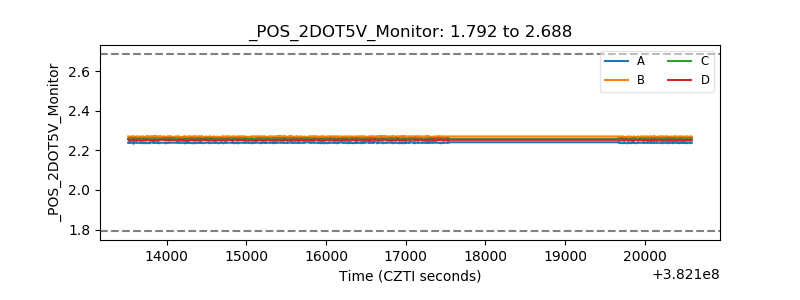 |
| +5 Volts monitor | 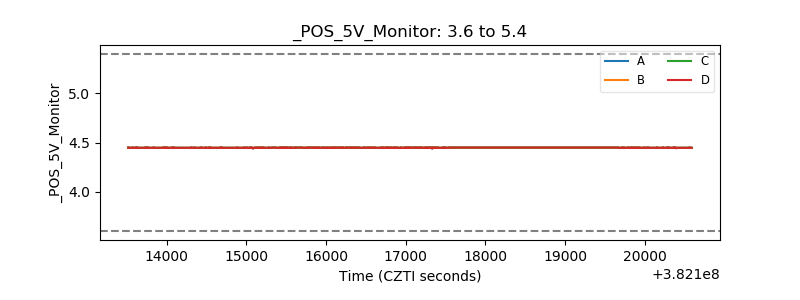 |
| _ROLL_ROT | 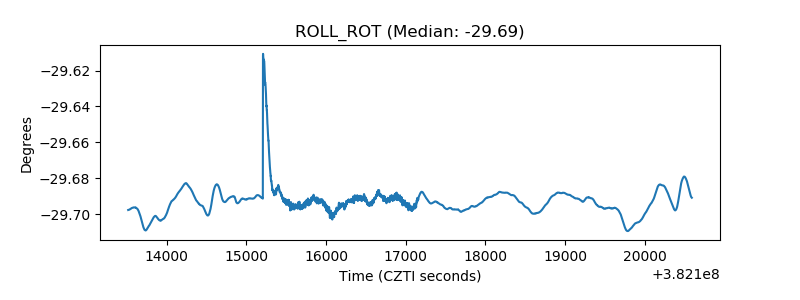 |
| _Roll_DEC | 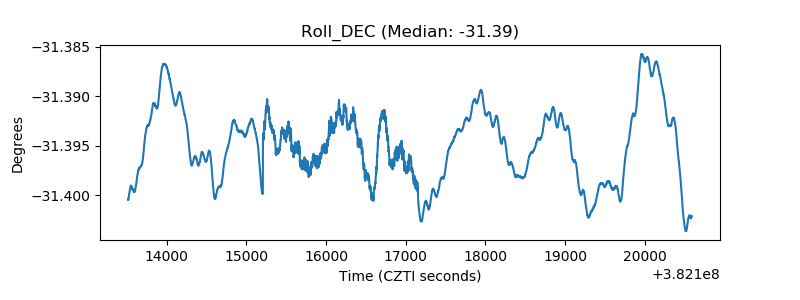 |
| _Roll_RA | 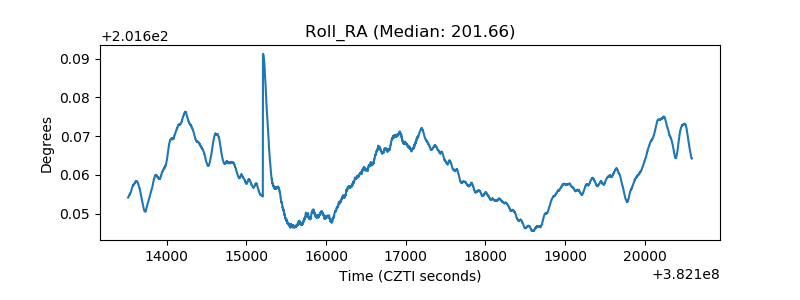 |
| Veto Counter | 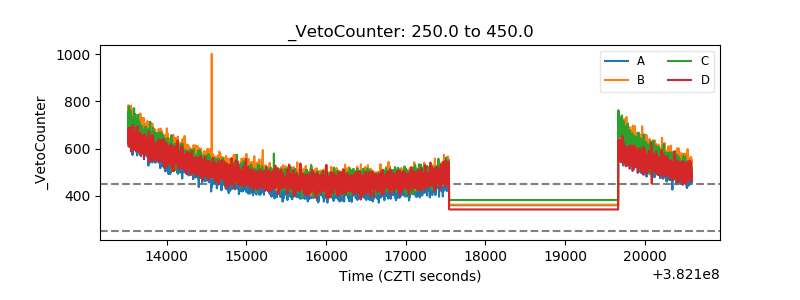 |