| Param | Original file | Final file |
|---|---|---|
| Filename | modeM0/AS1A10_058T05_9000004918_34436cztM0_level2.evt | modeM0/AS1A10_058T05_9000004918_34436cztM0_level2_quad_clean.evt |
| Size (bytes) | 633,389,760 | 57,326,400 |
| Size | 604.0 MB | 54.7 MB |
| Events in quadrant A | 2,883,901 | 367,724 |
| Events in quadrant B | 4,569,204 | 364,073 |
| Events in quadrant C | 3,095,223 | 357,637 |
| Events in quadrant D | 8,280,212 | 279,353 |
| Mode M9 | |||
|---|---|---|---|
| Quadrant | BADHDUFLAG | Total packets | Discarded packets |
| A | 0 | 29 | 0 |
| B | 0 | 29 | 0 |
| C | 0 | 29 | 0 |
| D | 0 | 30 | 0 |
| Mode M0 | |||
|---|---|---|---|
| Quadrant | BADHDUFLAG | Total packets | Discarded packets |
| A | 0 | 11823 | 3 |
| B | 0 | 17188 | 2 |
| C | 0 | 12388 | 2 |
| D | 0 | 28289 | 2 |
| Mode SS | |||
|---|---|---|---|
| Quadrant | BADHDUFLAG | Total packets | Discarded packets |
| A | 0 | 106 | 0 |
| B | 0 | 106 | 0 |
| C | 0 | 106 | 0 |
| D | 0 | 106 | 0 |
| Quadrant | Total seconds | Saturated seconds | Saturation percentage |
|---|---|---|---|
| A | 5232 | 38 | 0.726300% |
| B | 5232 | 613 | 11.716361% |
| C | 5232 | 57 | 1.089450% |
| D | 5232 | 1982 | 37.882263% |
Noise dominated data is calculated using 1-second bins in cleaned event files. If a bin has >2000 counts, and if more than 50% of those come from <1% of pixels, then it is considered to be noise-dominated and hence unusable.
| Quadrant | # 1 sec bins | Bins with >0 counts | Bins with >2000 counts | High rate bins dominated by noise | Noise dominated (total time) | Noise dominated (detector-on time) | Marked lightcurve |
|---|---|---|---|---|---|---|---|
| A | 7296 | 5233 | 24 | 24 | 0.33% | 0.46% | 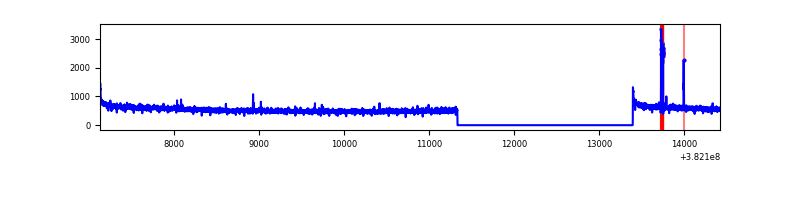 |
| B | 7296 | 5233 | 457 | 457 | 6.26% | 8.73% | 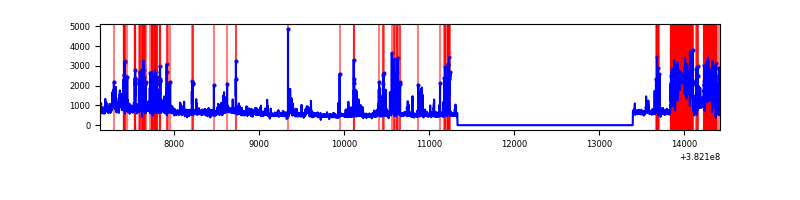 |
| C | 7296 | 5233 | 34 | 34 | 0.47% | 0.65% |  |
| D | 7296 | 5233 | 1682 | 1682 | 23.05% | 32.14% | 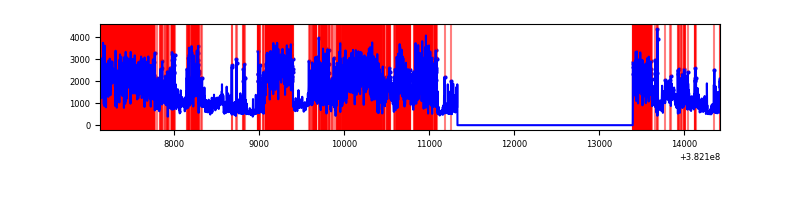 |
Top three noisy pixels from each quadrant. If the there are fewer than three noisy pixels in the level2.evt file, extra rows are filled as -1
| Pixel properties | Quadrant properties | ||||||
|---|---|---|---|---|---|---|---|
| Quadrant | DetID | PixID | Counts | Sigma | Mean | Median | Sigma |
| A | 9 | 143 | 67483 | 469.7 | 716 | 704 | 142.2 |
| A | 10 | 83 | 38254 | 264.11 | 716 | 704 | 142.2 |
| A | 13 | 6 | 13517 | 90.12 | 716 | 704 | 142.2 |
| B | 5 | 172 | 1459790 | 11840.86 | 668 | 654 | 123.2 |
| B | 0 | 190 | 339081 | 2746.33 | 668 | 654 | 123.2 |
| B | 3 | 112 | 59181 | 474.95 | 668 | 654 | 123.2 |
| C | 15 | 214 | 220349 | 1414.74 | 681 | 688 | 155.3 |
| C | 0 | 10 | 149108 | 955.91 | 681 | 688 | 155.3 |
| C | 14 | 67 | 37870 | 239.47 | 681 | 688 | 155.3 |
| D | 10 | 118 | 3380194 | 23670.08 | 584 | 567 | 142.8 |
| D | 7 | 223 | 1171623 | 8201.79 | 584 | 567 | 142.8 |
| D | 8 | 195 | 927316 | 6490.72 | 584 | 567 | 142.8 |
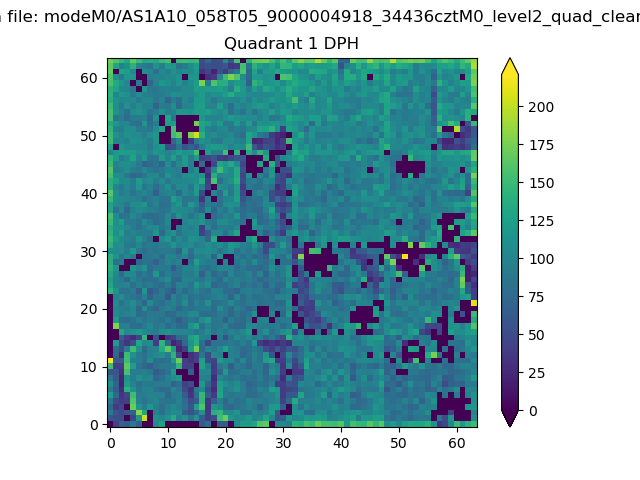
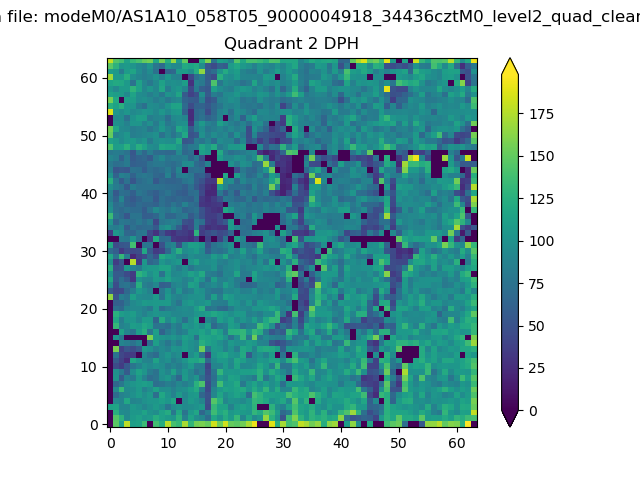
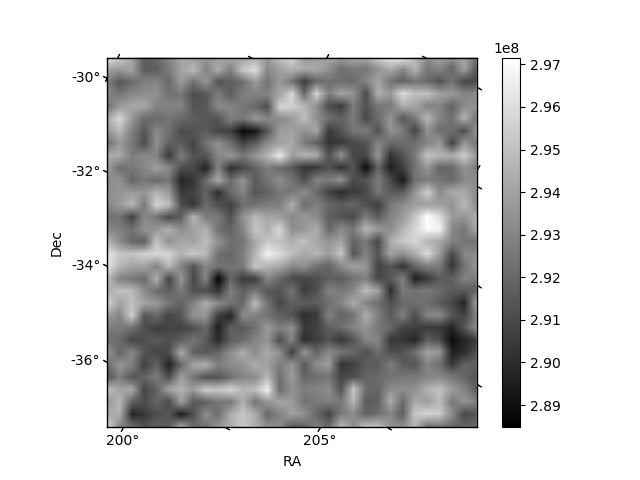
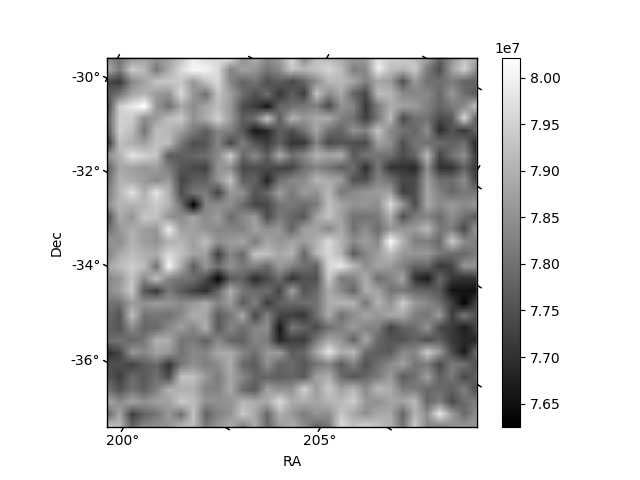
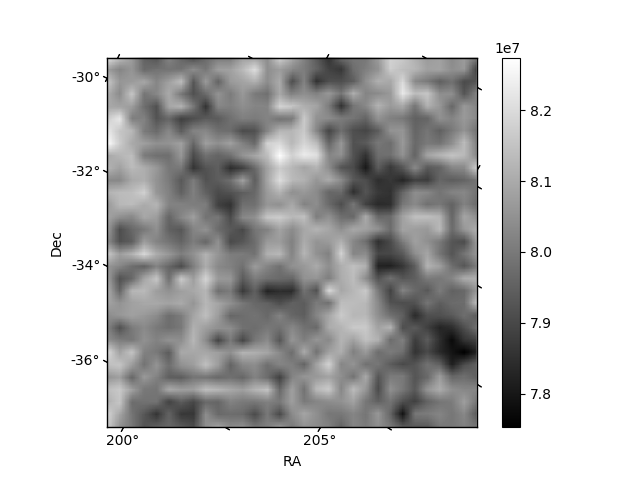
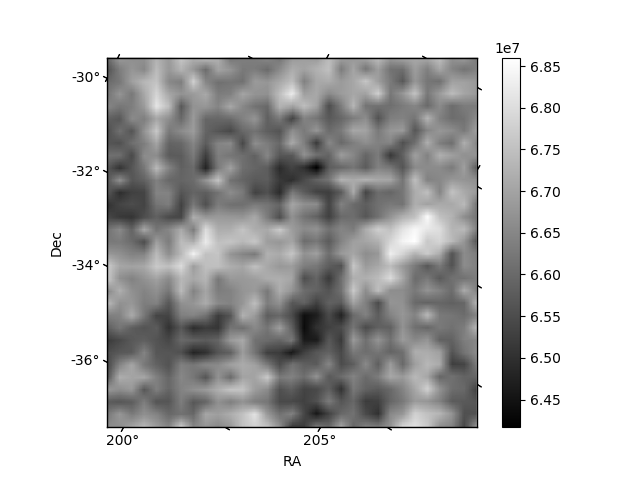
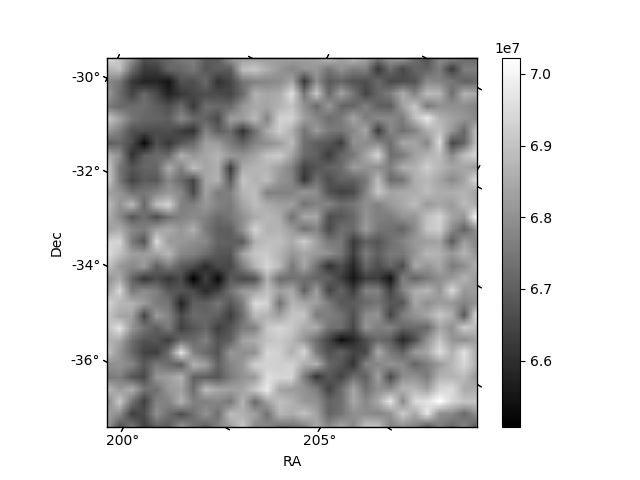
Histogram calculated using DETX and DETY for each event in the final _common_clean file
| Quadrant A | 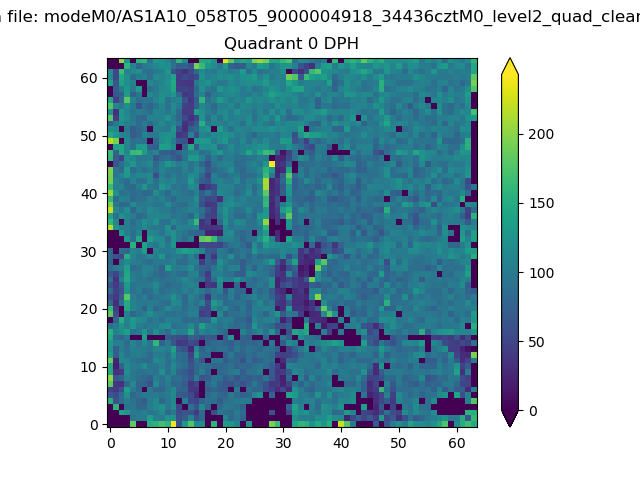 |
 |
Quadrant B |
|---|---|---|---|
| Quadrant D | 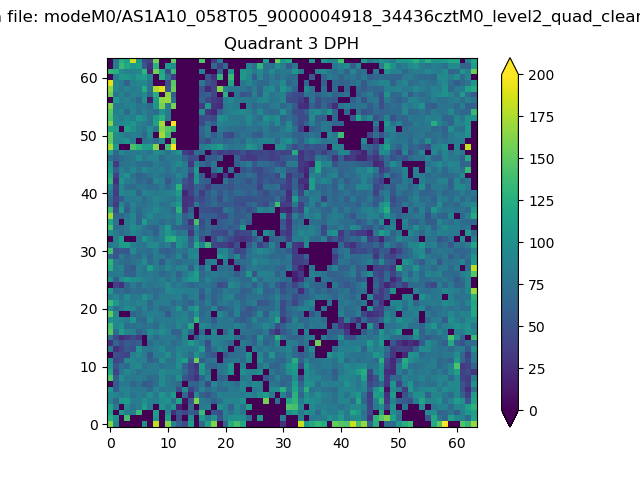 |
 |
Quadrant C |
| Plot type | Count rate plots | Images |
|---|---|---|
| Comparison with Poisson distribution Blue bars denote a histogram of data divided into 1 sec bins. Red curve is a Poisson curve with rate = median count rate of data. |
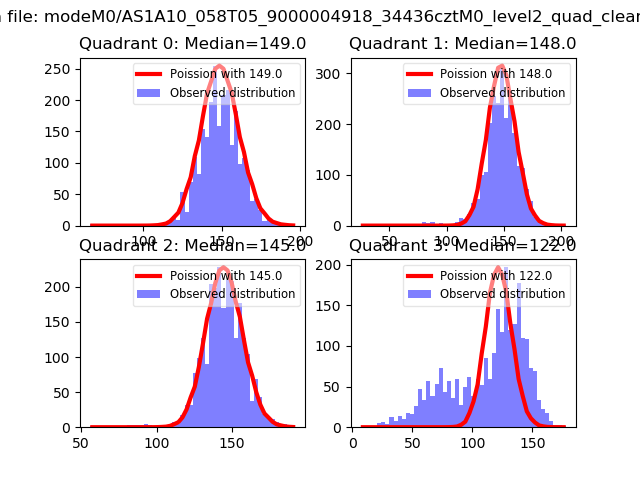 |
 |
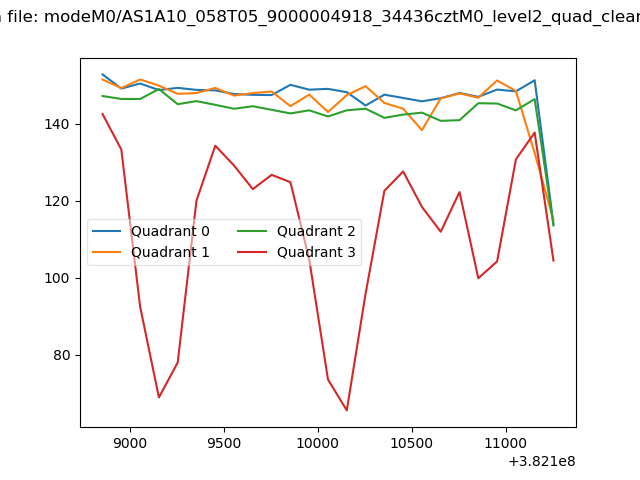
| Quadrant-wise count rates Data is divided into 100 sec bins |
 |
|
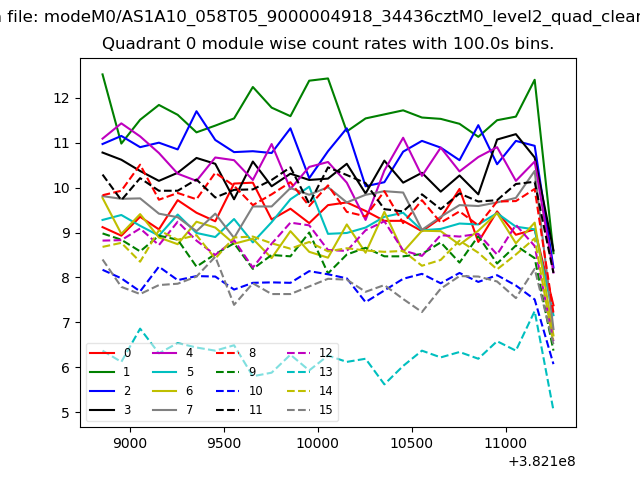
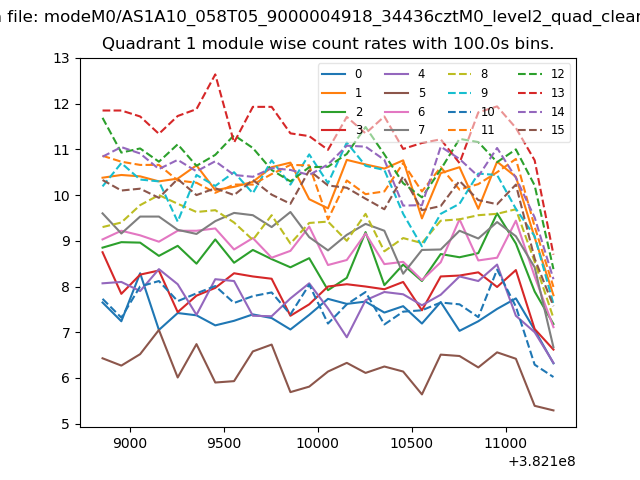
| Module-wise count rates for Quadrant A Data is divided into 100 sec bins |
 |
 |
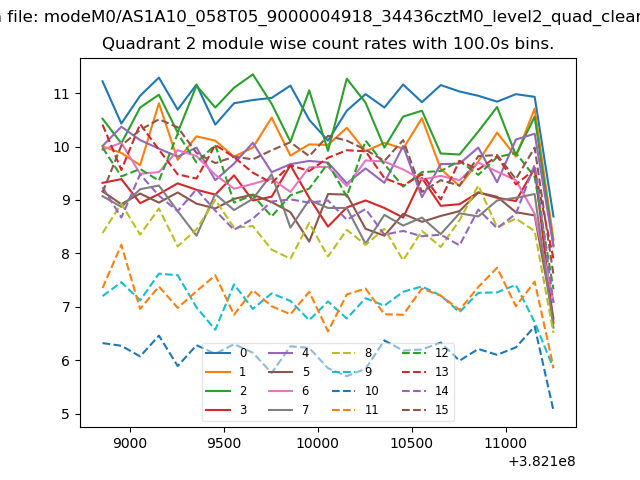
| Module-wise count rates for Quadrant B Data is divided into 100 sec bins |
 |
 |
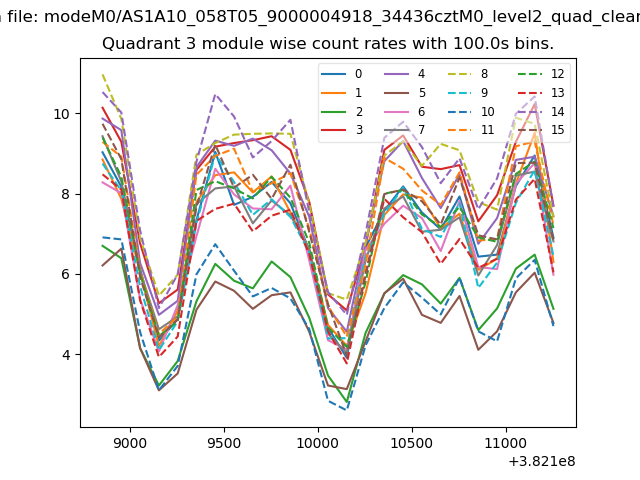
| Module-wise count rates for Quadrant C Data is divided into 100 sec bins |
 |
 |
| Module-wise count rates for Quadrant D Data is divided into 100 sec bins |
 |
 |
| Parameter | Plot |
|---|---|
| CZT HV Monitor | 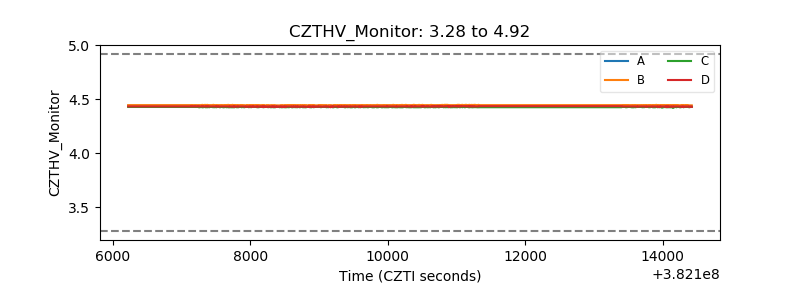 |
| D_VDD | 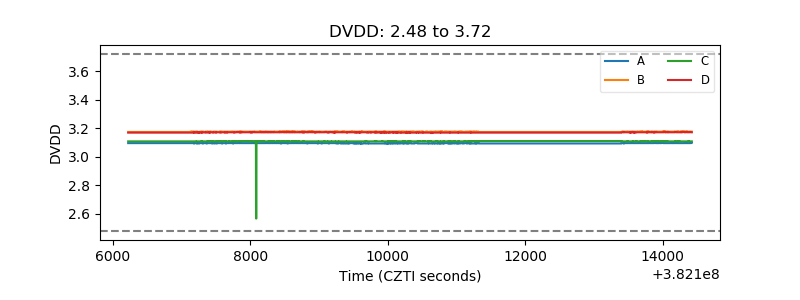 |
| Temperature 1 |  |
| Veto HV Monitor | 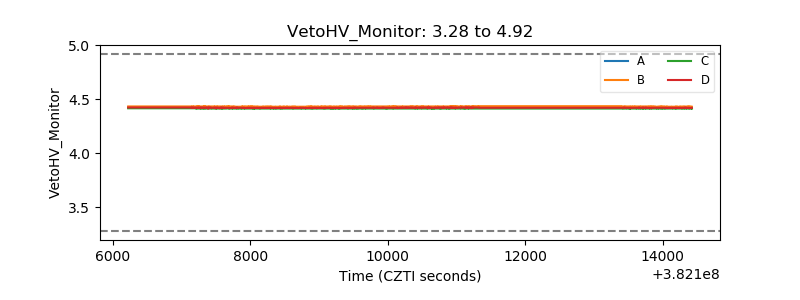 |
| Veto LLD | 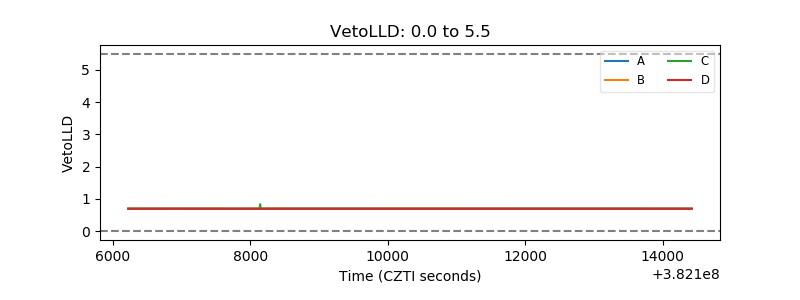 |
| Alpha Counter | 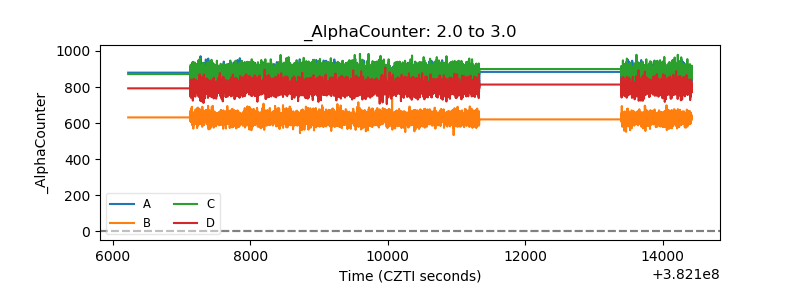 |
| _CPM_Rate | 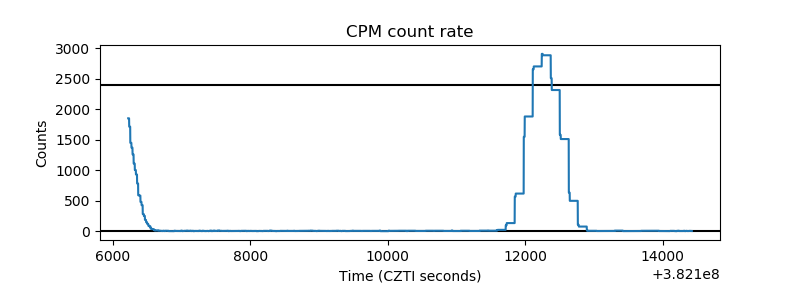 |
| CZT Counter | 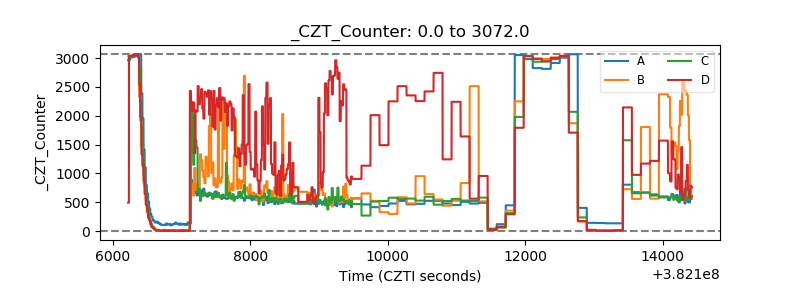 |
| +2.5 Volts monitor | 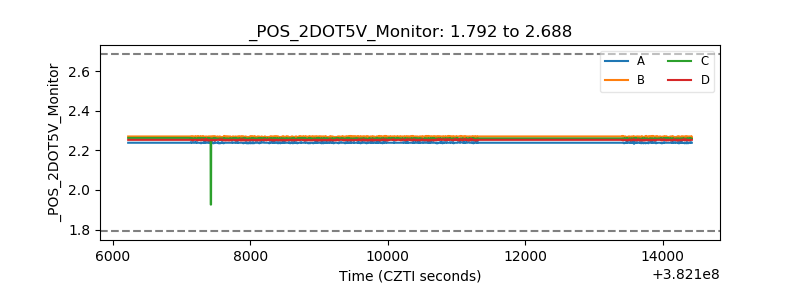 |
| +5 Volts monitor | 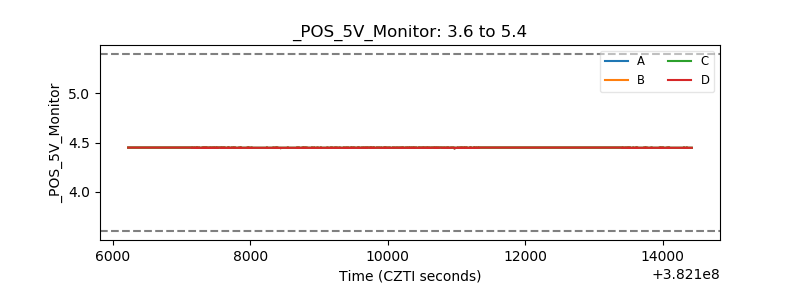 |
| _ROLL_ROT | 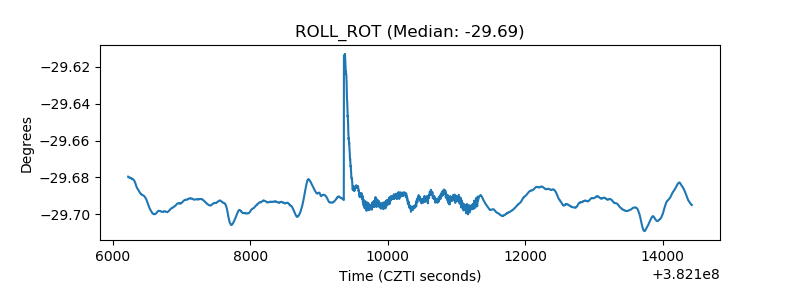 |
| _Roll_DEC | 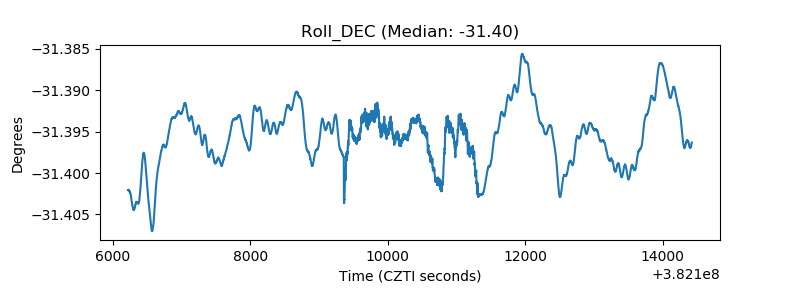 |
| _Roll_RA | 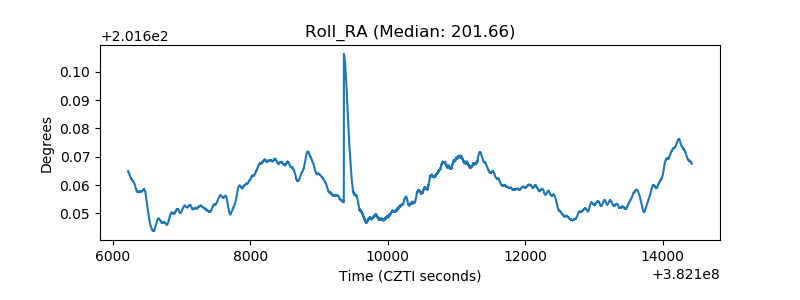 |
| Veto Counter | 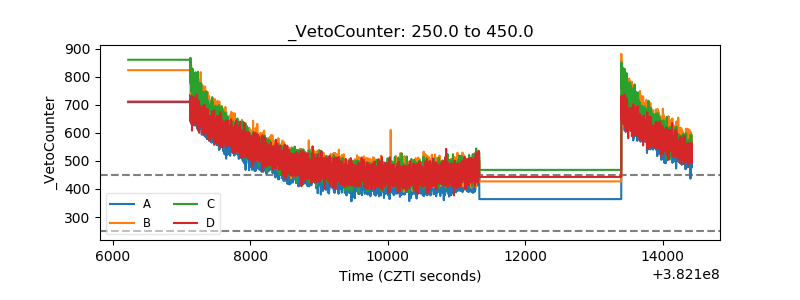 |