| Param | Original file | Final file |
|---|---|---|
| Filename | modeM0/AS1A05_082T10_9000004916_34431cztM0_level2.evt | modeM0/AS1A05_082T10_9000004916_34431cztM0_level2_quad_clean.evt |
| Size (bytes) | 756,728,640 | 100,920,960 |
| Size | 721.7 MB | 96.2 MB |
| Events in quadrant A | 4,416,331 | 608,169 |
| Events in quadrant B | 5,858,167 | 609,164 |
| Events in quadrant C | 5,011,906 | 609,098 |
| Events in quadrant D | 6,994,597 | 576,852 |
| Mode M9 | |||
|---|---|---|---|
| Quadrant | BADHDUFLAG | Total packets | Discarded packets |
| A | 0 | 21 | 0 |
| B | 0 | 21 | 0 |
| C | 0 | 21 | 0 |
| D | 0 | 22 | 0 |
| Mode SS | |||
|---|---|---|---|
| Quadrant | BADHDUFLAG | Total packets | Discarded packets |
| A | 0 | 190 | 0 |
| B | 0 | 190 | 0 |
| C | 0 | 190 | 0 |
| D | 0 | 190 | 0 |
| Mode M0 | |||
|---|---|---|---|
| Quadrant | BADHDUFLAG | Total packets | Discarded packets |
| A | 0 | 19223 | 3 |
| B | 0 | 23493 | 2 |
| C | 0 | 20664 | 2 |
| D | 0 | 27361 | 2 |
| Quadrant | Total seconds | Saturated seconds | Saturation percentage |
|---|---|---|---|
| A | 9412 | 18 | 0.191245% |
| B | 9412 | 425 | 4.515512% |
| C | 9412 | 10 | 0.106247% |
| D | 9412 | 390 | 4.143646% |
Noise dominated data is calculated using 1-second bins in cleaned event files. If a bin has >2000 counts, and if more than 50% of those come from <1% of pixels, then it is considered to be noise-dominated and hence unusable.
| Quadrant | # 1 sec bins | Bins with >0 counts | Bins with >2000 counts | High rate bins dominated by noise | Noise dominated (total time) | Noise dominated (detector-on time) | Marked lightcurve |
|---|---|---|---|---|---|---|---|
| A | 22924 | 9414 | 1 | 1 | 0.00% | 0.01% | 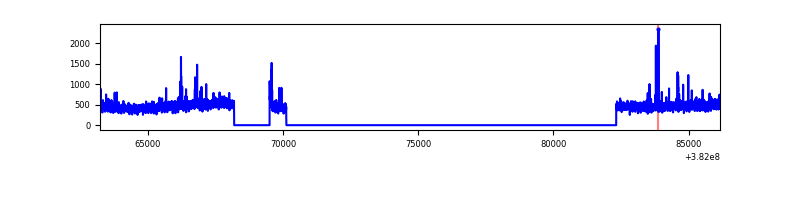 |
| B | 22924 | 9414 | 312 | 312 | 1.36% | 3.31% | 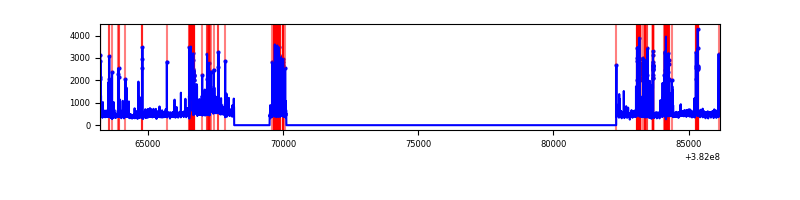 |
| C | 22924 | 9414 | 3 | 3 | 0.01% | 0.03% | 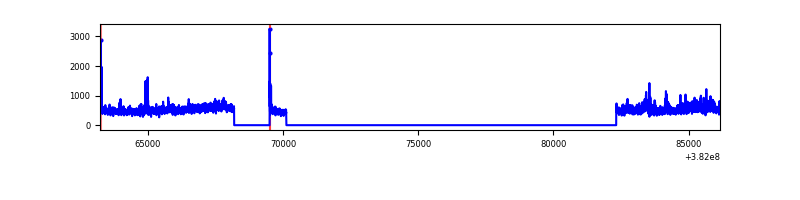 |
| D | 22924 | 9414 | 287 | 287 | 1.25% | 3.05% | 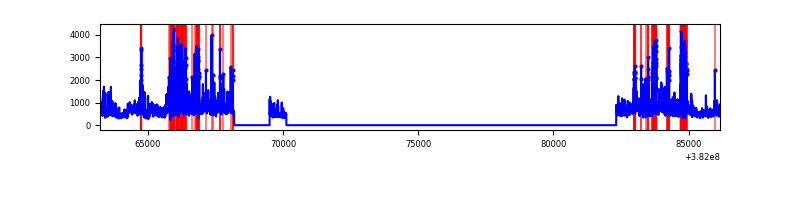 |
Top three noisy pixels from each quadrant. If the there are fewer than three noisy pixels in the level2.evt file, extra rows are filled as -1
| Pixel properties | Quadrant properties | ||||||
|---|---|---|---|---|---|---|---|
| Quadrant | DetID | PixID | Counts | Sigma | Mean | Median | Sigma |
| A | 7 | 16 | 77952 | 346.71 | 1106 | 1084 | 221.7 |
| A | 10 | 83 | 41853 | 183.89 | 1106 | 1084 | 221.7 |
| A | 13 | 6 | 17880 | 75.76 | 1106 | 1084 | 221.7 |
| B | 5 | 172 | 1159115 | 5586.02 | 1074 | 1043 | 207.3 |
| B | 0 | 190 | 245022 | 1176.85 | 1074 | 1043 | 207.3 |
| B | 4 | 232 | 83752 | 398.95 | 1074 | 1043 | 207.3 |
| C | 15 | 214 | 388022 | 1564.67 | 1069 | 1080 | 247.3 |
| C | 14 | 67 | 294826 | 1187.81 | 1069 | 1080 | 247.3 |
| C | 4 | 254 | 53864 | 213.44 | 1069 | 1080 | 247.3 |
| D | 8 | 195 | 1159621 | 4448.33 | 1056 | 1026 | 260.5 |
| D | 7 | 80 | 505895 | 1938.4 | 1056 | 1026 | 260.5 |
| D | 2 | 250 | 417891 | 1600.52 | 1056 | 1026 | 260.5 |
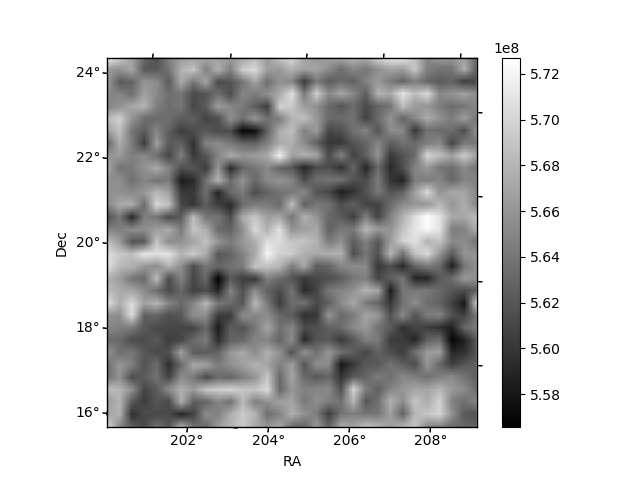
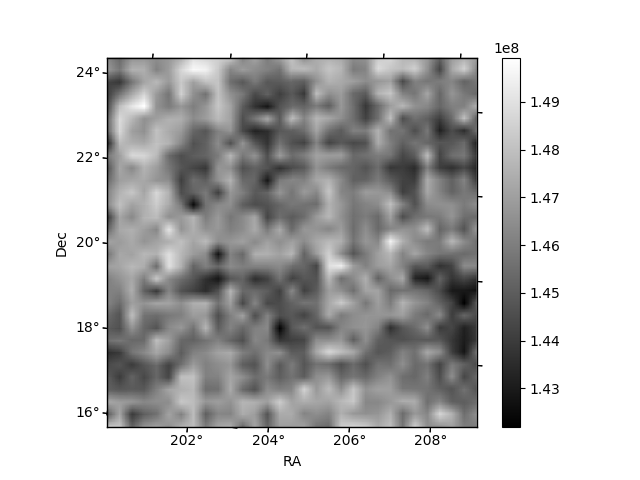
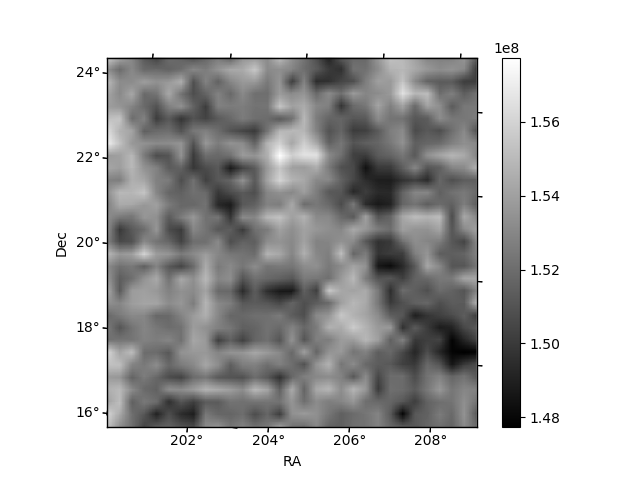
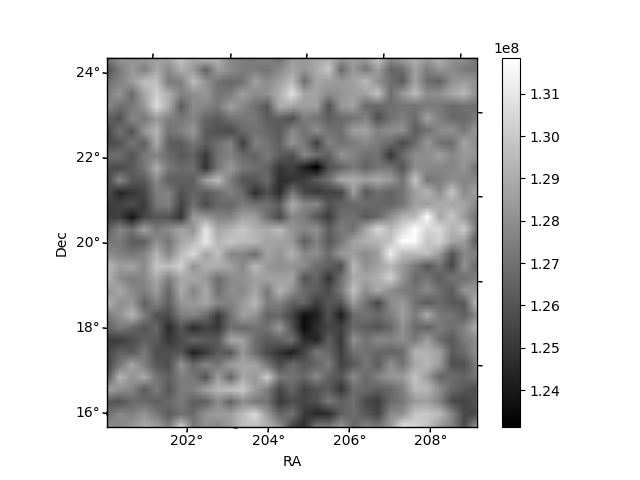
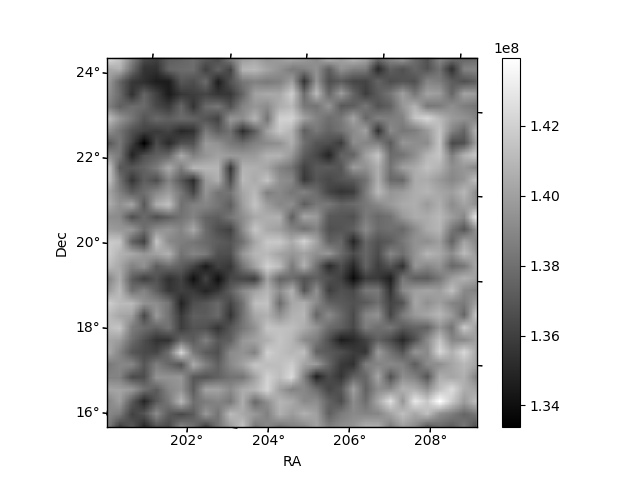
Histogram calculated using DETX and DETY for each event in the final _common_clean file
| Quadrant A | 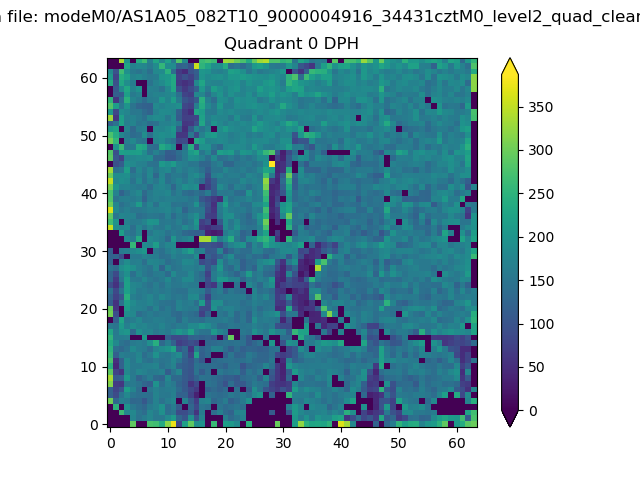 |
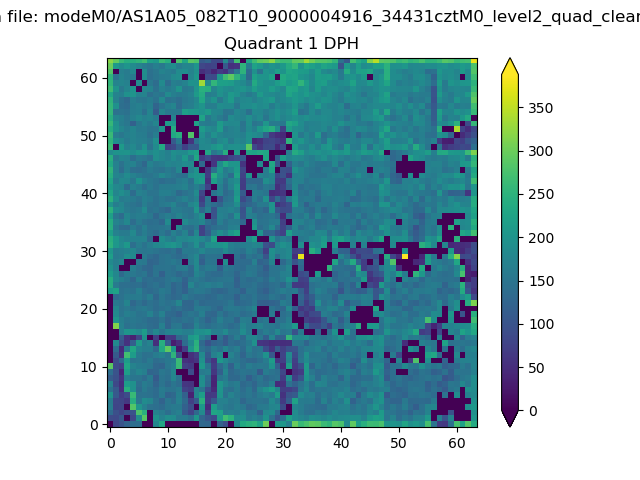 |
Quadrant B |
|---|---|---|---|
| Quadrant D | 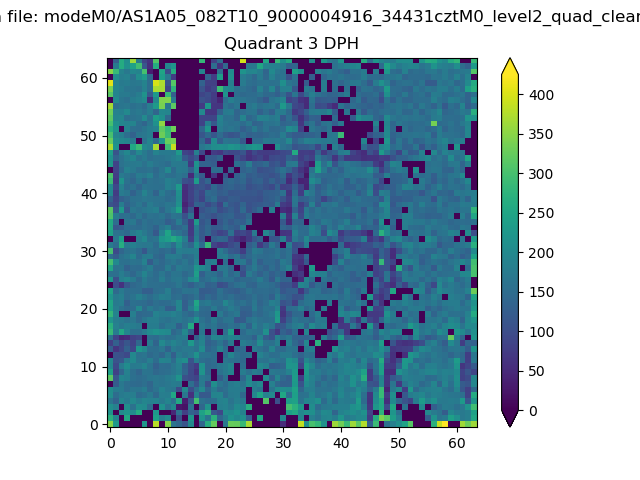 |
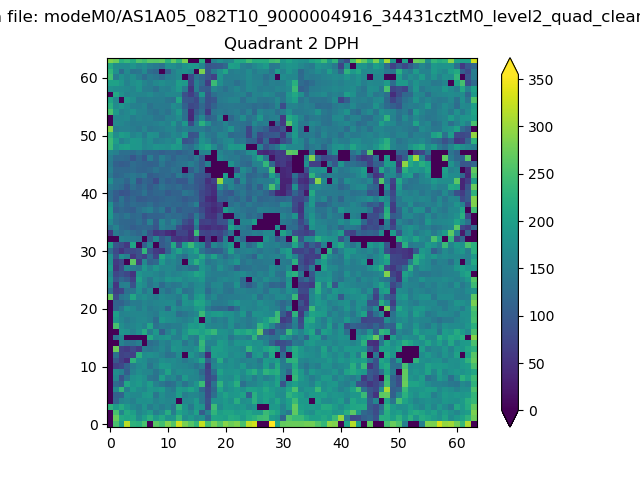 |
Quadrant C |
| Plot type | Count rate plots | Images |
|---|---|---|
| Comparison with Poisson distribution Blue bars denote a histogram of data divided into 1 sec bins. Red curve is a Poisson curve with rate = median count rate of data. |
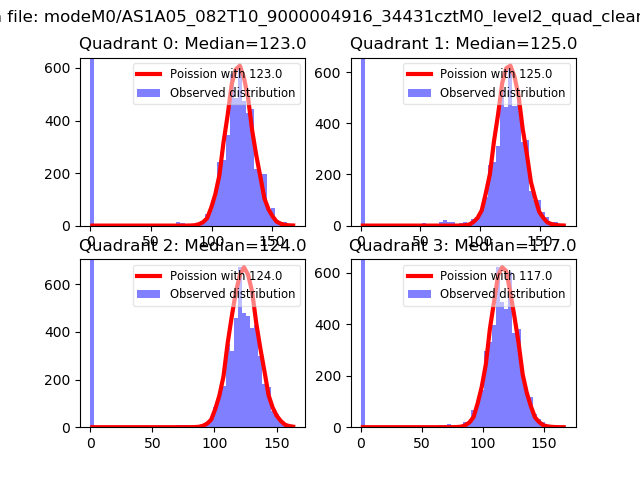 |
 |
| Quadrant-wise count rates Data is divided into 100 sec bins |
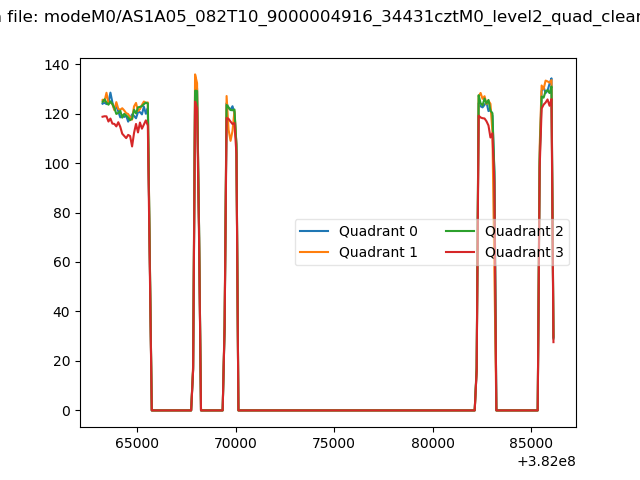 |
|
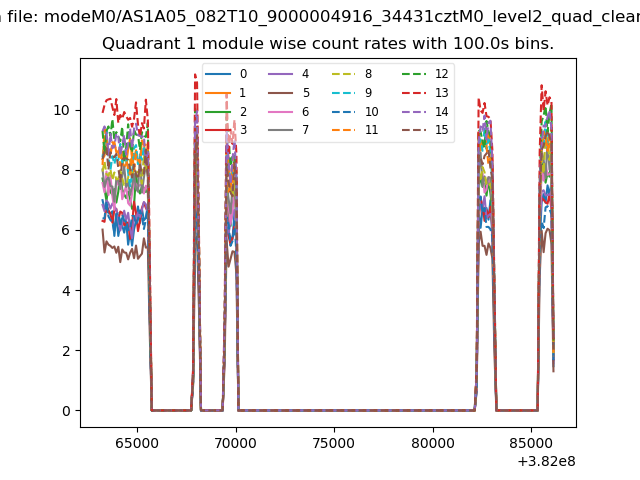
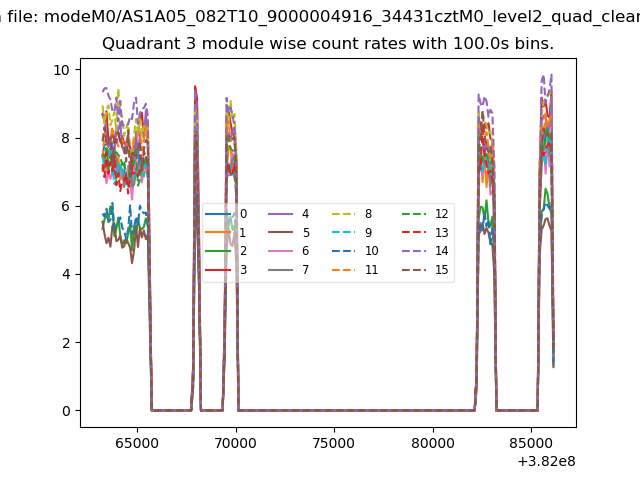
| Module-wise count rates for Quadrant A Data is divided into 100 sec bins |
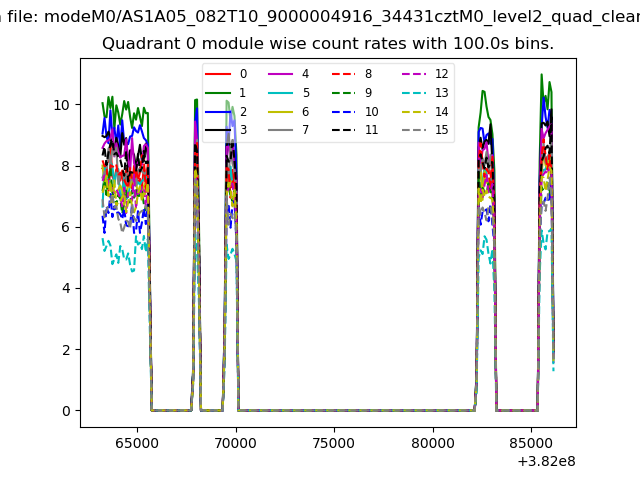 |
 |
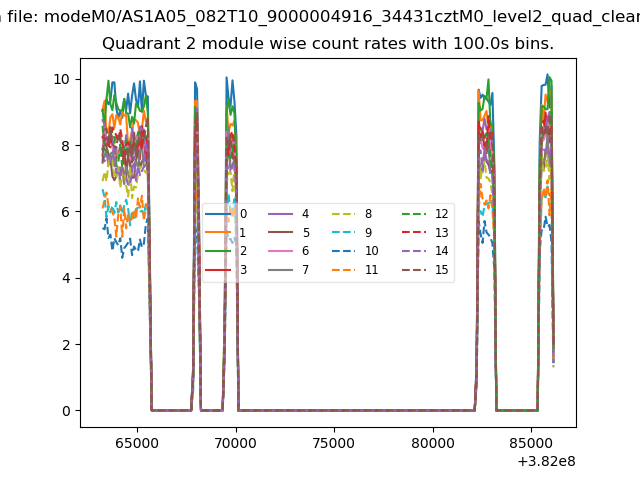
| Module-wise count rates for Quadrant B Data is divided into 100 sec bins |
 |
 |
| Module-wise count rates for Quadrant C Data is divided into 100 sec bins |
 |
 |
| Module-wise count rates for Quadrant D Data is divided into 100 sec bins |
 |
 |
| Parameter | Plot |
|---|---|
| CZT HV Monitor | 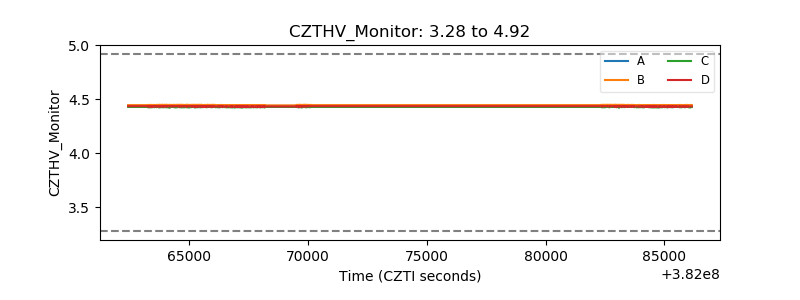 |
| D_VDD | 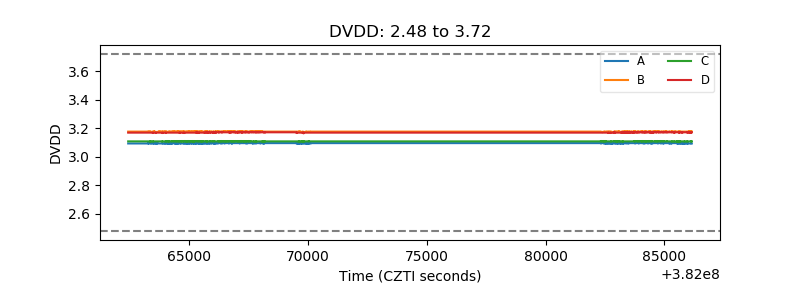 |
| Temperature 1 | 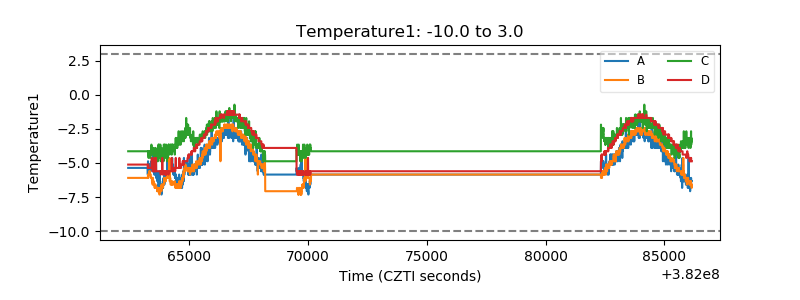 |
| Veto HV Monitor | 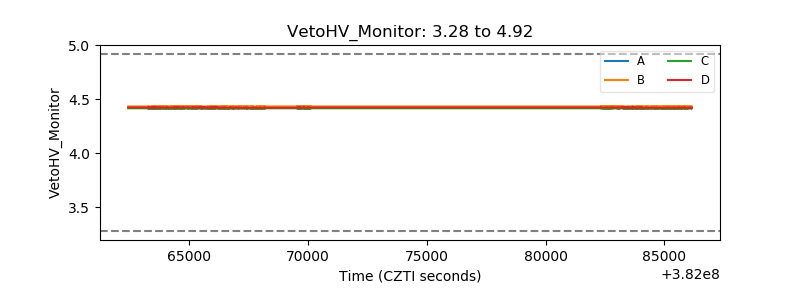 |
| Veto LLD | 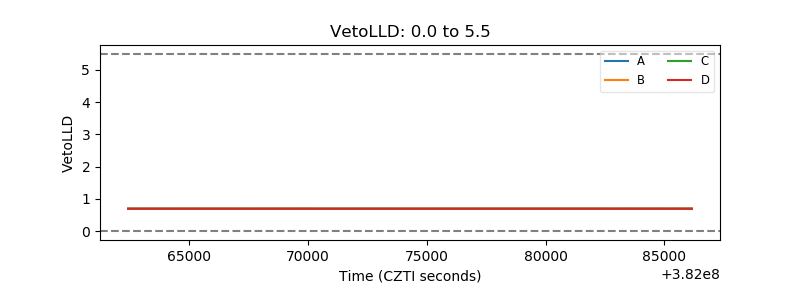 |
| Alpha Counter | 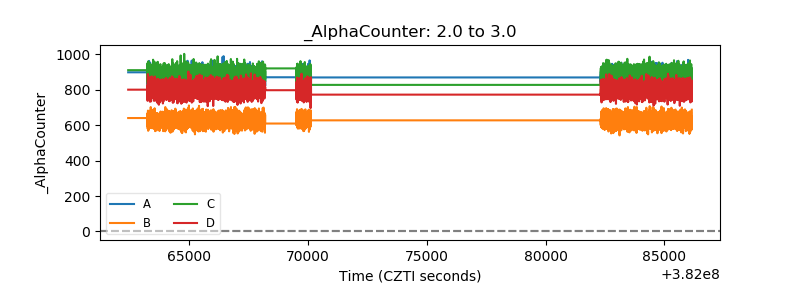 |
| _CPM_Rate | 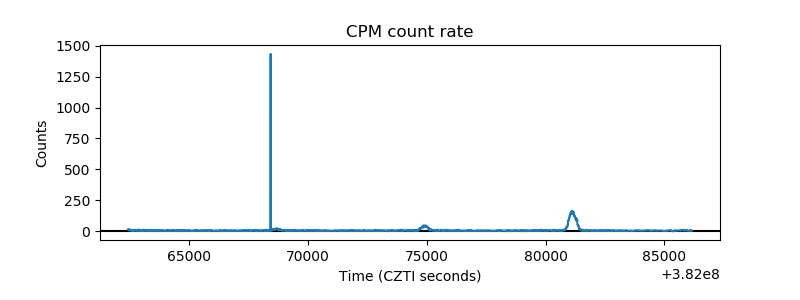 |
| CZT Counter | 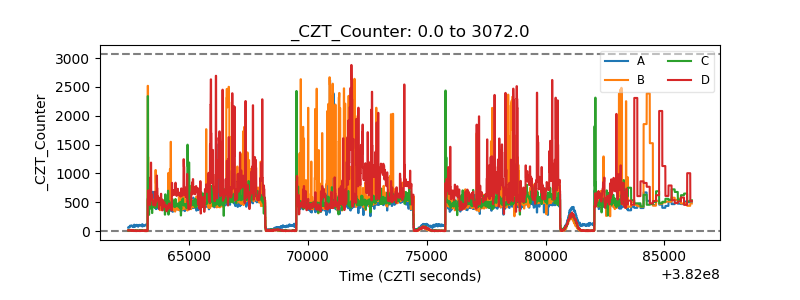 |
| +2.5 Volts monitor | 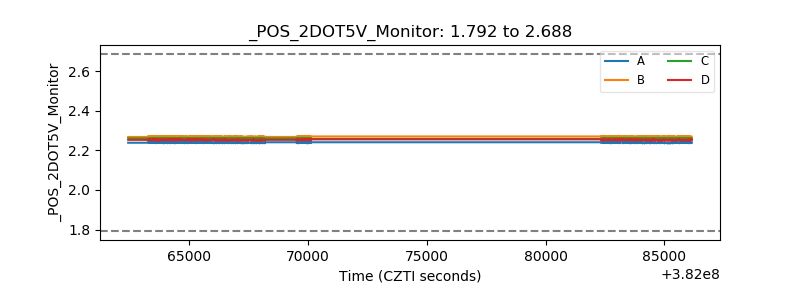 |
| +5 Volts monitor | 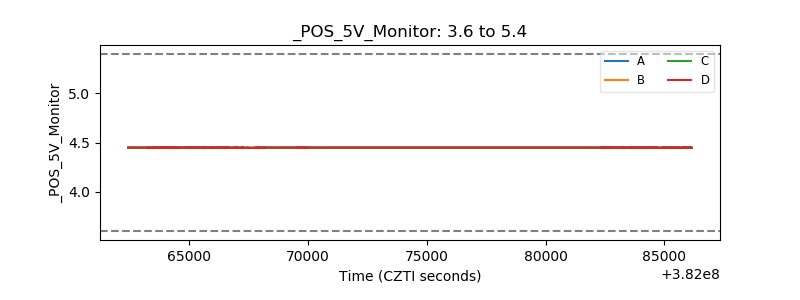 |
| _ROLL_ROT | 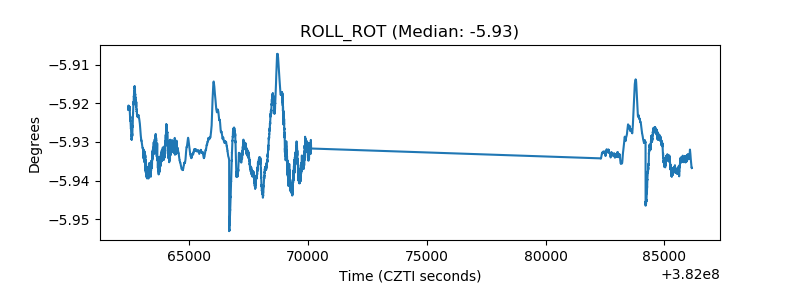 |
| _Roll_DEC | 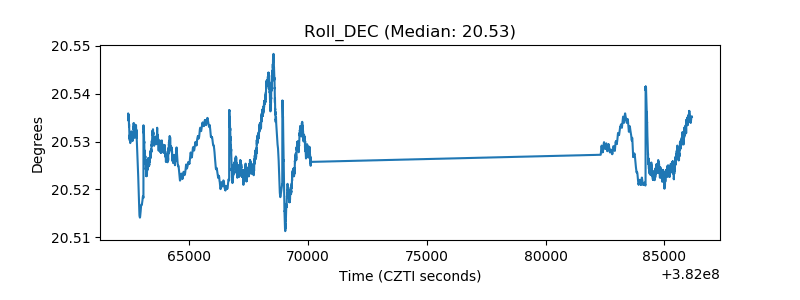 |
| _Roll_RA | 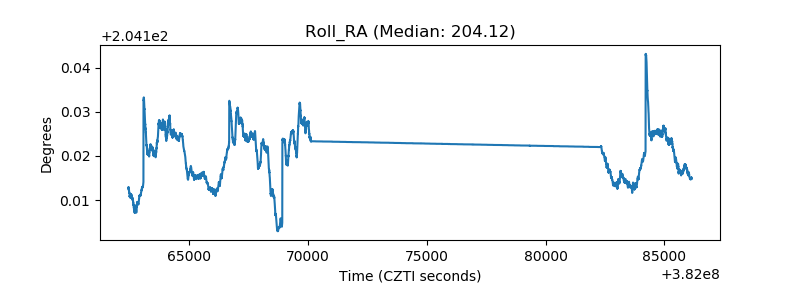 |
| Veto Counter | 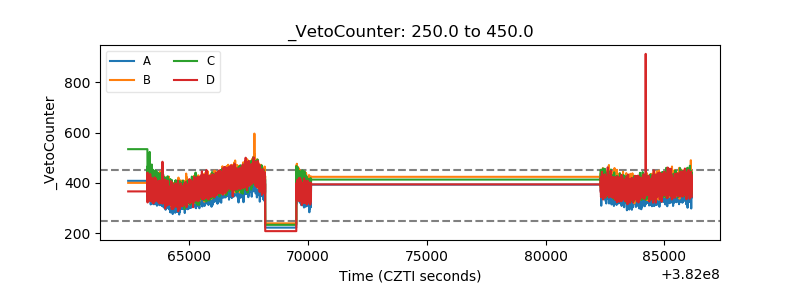 |