| Param | Original file | Final file |
|---|---|---|
| Filename | modeM0/AS1A05_082T10_9000004916_34426cztM0_level2.evt | modeM0/AS1A05_082T10_9000004916_34426cztM0_level2_quad_clean.evt |
| Size (bytes) | 473,852,160 | 80,426,880 |
| Size | 451.9 MB | 76.7 MB |
| Events in quadrant A | 2,597,629 | 521,413 |
| Events in quadrant B | 2,933,124 | 530,401 |
| Events in quadrant C | 2,985,054 | 519,887 |
| Events in quadrant D | 5,457,722 | 474,727 |
| Mode M9 | |||
|---|---|---|---|
| Quadrant | BADHDUFLAG | Total packets | Discarded packets |
| A | 0 | 27 | 0 |
| B | 0 | 27 | 0 |
| C | 0 | 27 | 0 |
| D | 0 | 28 | 0 |
| Mode SS | |||
|---|---|---|---|
| Quadrant | BADHDUFLAG | Total packets | Discarded packets |
| A | 0 | 114 | 0 |
| B | 0 | 114 | 0 |
| C | 0 | 114 | 0 |
| D | 0 | 114 | 0 |
| Mode M0 | |||
|---|---|---|---|
| Quadrant | BADHDUFLAG | Total packets | Discarded packets |
| A | 0 | 11409 | 3 |
| B | 0 | 12484 | 2 |
| C | 0 | 12367 | 2 |
| D | 0 | 20153 | 2 |
| Quadrant | Total seconds | Saturated seconds | Saturation percentage |
|---|---|---|---|
| A | 5557 | 11 | 0.197949% |
| B | 5557 | 33 | 0.593846% |
| C | 5557 | 32 | 0.575850% |
| D | 5557 | 463 | 8.331834% |
Noise dominated data is calculated using 1-second bins in cleaned event files. If a bin has >2000 counts, and if more than 50% of those come from <1% of pixels, then it is considered to be noise-dominated and hence unusable.
| Quadrant | # 1 sec bins | Bins with >0 counts | Bins with >2000 counts | High rate bins dominated by noise | Noise dominated (total time) | Noise dominated (detector-on time) | Marked lightcurve |
|---|---|---|---|---|---|---|---|
| A | 7080 | 5558 | 1 | 1 | 0.01% | 0.02% |  |
| B | 7080 | 5558 | 11 | 11 | 0.16% | 0.20% | 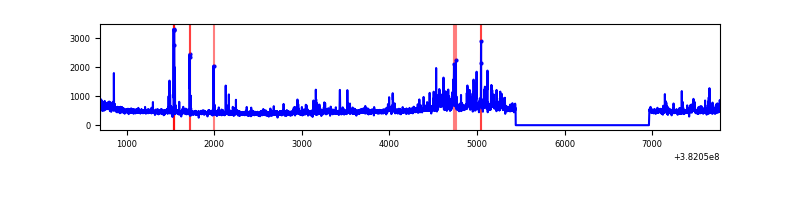 |
| C | 7080 | 5558 | 19 | 19 | 0.27% | 0.34% | 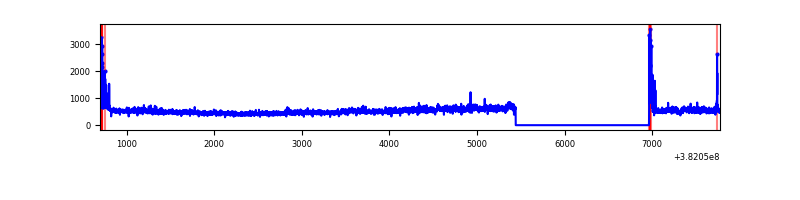 |
| D | 7080 | 5558 | 390 | 390 | 5.51% | 7.02% | 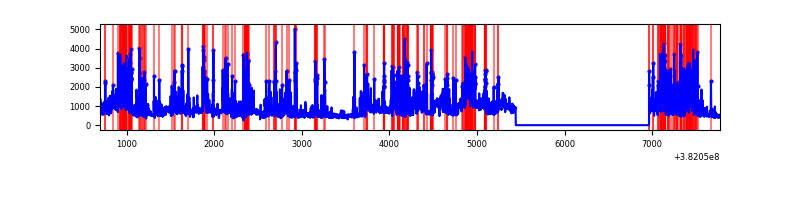 |
Top three noisy pixels from each quadrant. If the there are fewer than three noisy pixels in the level2.evt file, extra rows are filled as -1
| Pixel properties | Quadrant properties | ||||||
|---|---|---|---|---|---|---|---|
| Quadrant | DetID | PixID | Counts | Sigma | Mean | Median | Sigma |
| A | 10 | 83 | 35178 | 259.02 | 655 | 643 | 133.3 |
| A | 13 | 6 | 14254 | 102.09 | 655 | 643 | 133.3 |
| A | 9 | 143 | 10593 | 74.63 | 655 | 643 | 133.3 |
| B | 0 | 190 | 134036 | 1065.99 | 652 | 635 | 125.1 |
| B | 5 | 172 | 130942 | 1041.26 | 652 | 635 | 125.1 |
| B | 0 | 229 | 45101 | 355.32 | 652 | 635 | 125.1 |
| C | 15 | 214 | 235192 | 1594.06 | 635 | 641 | 147.1 |
| C | 14 | 67 | 140193 | 948.42 | 635 | 641 | 147.1 |
| C | 0 | 10 | 110515 | 746.73 | 635 | 641 | 147.1 |
| D | 7 | 80 | 1207781 | 7954.21 | 613 | 598 | 151.8 |
| D | 8 | 195 | 864289 | 5690.92 | 613 | 598 | 151.8 |
| D | 2 | 250 | 295123 | 1940.65 | 613 | 598 | 151.8 |
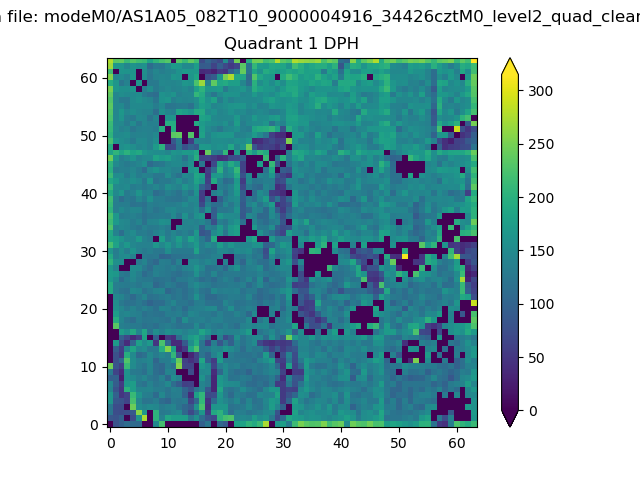
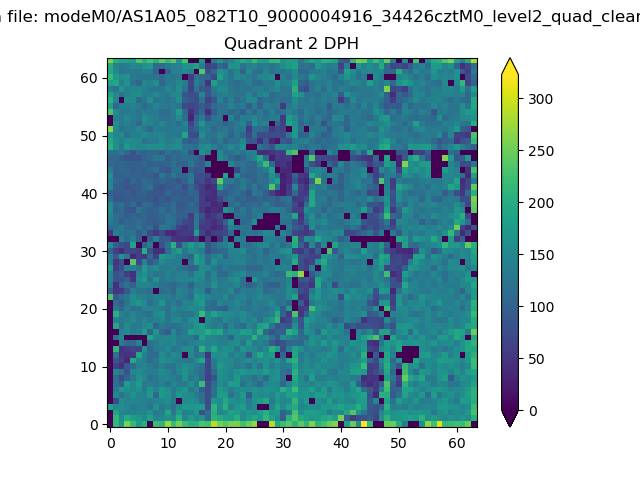
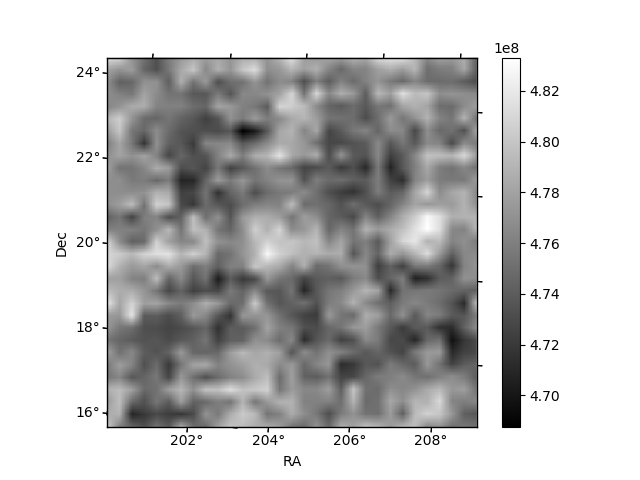
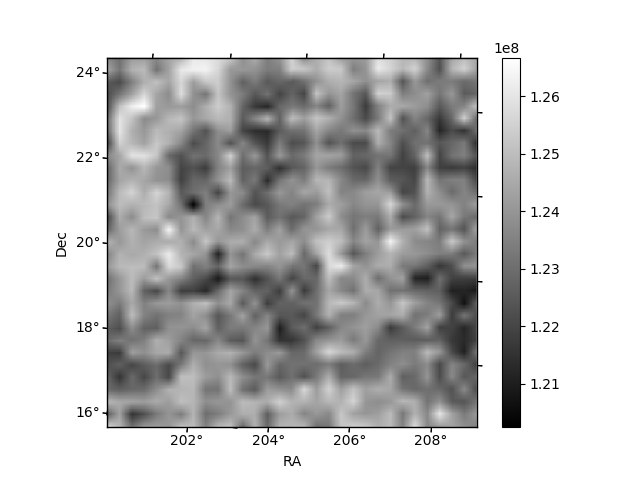
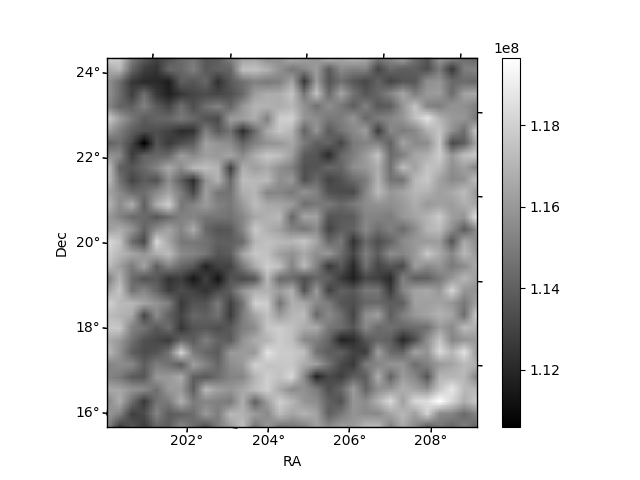
Histogram calculated using DETX and DETY for each event in the final _common_clean file
| Quadrant A | 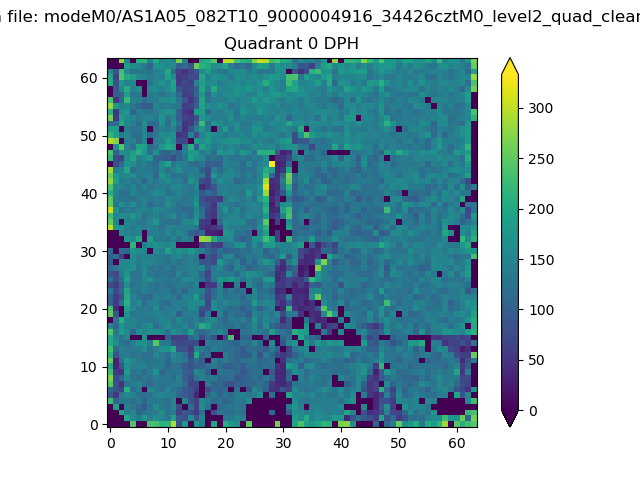 |
 |
Quadrant B |
|---|---|---|---|
| Quadrant D | 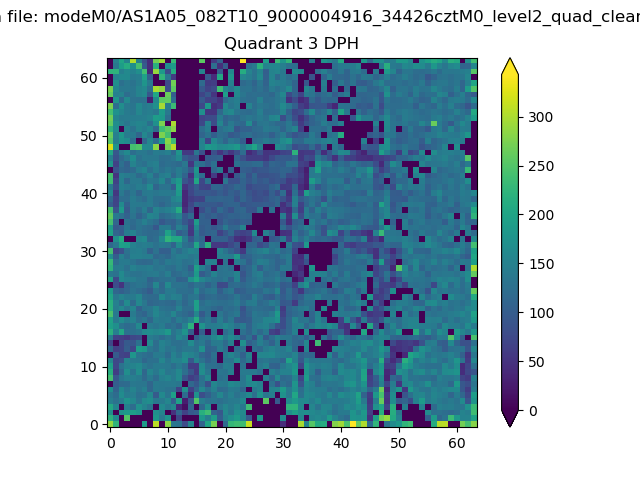 |
 |
Quadrant C |
| Plot type | Count rate plots | Images |
|---|---|---|
| Comparison with Poisson distribution Blue bars denote a histogram of data divided into 1 sec bins. Red curve is a Poisson curve with rate = median count rate of data. |
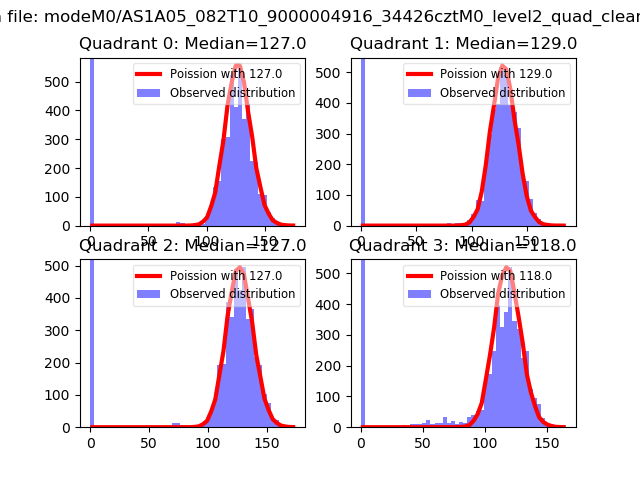 |
 |
| Quadrant-wise count rates Data is divided into 100 sec bins |
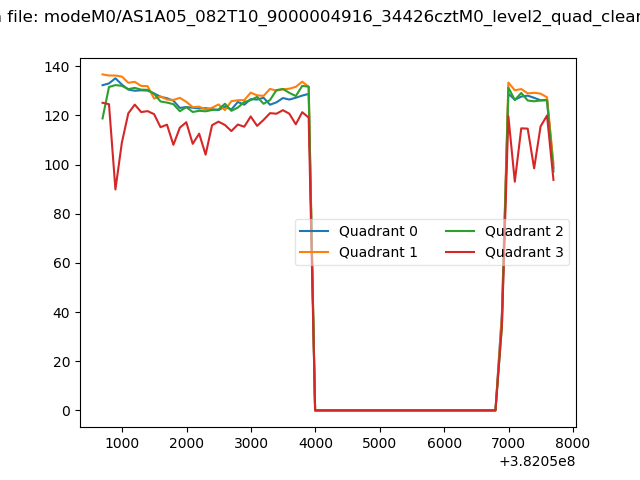 |
|
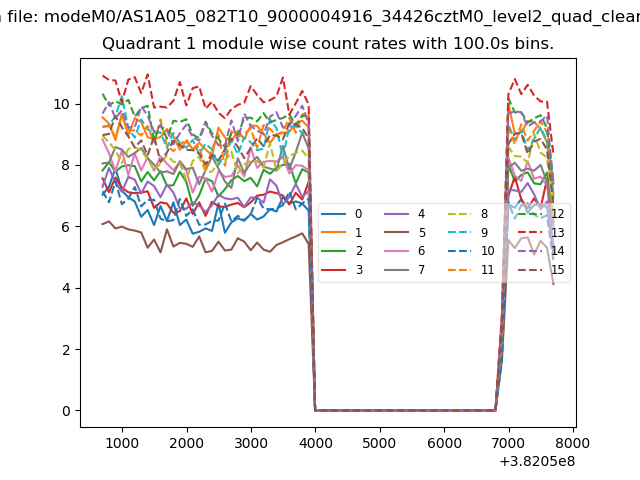
| Module-wise count rates for Quadrant A Data is divided into 100 sec bins |
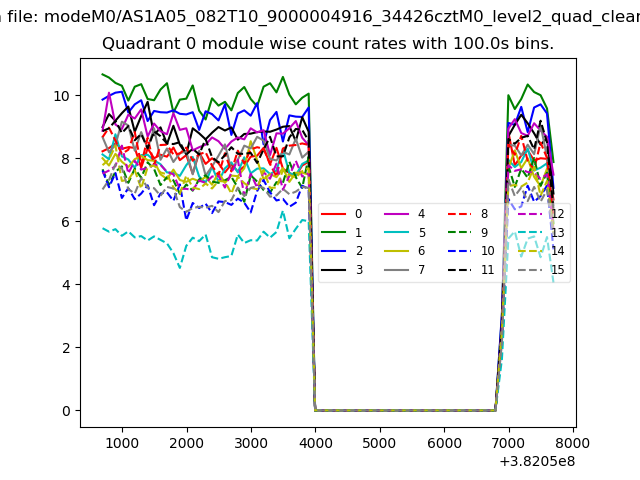 |
 |
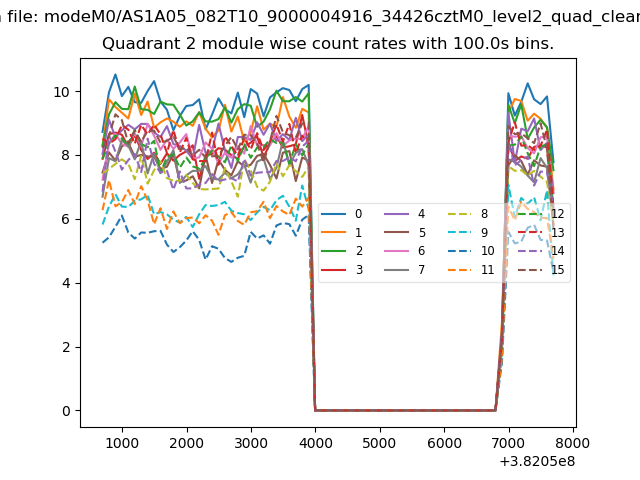
| Module-wise count rates for Quadrant B Data is divided into 100 sec bins |
 |
 |
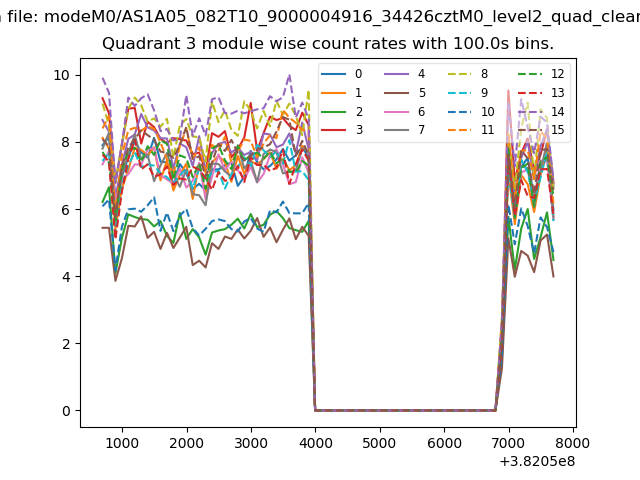
| Module-wise count rates for Quadrant C Data is divided into 100 sec bins |
 |
 |
| Module-wise count rates for Quadrant D Data is divided into 100 sec bins |
 |
 |
| Parameter | Plot |
|---|---|
| CZT HV Monitor | 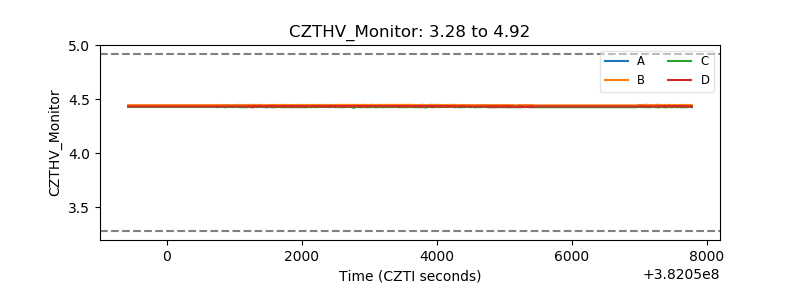 |
| D_VDD | 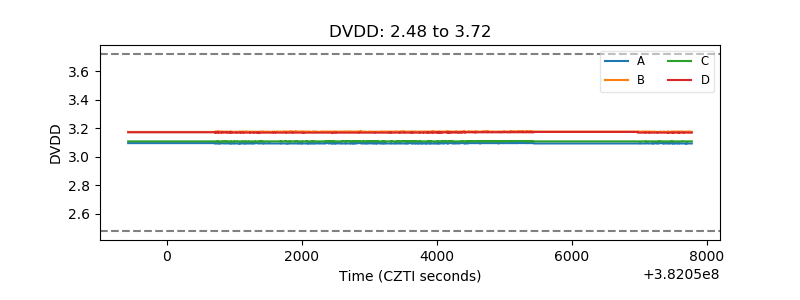 |
| Temperature 1 | 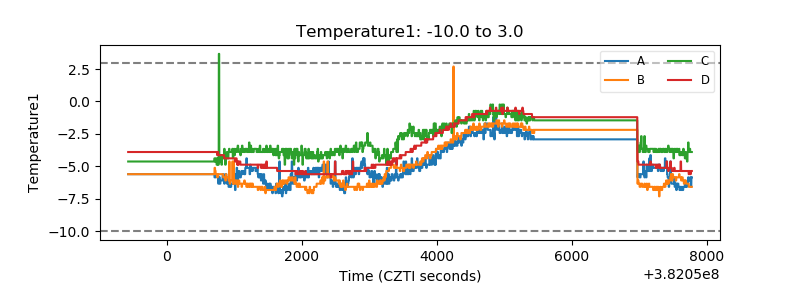 |
| Veto HV Monitor | 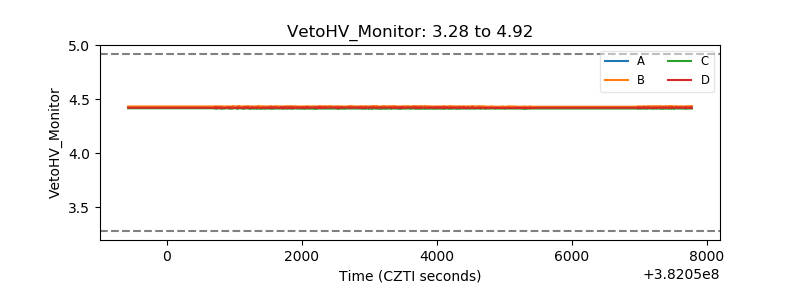 |
| Veto LLD | 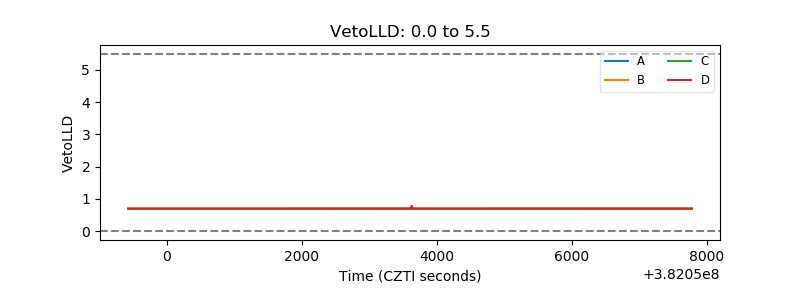 |
| Alpha Counter | 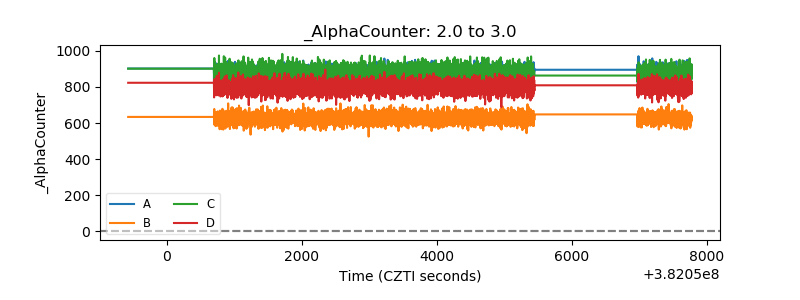 |
| _CPM_Rate | 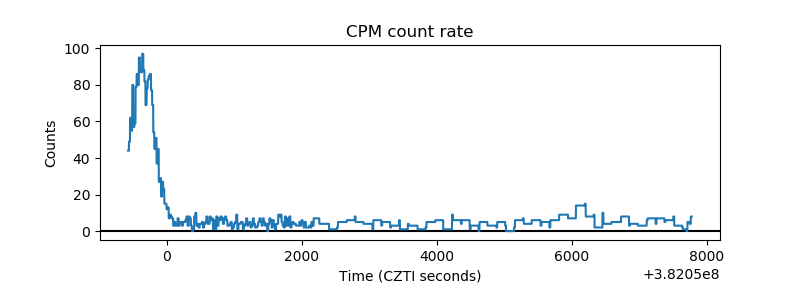 |
| CZT Counter | 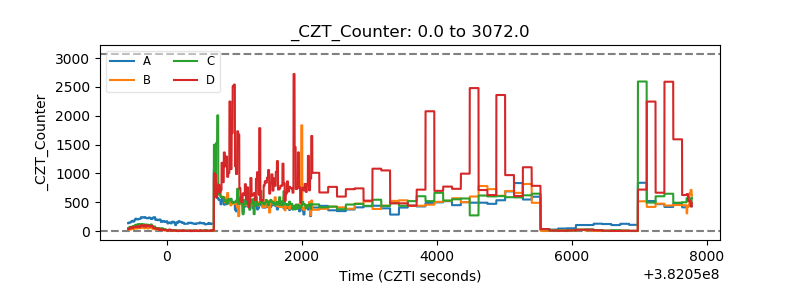 |
| +2.5 Volts monitor | 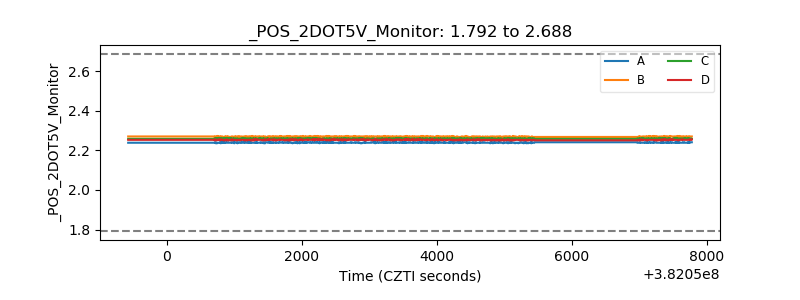 |
| +5 Volts monitor | 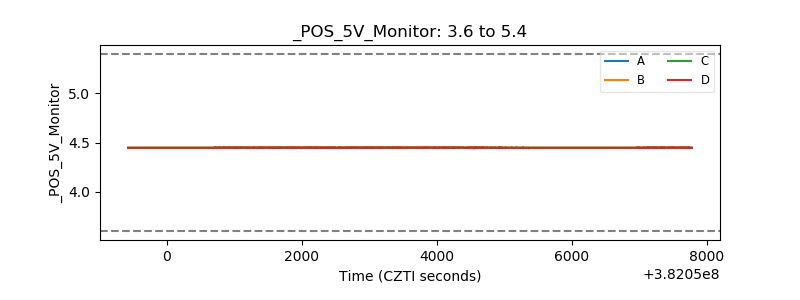 |
| _ROLL_ROT | 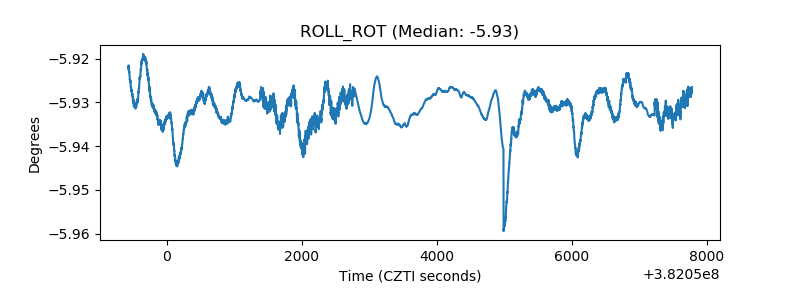 |
| _Roll_DEC | 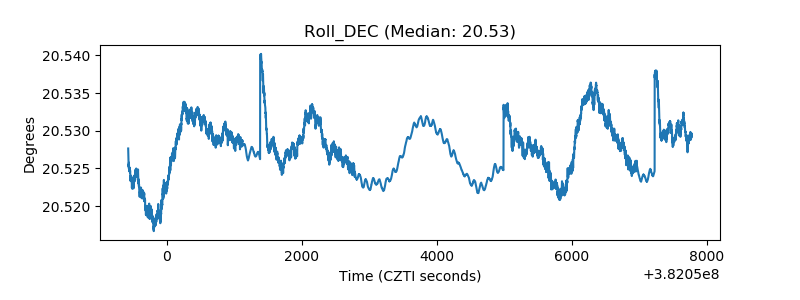 |
| _Roll_RA | 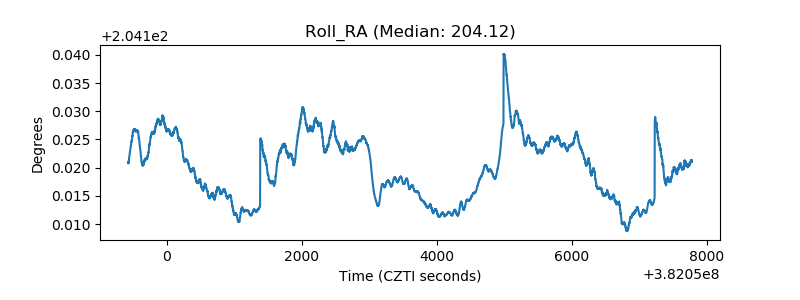 |
| Veto Counter | 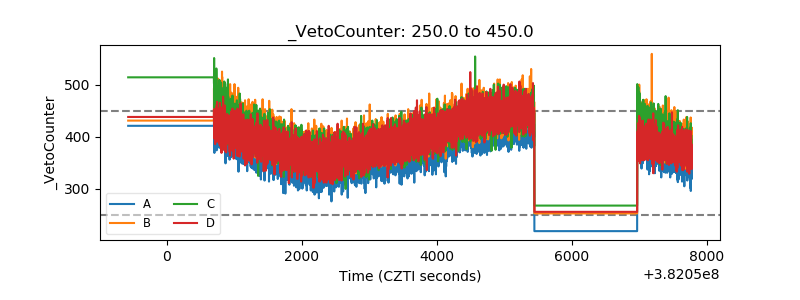 |