| Param | Original file | Final file |
|---|---|---|
| Filename | modeM0/AS1A05_108T02_9000004914_34424cztM0_level2.evt | modeM0/AS1A05_108T02_9000004914_34424cztM0_level2_quad_clean.evt |
| Size (bytes) | 440,616,960 | 93,600,000 |
| Size | 420.2 MB | 89.3 MB |
| Events in quadrant A | 2,473,143 | 638,355 |
| Events in quadrant B | 3,110,002 | 644,351 |
| Events in quadrant C | 2,818,408 | 624,657 |
| Events in quadrant D | 4,601,246 | 574,743 |
| Mode SS | |||
|---|---|---|---|
| Quadrant | BADHDUFLAG | Total packets | Discarded packets |
| A | 0 | 102 | 0 |
| B | 0 | 102 | 0 |
| C | 0 | 102 | 0 |
| D | 0 | 102 | 0 |
| Mode M9 | |||
|---|---|---|---|
| Quadrant | BADHDUFLAG | Total packets | Discarded packets |
| A | 0 | 22 | 0 |
| B | 0 | 22 | 0 |
| C | 0 | 22 | 0 |
| D | 0 | 23 | 0 |
| Mode M0 | |||
|---|---|---|---|
| Quadrant | BADHDUFLAG | Total packets | Discarded packets |
| A | 0 | 10427 | 3 |
| B | 0 | 12355 | 2 |
| C | 0 | 11252 | 2 |
| D | 0 | 17133 | 2 |
| Quadrant | Total seconds | Saturated seconds | Saturation percentage |
|---|---|---|---|
| A | 5030 | 3 | 0.059642% |
| B | 5030 | 174 | 3.459245% |
| C | 5030 | 69 | 1.371769% |
| D | 5030 | 331 | 6.580517% |
Noise dominated data is calculated using 1-second bins in cleaned event files. If a bin has >2000 counts, and if more than 50% of those come from <1% of pixels, then it is considered to be noise-dominated and hence unusable.
| Quadrant | # 1 sec bins | Bins with >0 counts | Bins with >2000 counts | High rate bins dominated by noise | Noise dominated (total time) | Noise dominated (detector-on time) | Marked lightcurve |
|---|---|---|---|---|---|---|---|
| A | 7123 | 5031 | 0 | 0 | 0.00% | 0.00% | 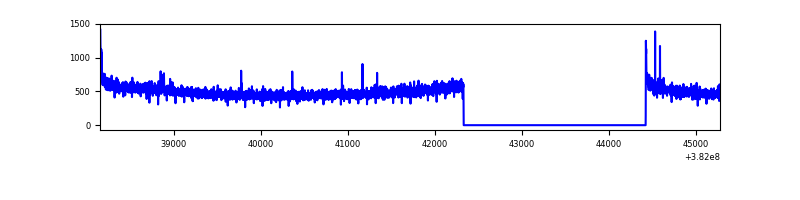 |
| B | 7123 | 5031 | 125 | 125 | 1.75% | 2.48% | 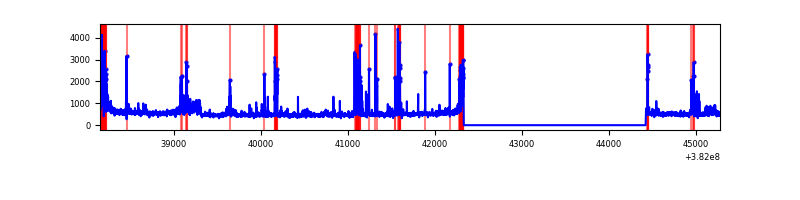 |
| C | 7123 | 5031 | 47 | 47 | 0.66% | 0.93% | 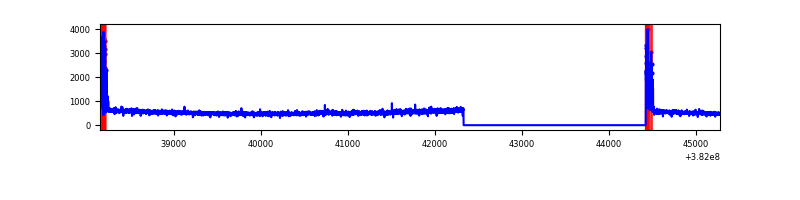 |
| D | 7123 | 5031 | 290 | 290 | 4.07% | 5.76% | 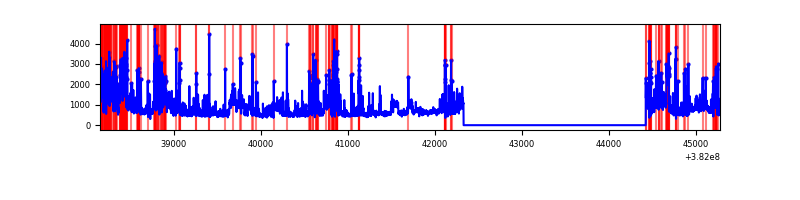 |
Top three noisy pixels from each quadrant. If the there are fewer than three noisy pixels in the level2.evt file, extra rows are filled as -1
| Pixel properties | Quadrant properties | ||||||
|---|---|---|---|---|---|---|---|
| Quadrant | DetID | PixID | Counts | Sigma | Mean | Median | Sigma |
| A | 10 | 83 | 35959 | 282.23 | 624 | 613 | 125.2 |
| A | 13 | 254 | 9354 | 69.79 | 624 | 613 | 125.2 |
| A | 13 | 6 | 9119 | 67.92 | 624 | 613 | 125.2 |
| B | 5 | 172 | 416030 | 3576.62 | 614 | 601 | 116.2 |
| B | 0 | 190 | 137553 | 1179.08 | 614 | 601 | 116.2 |
| B | 0 | 229 | 39911 | 338.44 | 614 | 601 | 116.2 |
| C | 15 | 214 | 213973 | 1547.17 | 599 | 607 | 137.9 |
| C | 0 | 10 | 204457 | 1478.17 | 599 | 607 | 137.9 |
| C | 14 | 67 | 46830 | 335.17 | 599 | 607 | 137.9 |
| D | 8 | 195 | 791519 | 5532.61 | 583 | 566 | 143.0 |
| D | 2 | 250 | 409356 | 2859.43 | 583 | 566 | 143.0 |
| D | 7 | 80 | 323759 | 2260.69 | 583 | 566 | 143.0 |
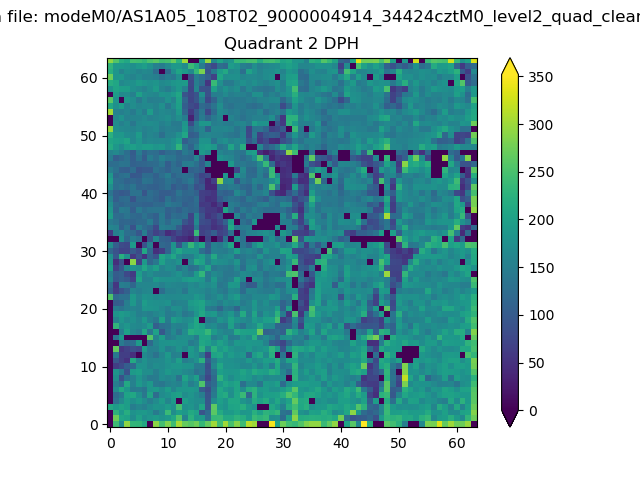
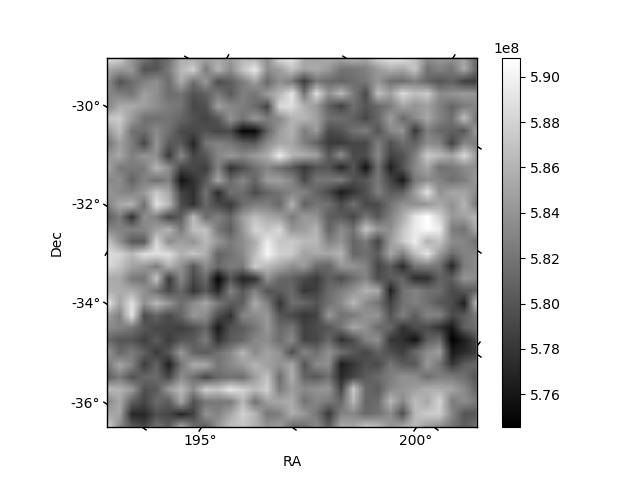
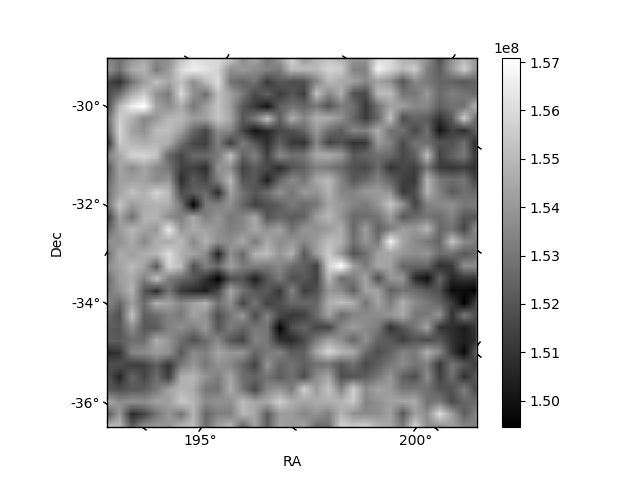
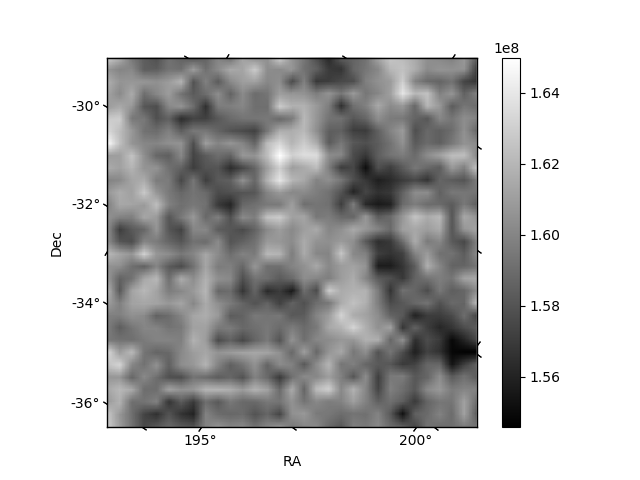
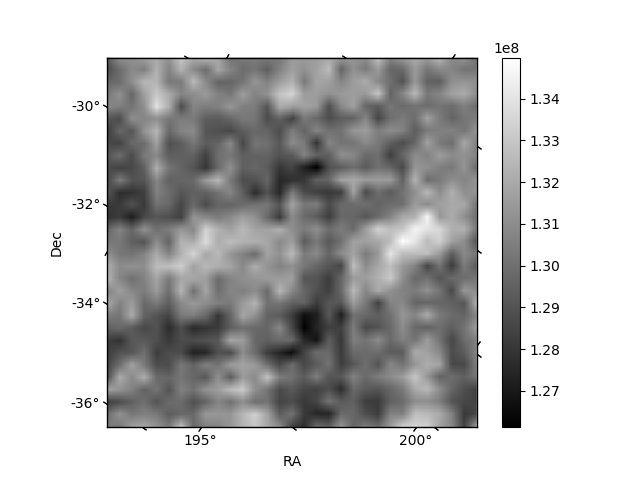
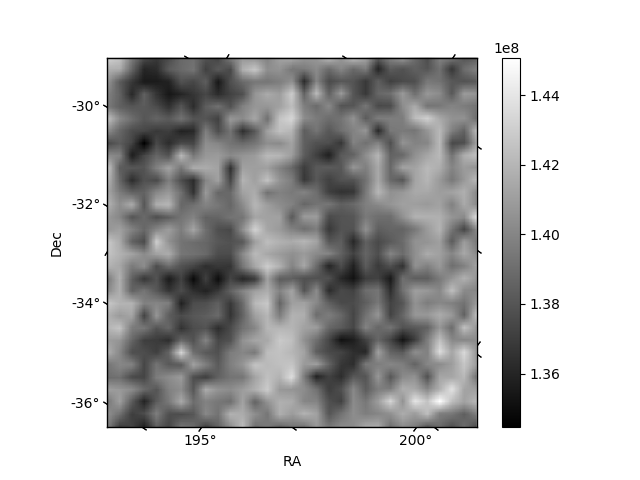
Histogram calculated using DETX and DETY for each event in the final _common_clean file
| Quadrant A | 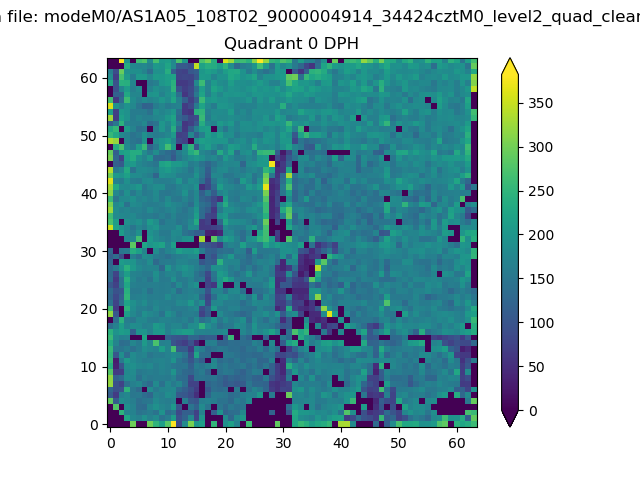 |
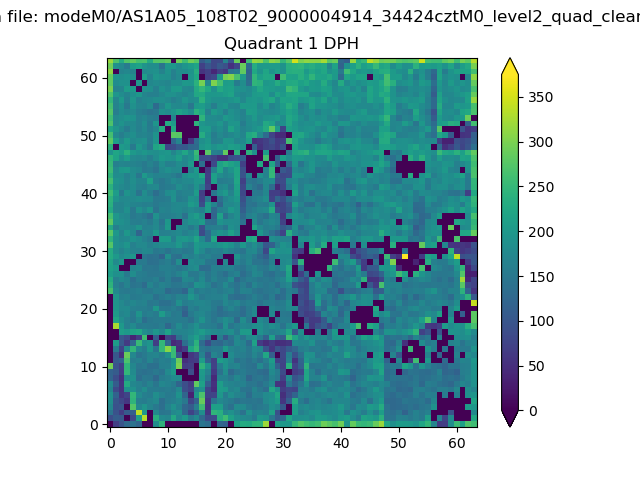 |
Quadrant B |
|---|---|---|---|
| Quadrant D | 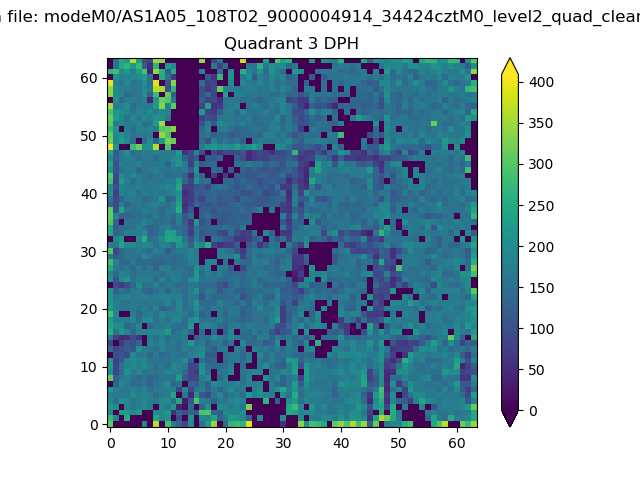 |
 |
Quadrant C |
| Plot type | Count rate plots | Images |
|---|---|---|
| Comparison with Poisson distribution Blue bars denote a histogram of data divided into 1 sec bins. Red curve is a Poisson curve with rate = median count rate of data. |
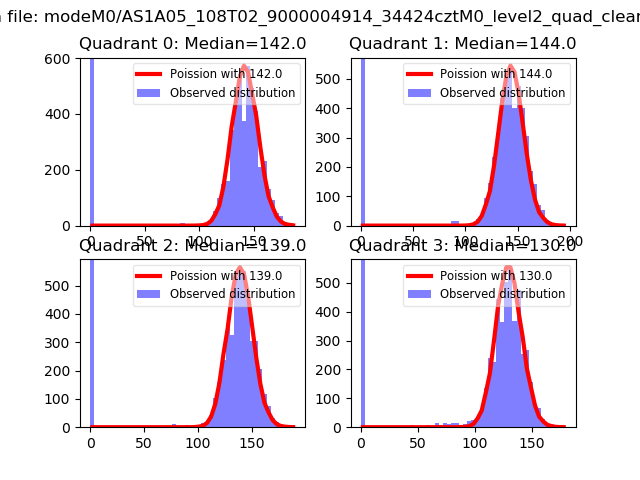 |
 |
| Quadrant-wise count rates Data is divided into 100 sec bins |
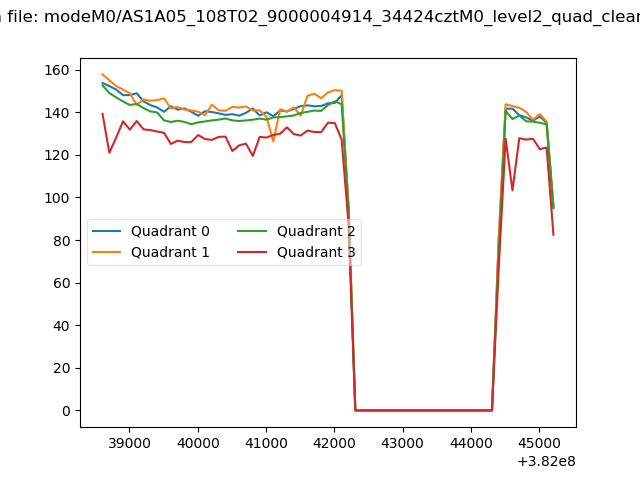 |
|
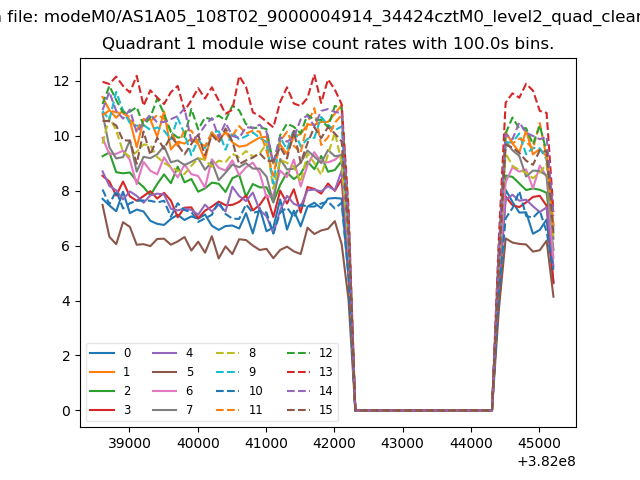
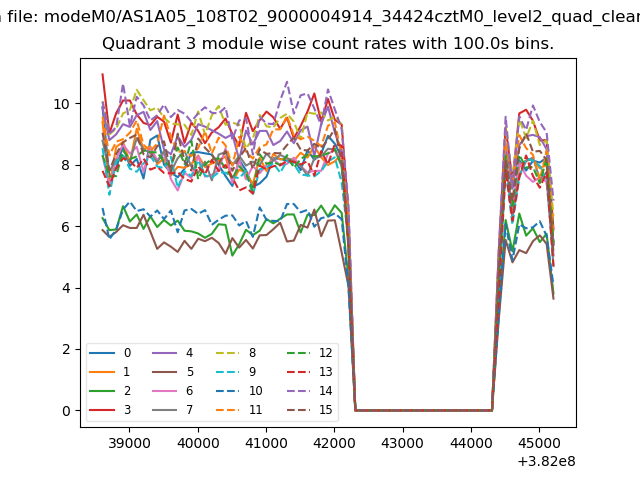
| Module-wise count rates for Quadrant A Data is divided into 100 sec bins |
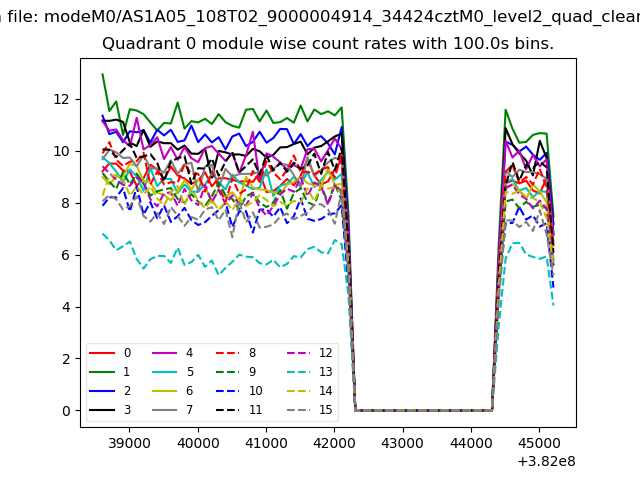 |
 |
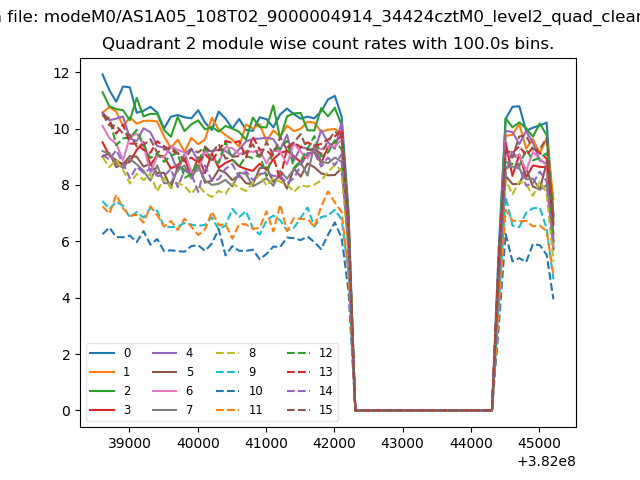
| Module-wise count rates for Quadrant B Data is divided into 100 sec bins |
 |
 |
| Module-wise count rates for Quadrant C Data is divided into 100 sec bins |
 |
 |
| Module-wise count rates for Quadrant D Data is divided into 100 sec bins |
 |
 |
| Parameter | Plot |
|---|---|
| CZT HV Monitor | 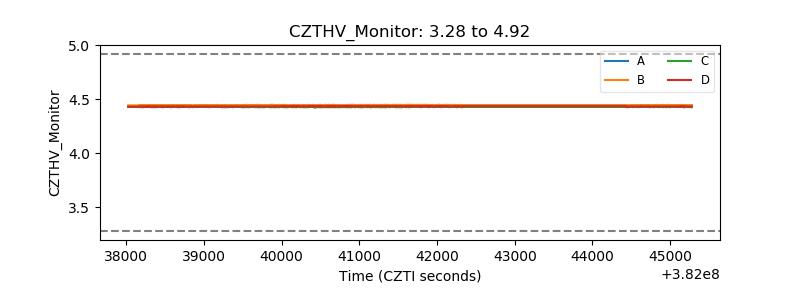 |
| D_VDD | 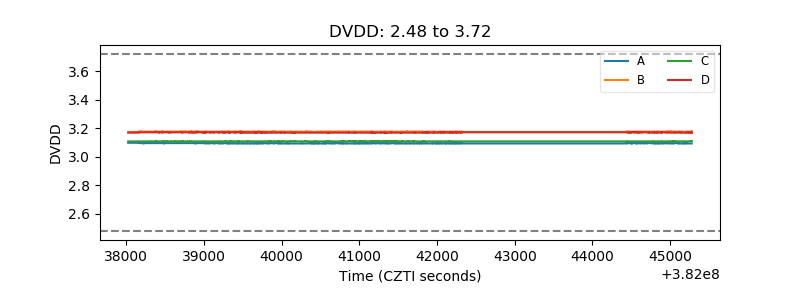 |
| Temperature 1 | 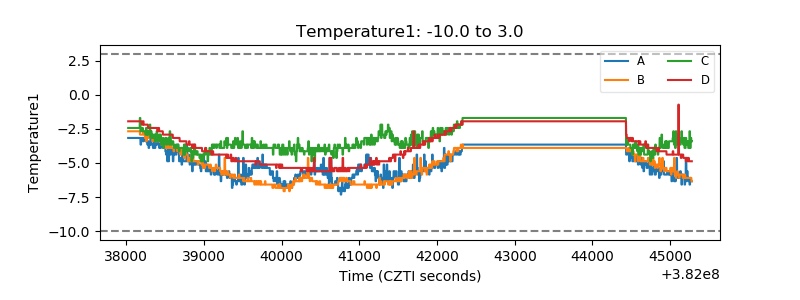 |
| Veto HV Monitor | 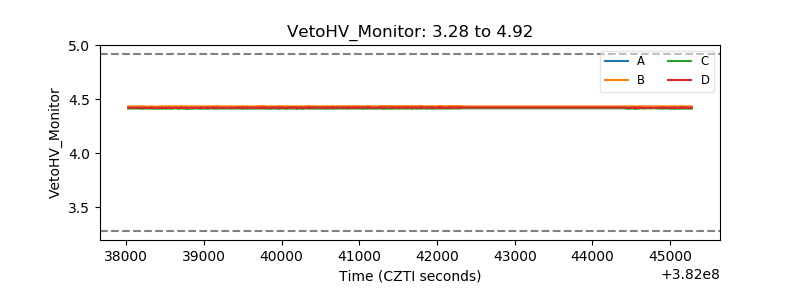 |
| Veto LLD | 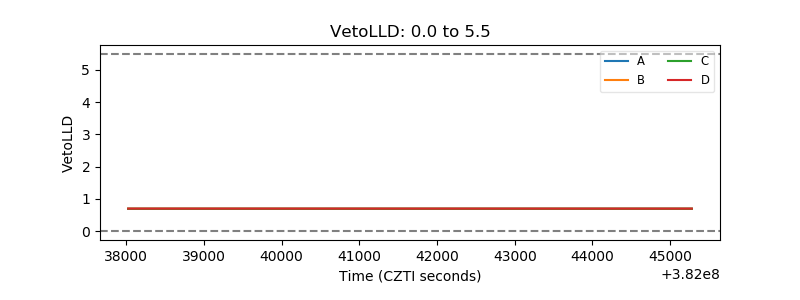 |
| Alpha Counter | 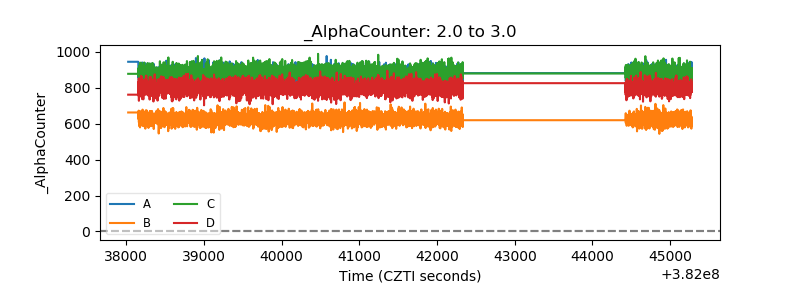 |
| _CPM_Rate | 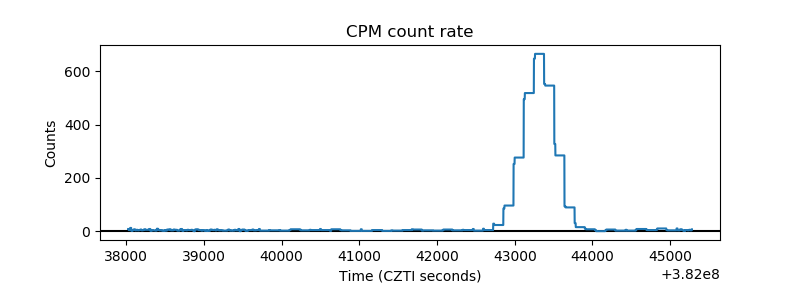 |
| CZT Counter | 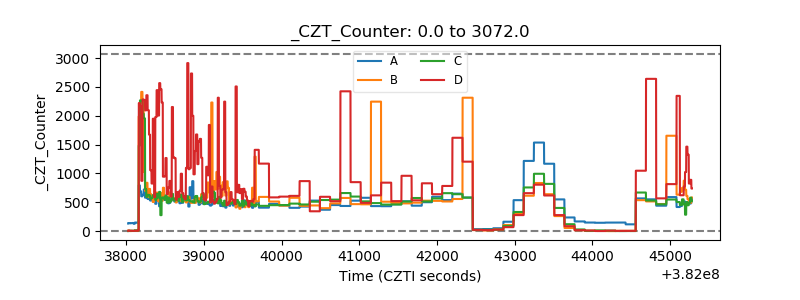 |
| +2.5 Volts monitor | 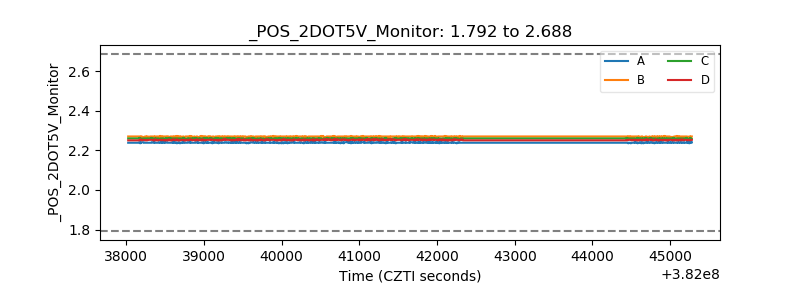 |
| +5 Volts monitor | 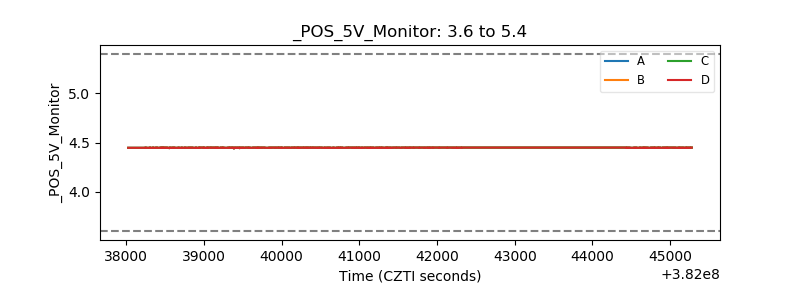 |
| _ROLL_ROT | 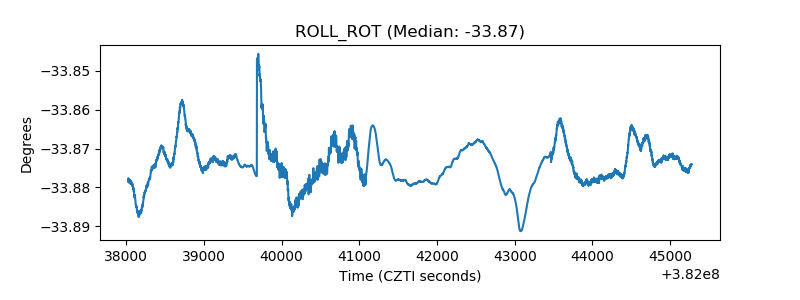 |
| _Roll_DEC | 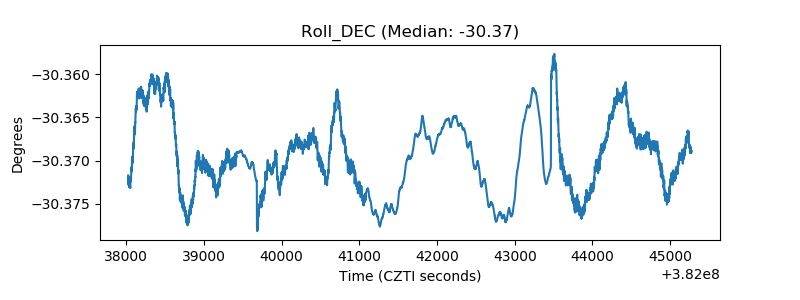 |
| _Roll_RA |  |
| Veto Counter | 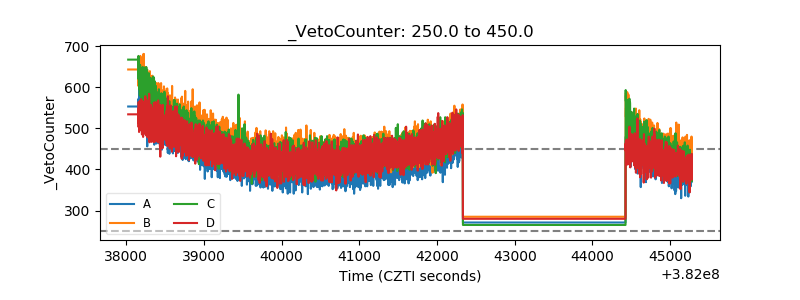 |