| Param | Original file | Final file |
|---|---|---|
| Filename | modeM0/AS1A05_108T02_9000004914_34422cztM0_level2.evt | modeM0/AS1A05_108T02_9000004914_34422cztM0_level2_quad_clean.evt |
| Size (bytes) | 494,277,120 | 67,138,560 |
| Size | 471.4 MB | 64.0 MB |
| Events in quadrant A | 2,817,663 | 434,351 |
| Events in quadrant B | 3,405,091 | 436,193 |
| Events in quadrant C | 3,039,201 | 424,120 |
| Events in quadrant D | 5,363,219 | 381,821 |
| Mode SS | |||
|---|---|---|---|
| Quadrant | BADHDUFLAG | Total packets | Discarded packets |
| A | 0 | 104 | 0 |
| B | 0 | 104 | 0 |
| C | 0 | 104 | 0 |
| D | 0 | 104 | 0 |
| Mode M9 | |||
|---|---|---|---|
| Quadrant | BADHDUFLAG | Total packets | Discarded packets |
| A | 0 | 32 | 0 |
| B | 0 | 32 | 0 |
| C | 0 | 32 | 0 |
| D | 0 | 33 | 0 |
| Mode M0 | |||
|---|---|---|---|
| Quadrant | BADHDUFLAG | Total packets | Discarded packets |
| A | 0 | 11539 | 3 |
| B | 0 | 13434 | 2 |
| C | 0 | 12334 | 2 |
| D | 0 | 19665 | 2 |
| Quadrant | Total seconds | Saturated seconds | Saturation percentage |
|---|---|---|---|
| A | 5081 | 37 | 0.728203% |
| B | 5081 | 119 | 2.342059% |
| C | 5081 | 39 | 0.767565% |
| D | 5081 | 451 | 8.876205% |
Noise dominated data is calculated using 1-second bins in cleaned event files. If a bin has >2000 counts, and if more than 50% of those come from <1% of pixels, then it is considered to be noise-dominated and hence unusable.
| Quadrant | # 1 sec bins | Bins with >0 counts | Bins with >2000 counts | High rate bins dominated by noise | Noise dominated (total time) | Noise dominated (detector-on time) | Marked lightcurve |
|---|---|---|---|---|---|---|---|
| A | 7175 | 5082 | 21 | 21 | 0.29% | 0.41% | 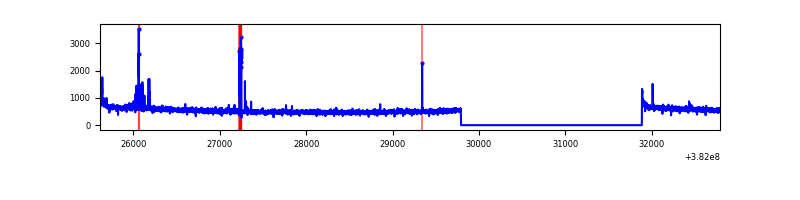 |
| B | 7175 | 5082 | 70 | 70 | 0.98% | 1.38% | 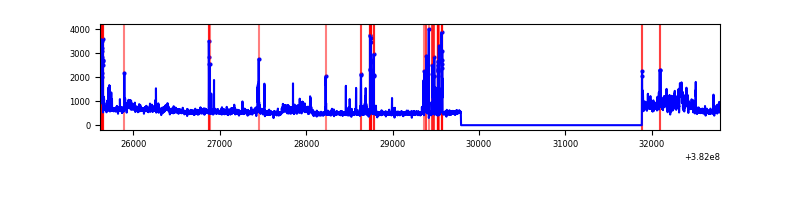 |
| C | 7175 | 5082 | 24 | 24 | 0.33% | 0.47% | 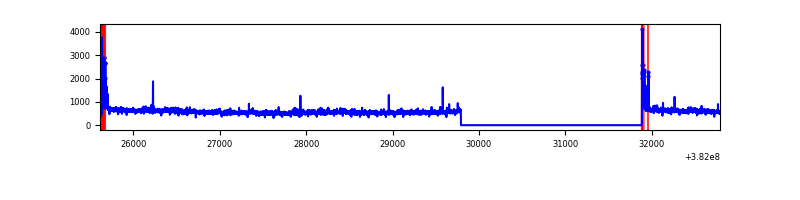 |
| D | 7175 | 5082 | 366 | 366 | 5.10% | 7.20% | 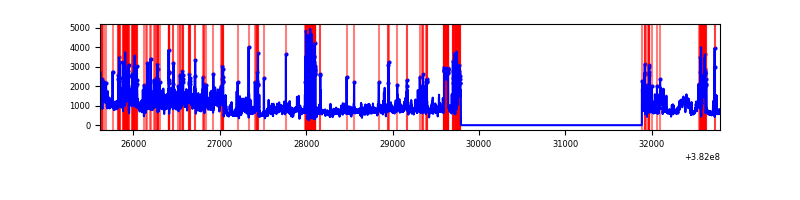 |
Top three noisy pixels from each quadrant. If the there are fewer than three noisy pixels in the level2.evt file, extra rows are filled as -1
| Pixel properties | Quadrant properties | ||||||
|---|---|---|---|---|---|---|---|
| Quadrant | DetID | PixID | Counts | Sigma | Mean | Median | Sigma |
| A | 9 | 143 | 97014 | 712.08 | 691 | 680 | 135.3 |
| A | 10 | 83 | 36613 | 265.61 | 691 | 680 | 135.3 |
| A | 13 | 6 | 13392 | 93.96 | 691 | 680 | 135.3 |
| B | 0 | 190 | 315865 | 2479.38 | 682 | 669 | 127.1 |
| B | 5 | 172 | 274071 | 2150.62 | 682 | 669 | 127.1 |
| B | 0 | 229 | 88996 | 694.79 | 682 | 669 | 127.1 |
| C | 15 | 214 | 215085 | 1432.37 | 659 | 665 | 149.7 |
| C | 0 | 10 | 120988 | 803.79 | 659 | 665 | 149.7 |
| C | 14 | 67 | 88613 | 587.51 | 659 | 665 | 149.7 |
| D | 8 | 195 | 1311092 | 8602.04 | 633 | 618 | 152.3 |
| D | 10 | 230 | 451915 | 2962.34 | 633 | 618 | 152.3 |
| D | 7 | 80 | 282774 | 1852.09 | 633 | 618 | 152.3 |
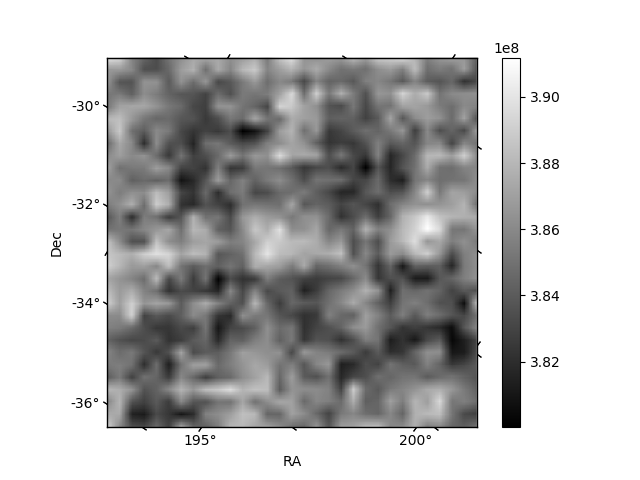
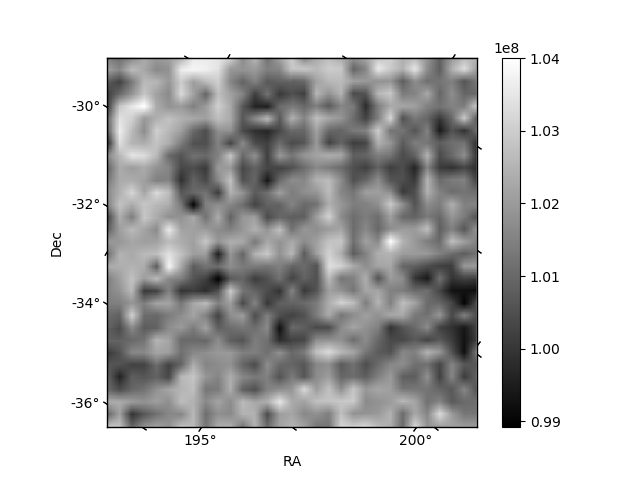
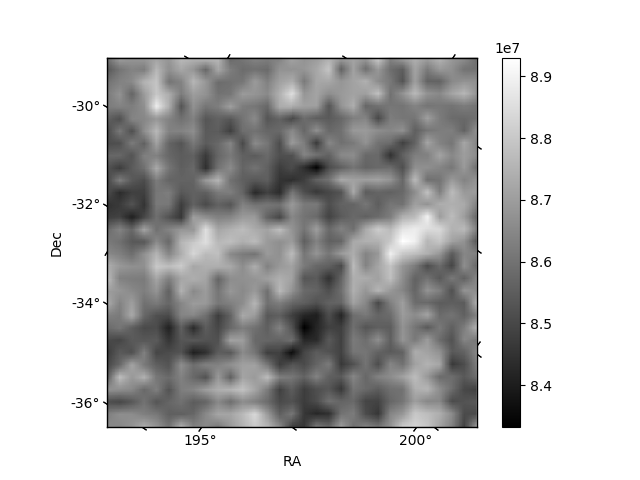
Histogram calculated using DETX and DETY for each event in the final _common_clean file
| Quadrant A | 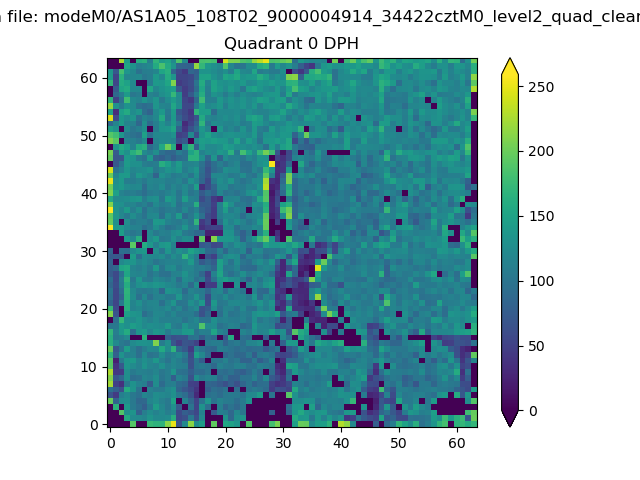 |
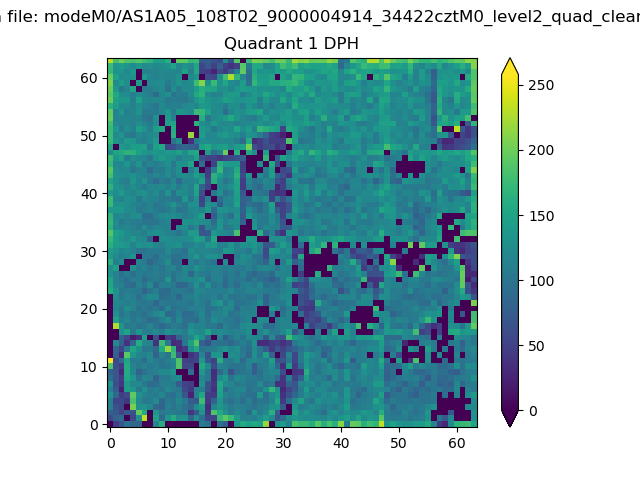 |
Quadrant B |
|---|---|---|---|
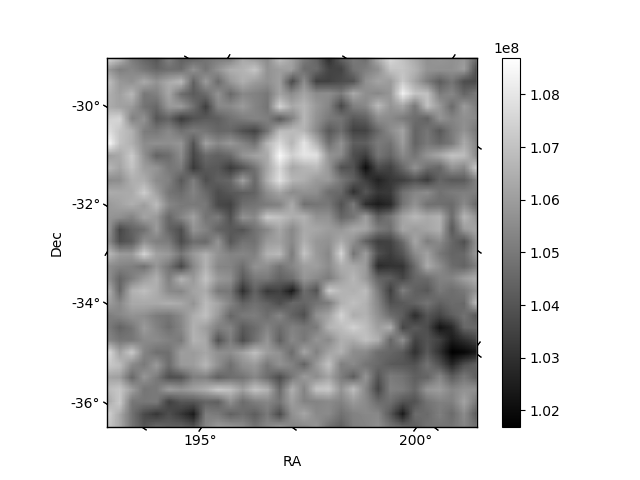
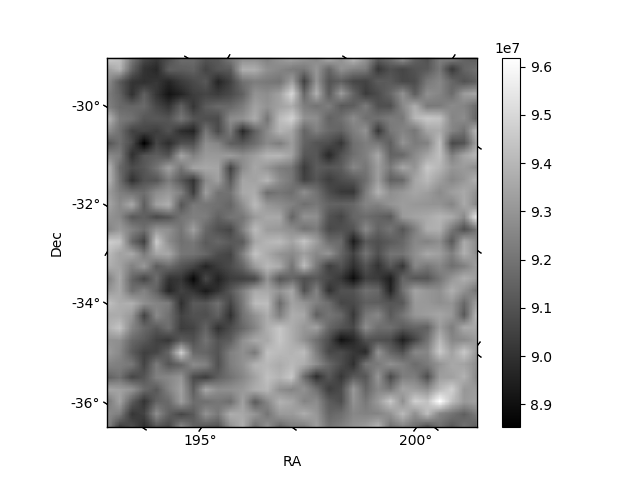
| Quadrant D | 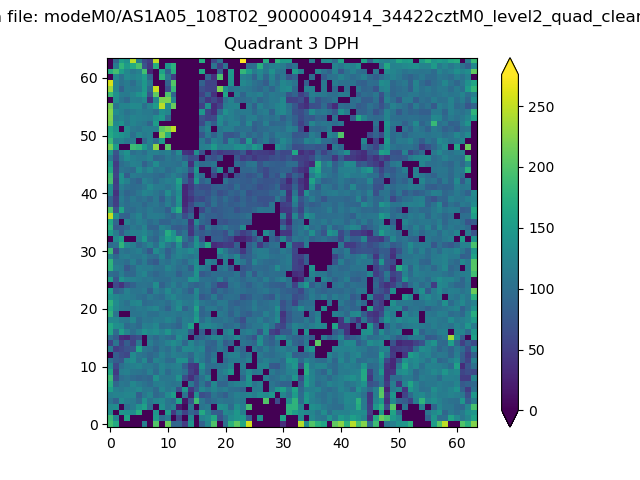 |
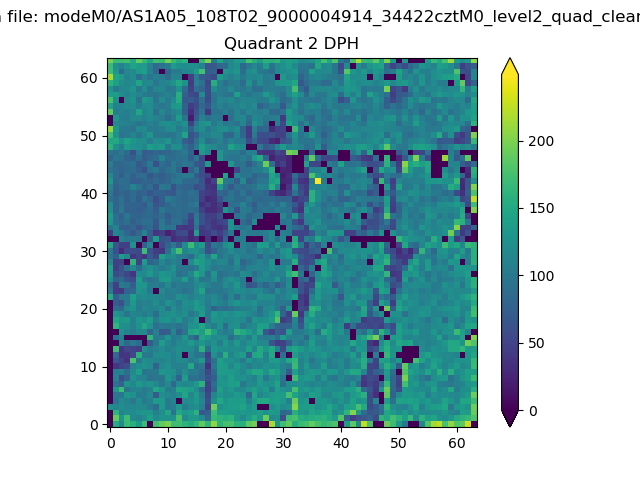 |
Quadrant C |
| Plot type | Count rate plots | Images |
|---|---|---|
| Comparison with Poisson distribution Blue bars denote a histogram of data divided into 1 sec bins. Red curve is a Poisson curve with rate = median count rate of data. |
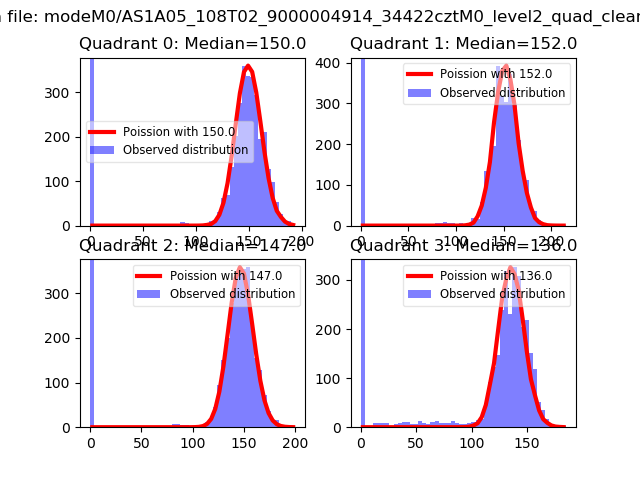 |
 |
| Quadrant-wise count rates Data is divided into 100 sec bins |
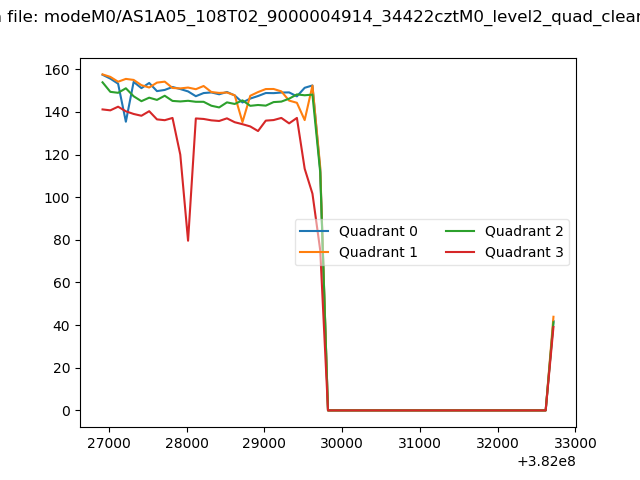 |
|
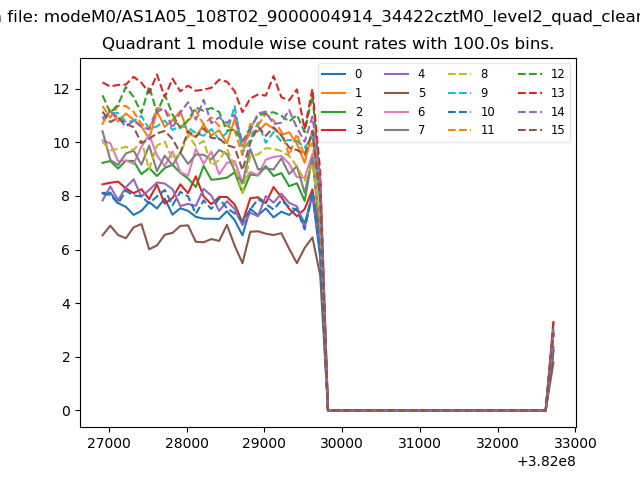
| Module-wise count rates for Quadrant A Data is divided into 100 sec bins |
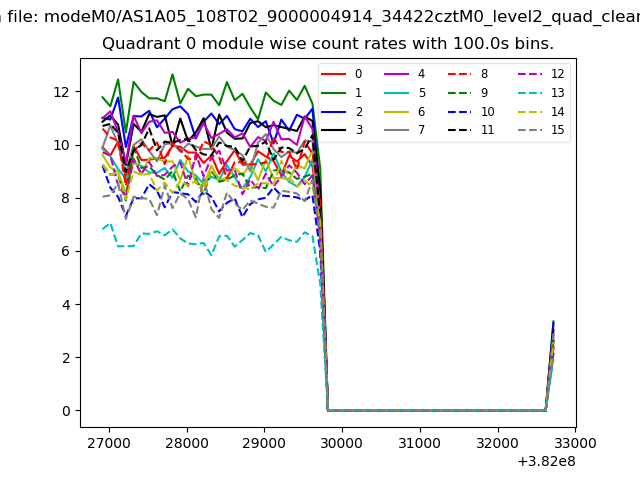 |
 |
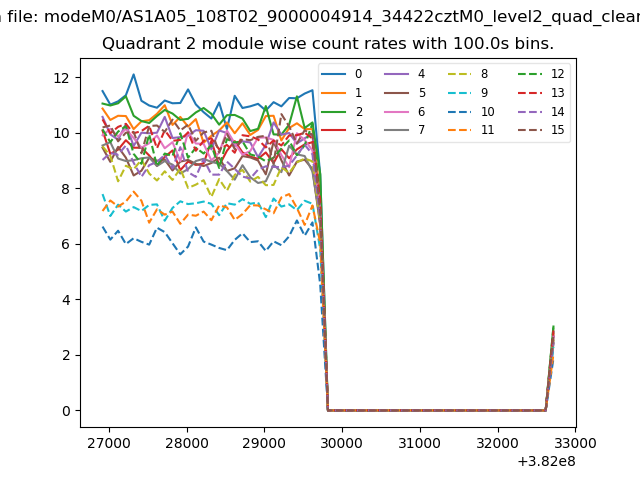
| Module-wise count rates for Quadrant B Data is divided into 100 sec bins |
 |
 |
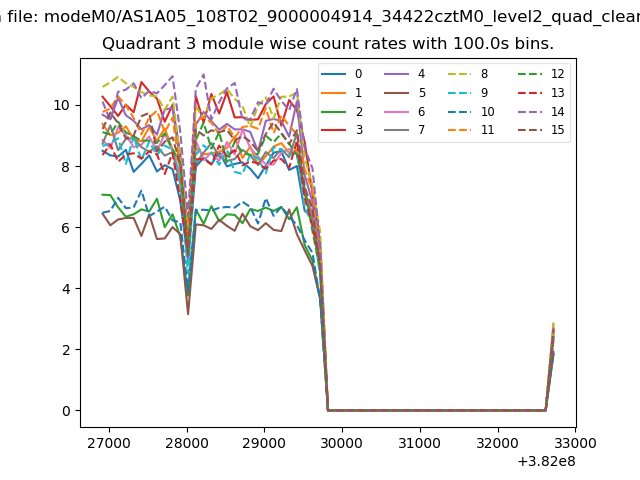
| Module-wise count rates for Quadrant C Data is divided into 100 sec bins |
 |
 |
| Module-wise count rates for Quadrant D Data is divided into 100 sec bins |
 |
 |
| Parameter | Plot |
|---|---|
| CZT HV Monitor | 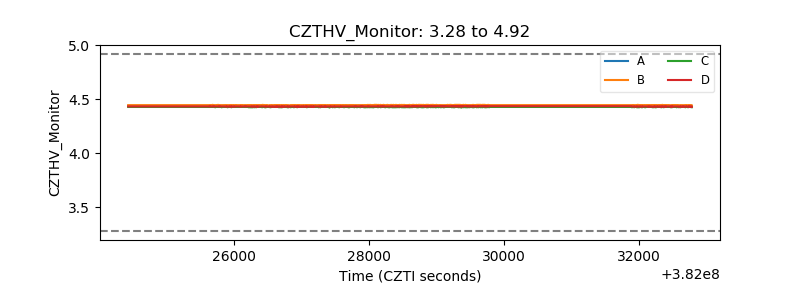 |
| D_VDD | 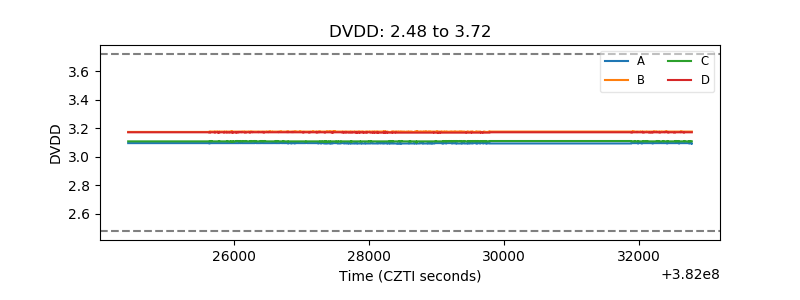 |
| Temperature 1 | 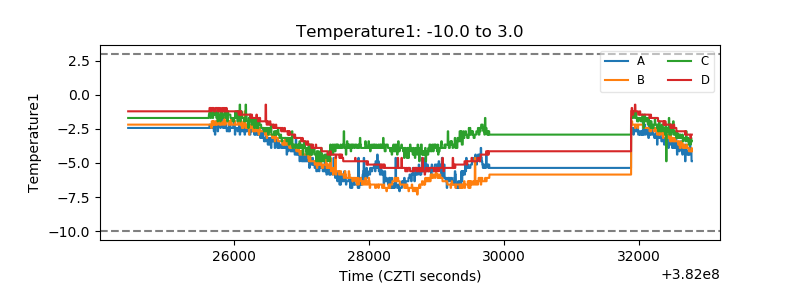 |
| Veto HV Monitor | 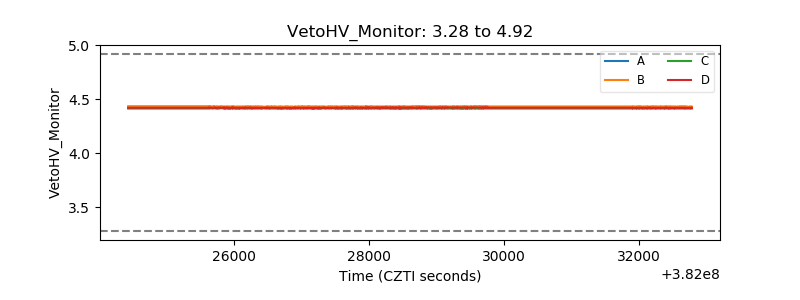 |
| Veto LLD | 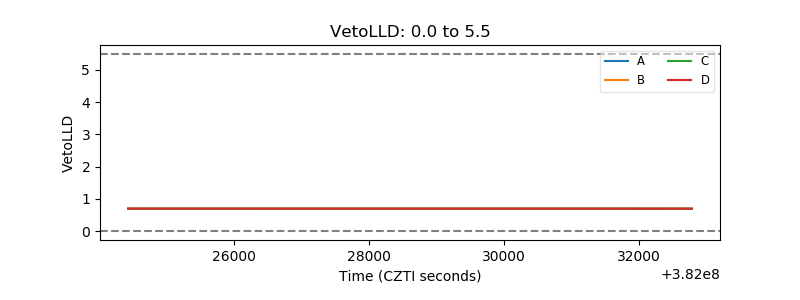 |
| Alpha Counter | 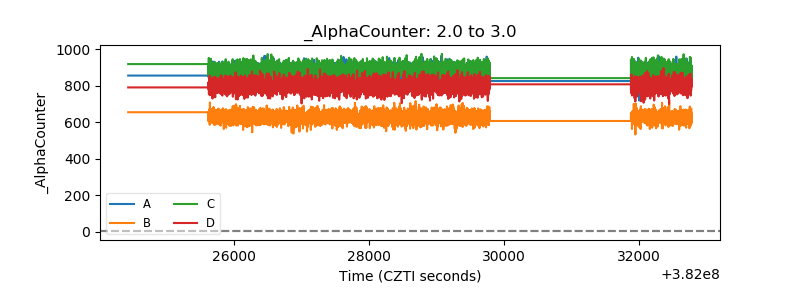 |
| _CPM_Rate | 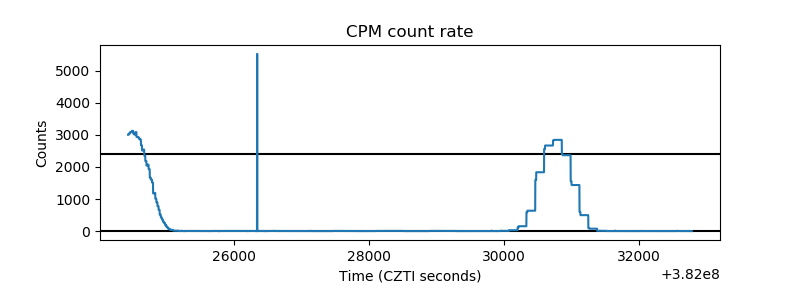 |
| CZT Counter | 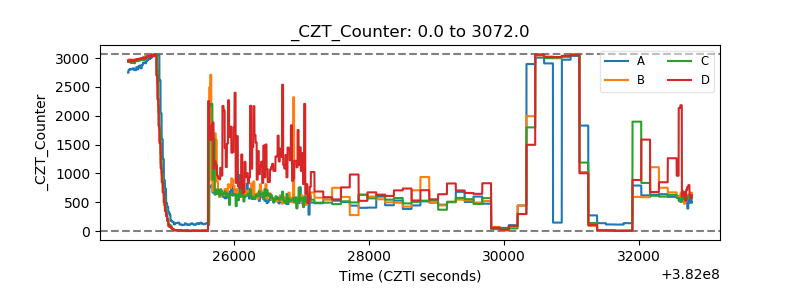 |
| +2.5 Volts monitor | 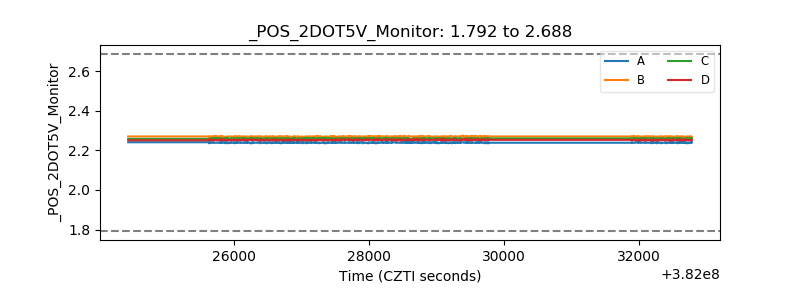 |
| +5 Volts monitor | 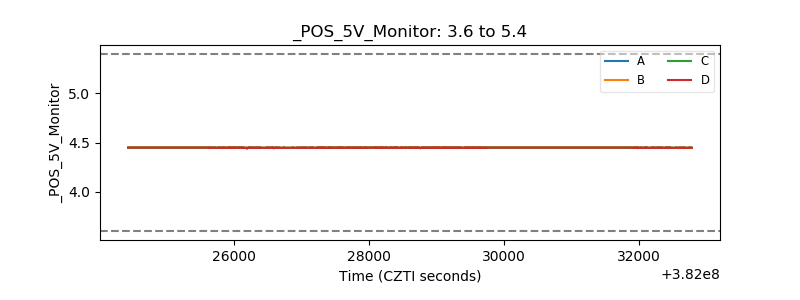 |
| _ROLL_ROT | 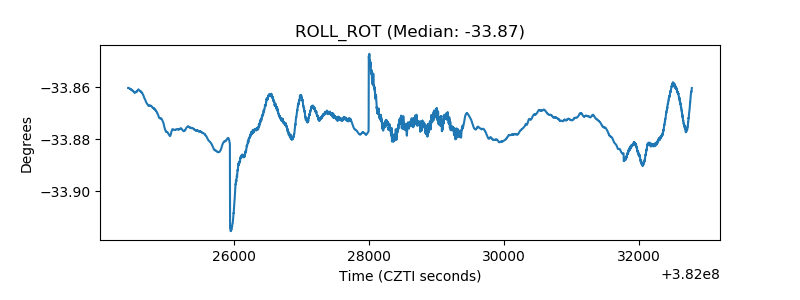 |
| _Roll_DEC | 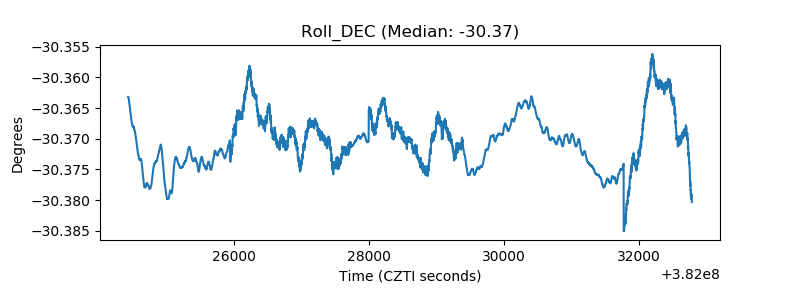 |
| _Roll_RA | 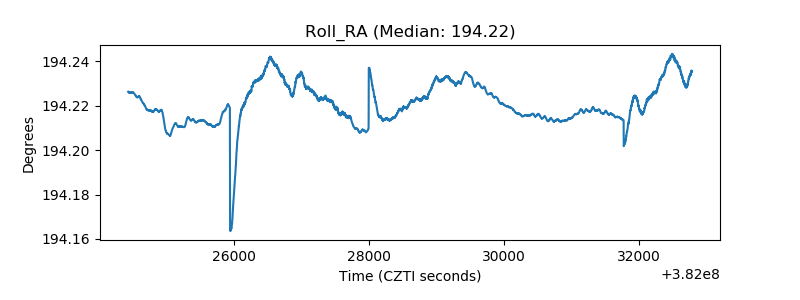 |
| Veto Counter | 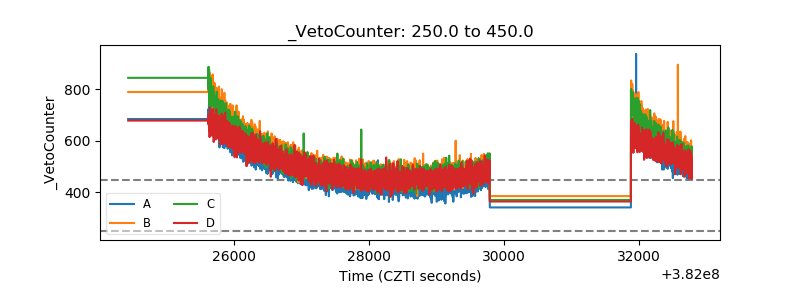 |