| Param | Original file | Final file |
|---|---|---|
| Filename | modeM0/AS1A05_108T02_9000004914_34419cztM0_level2.evt | modeM0/AS1A05_108T02_9000004914_34419cztM0_level2_quad_clean.evt |
| Size (bytes) | 432,927,360 | 52,162,560 |
| Size | 412.9 MB | 49.7 MB |
| Events in quadrant A | 2,758,881 | 307,504 |
| Events in quadrant B | 3,108,974 | 307,862 |
| Events in quadrant C | 2,865,699 | 306,087 |
| Events in quadrant D | 4,018,878 | 287,405 |
| Mode SS | |||
|---|---|---|---|
| Quadrant | BADHDUFLAG | Total packets | Discarded packets |
| A | 0 | 108 | 0 |
| B | 0 | 108 | 0 |
| C | 0 | 108 | 0 |
| D | 0 | 108 | 0 |
| Mode M9 | |||
|---|---|---|---|
| Quadrant | BADHDUFLAG | Total packets | Discarded packets |
| A | 0 | 19 | 0 |
| B | 0 | 19 | 0 |
| C | 0 | 19 | 0 |
| D | 0 | 20 | 0 |
| Mode M0 | |||
|---|---|---|---|
| Quadrant | BADHDUFLAG | Total packets | Discarded packets |
| A | 0 | 11534 | 3 |
| B | 0 | 12514 | 2 |
| C | 0 | 11596 | 2 |
| D | 0 | 15719 | 2 |
| Quadrant | Total seconds | Saturated seconds | Saturation percentage |
|---|---|---|---|
| A | 5284 | 59 | 1.116578% |
| B | 5284 | 154 | 2.914459% |
| C | 5284 | 11 | 0.208176% |
| D | 5284 | 70 | 1.324754% |
Noise dominated data is calculated using 1-second bins in cleaned event files. If a bin has >2000 counts, and if more than 50% of those come from <1% of pixels, then it is considered to be noise-dominated and hence unusable.
| Quadrant | # 1 sec bins | Bins with >0 counts | Bins with >2000 counts | High rate bins dominated by noise | Noise dominated (total time) | Noise dominated (detector-on time) | Marked lightcurve |
|---|---|---|---|---|---|---|---|
| A | 7047 | 5285 | 36 | 36 | 0.51% | 0.68% | 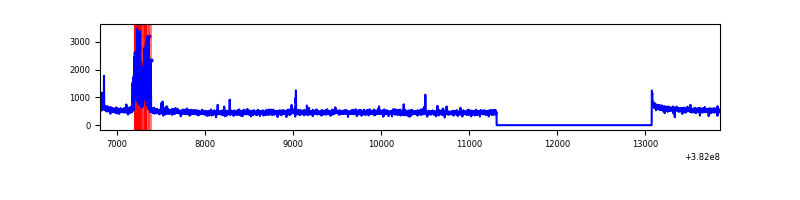 |
| B | 7047 | 5285 | 100 | 100 | 1.42% | 1.89% | 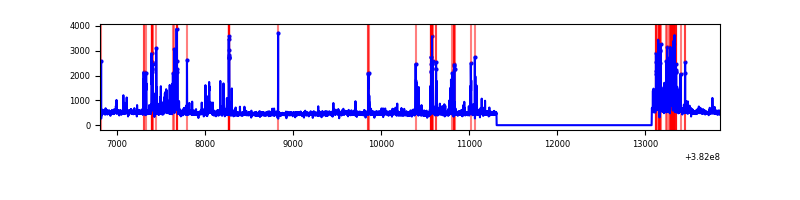 |
| C | 7047 | 5285 | 7 | 7 | 0.10% | 0.13% | 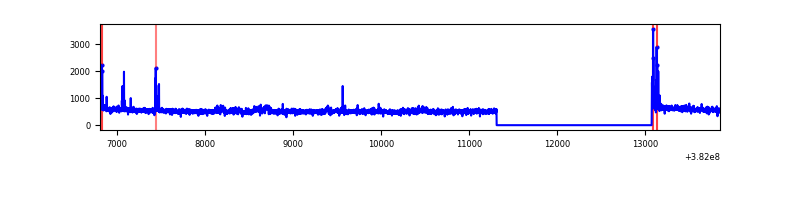 |
| D | 7047 | 5285 | 57 | 57 | 0.81% | 1.08% | 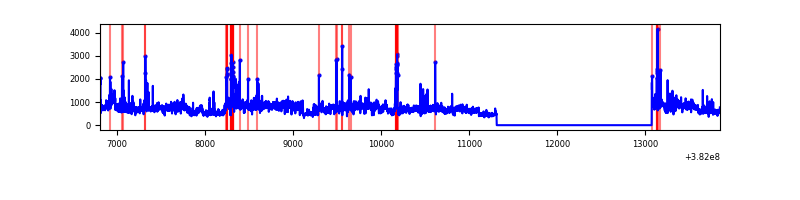 |
Top three noisy pixels from each quadrant. If the there are fewer than three noisy pixels in the level2.evt file, extra rows are filled as -1
| Pixel properties | Quadrant properties | ||||||
|---|---|---|---|---|---|---|---|
| Quadrant | DetID | PixID | Counts | Sigma | Mean | Median | Sigma |
| A | 9 | 143 | 219808 | 1719.97 | 644 | 633 | 127.4 |
| A | 10 | 83 | 34211 | 263.5 | 644 | 633 | 127.4 |
| A | 13 | 254 | 9831 | 72.18 | 644 | 633 | 127.4 |
| B | 5 | 172 | 411958 | 3401.01 | 632 | 615 | 120.9 |
| B | 0 | 229 | 100043 | 822.08 | 632 | 615 | 120.9 |
| B | 0 | 190 | 47582 | 388.33 | 632 | 615 | 120.9 |
| C | 15 | 214 | 224641 | 1548.59 | 630 | 635 | 144.7 |
| C | 14 | 67 | 97946 | 672.73 | 630 | 635 | 144.7 |
| C | 0 | 10 | 50146 | 342.28 | 630 | 635 | 144.7 |
| D | 8 | 195 | 1143766 | 7359.59 | 629 | 613 | 155.3 |
| D | 2 | 250 | 67702 | 431.92 | 629 | 613 | 155.3 |
| D | 13 | 249 | 57547 | 366.54 | 629 | 613 | 155.3 |
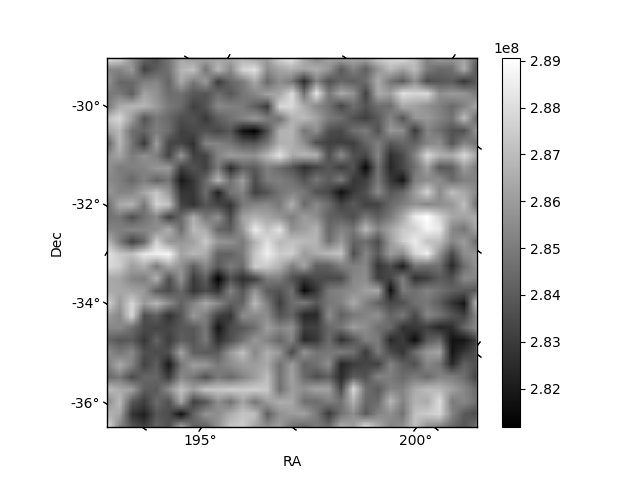
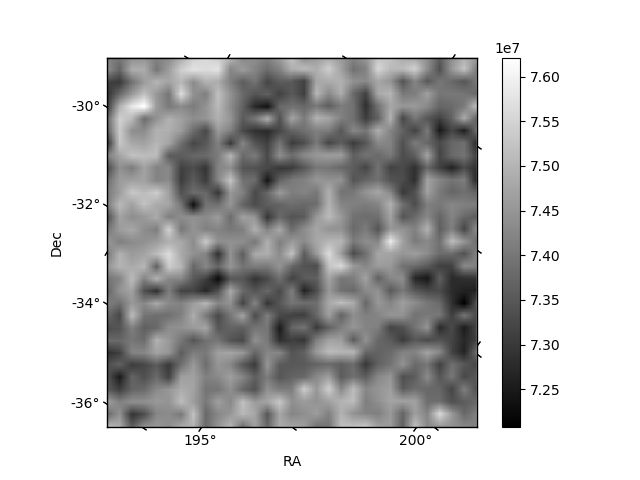
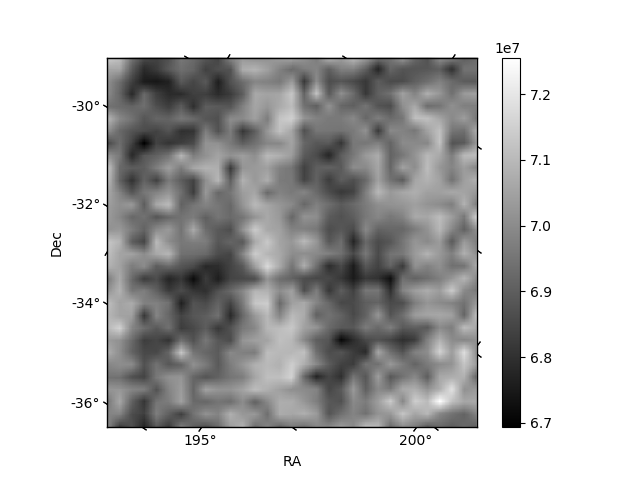
Histogram calculated using DETX and DETY for each event in the final _common_clean file
| Quadrant A | 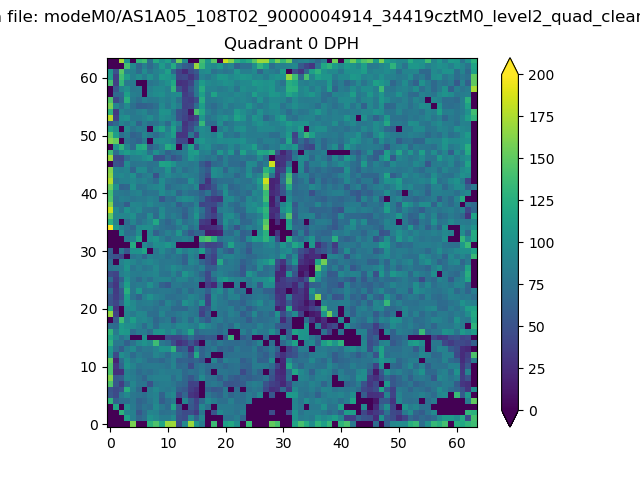 |
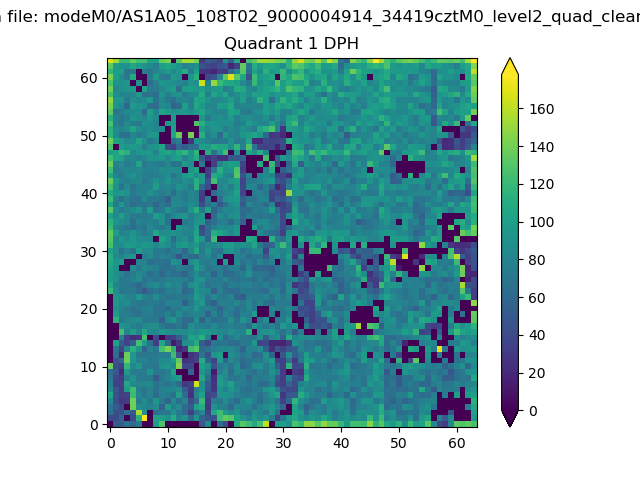 |
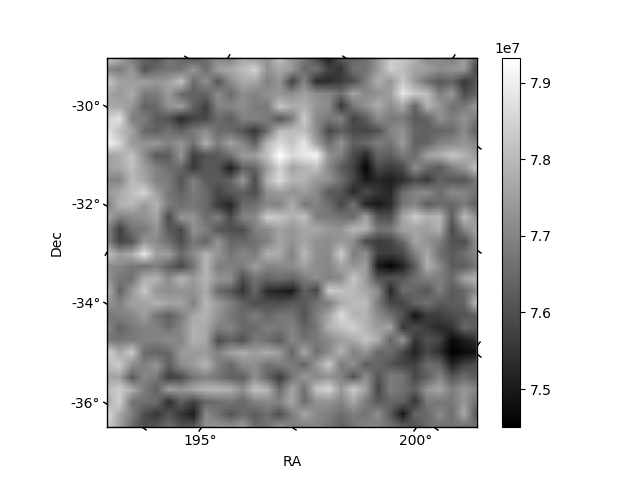
Quadrant B |
|---|---|---|---|
| Quadrant D | 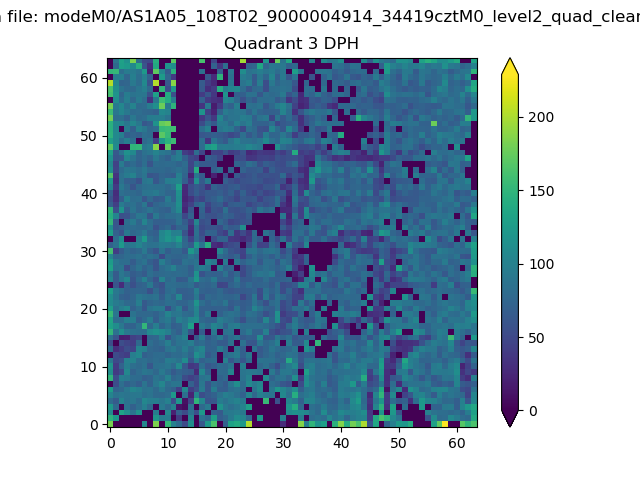 |
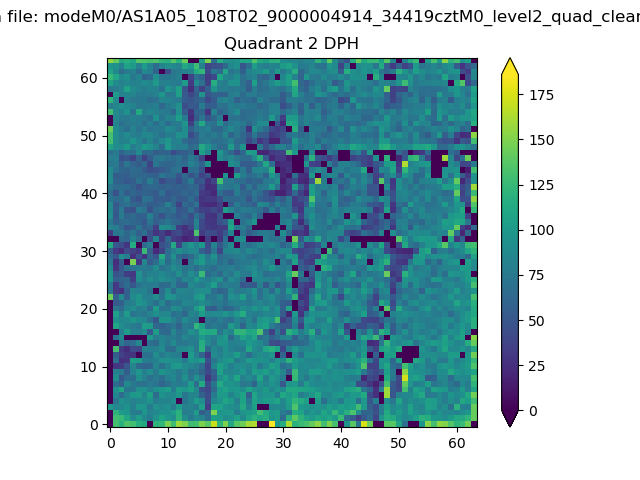 |
Quadrant C |
| Plot type | Count rate plots | Images |
|---|---|---|
| Comparison with Poisson distribution Blue bars denote a histogram of data divided into 1 sec bins. Red curve is a Poisson curve with rate = median count rate of data. |
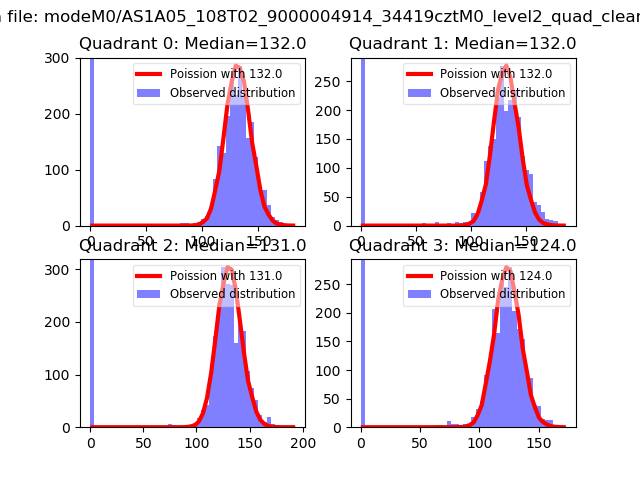 |
 |
| Quadrant-wise count rates Data is divided into 100 sec bins |
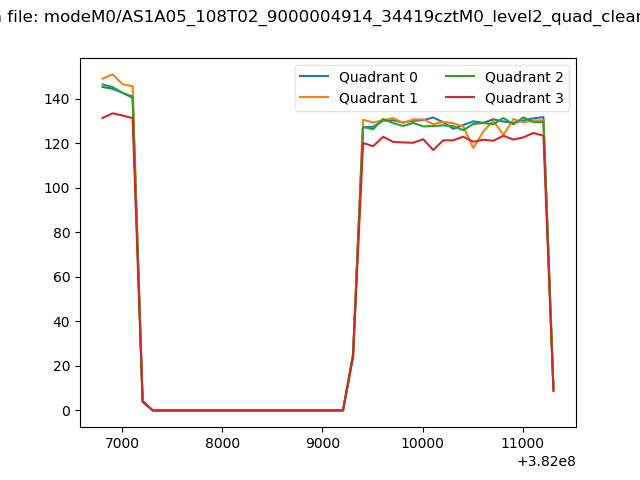 |
|
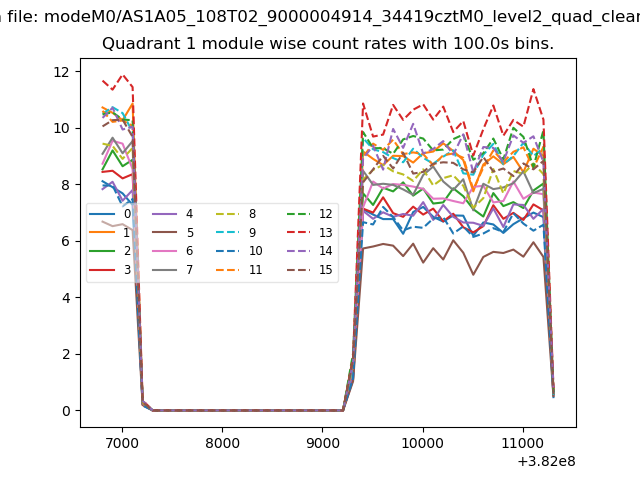
| Module-wise count rates for Quadrant A Data is divided into 100 sec bins |
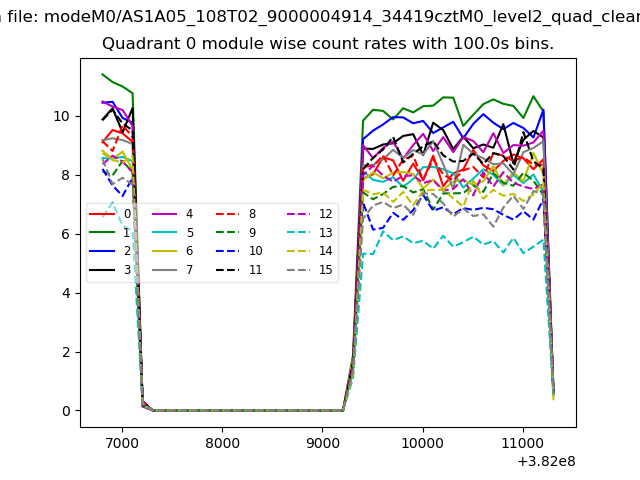 |
 |
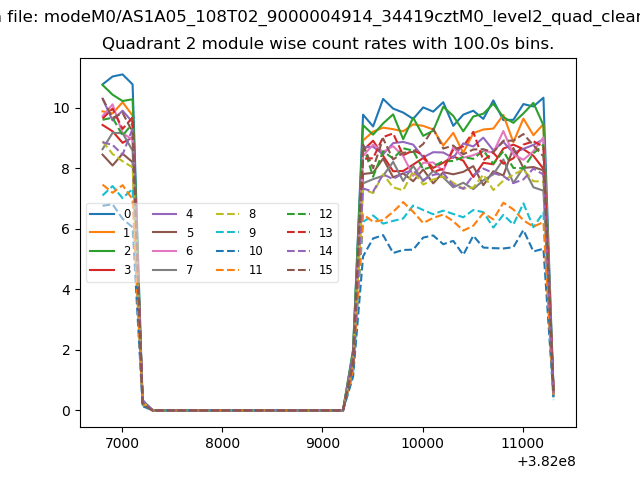
| Module-wise count rates for Quadrant B Data is divided into 100 sec bins |
 |
 |
| Module-wise count rates for Quadrant C Data is divided into 100 sec bins |
 |
 |
| Module-wise count rates for Quadrant D Data is divided into 100 sec bins |
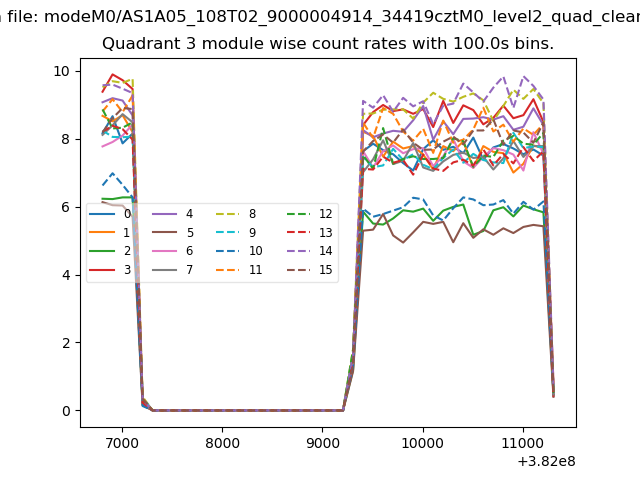 |
 |
| Parameter | Plot |
|---|---|
| CZT HV Monitor | 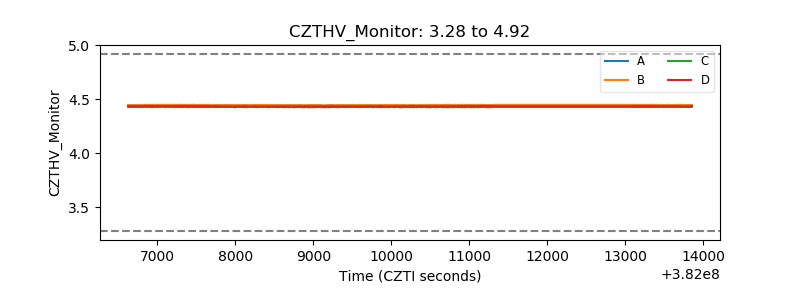 |
| D_VDD | 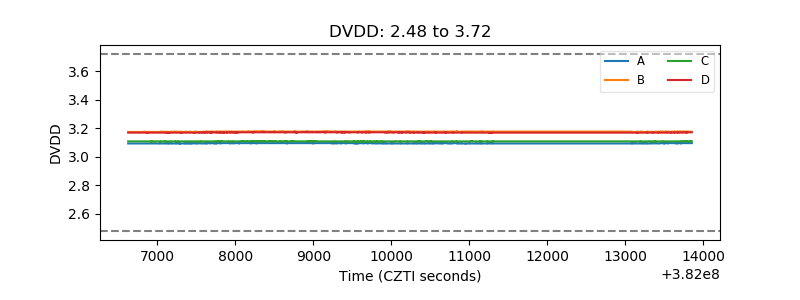 |
| Temperature 1 | 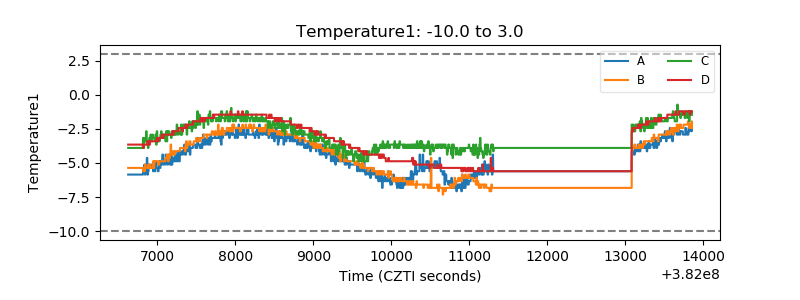 |
| Veto HV Monitor | 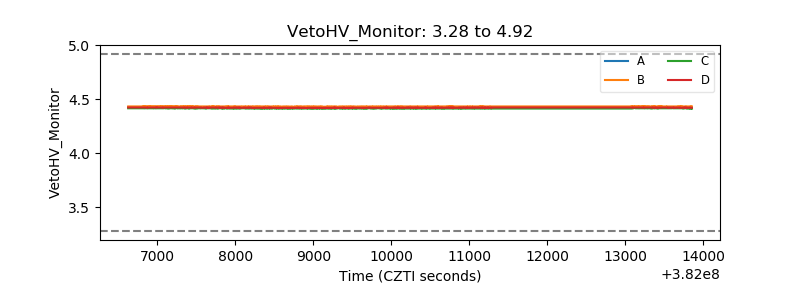 |
| Veto LLD | 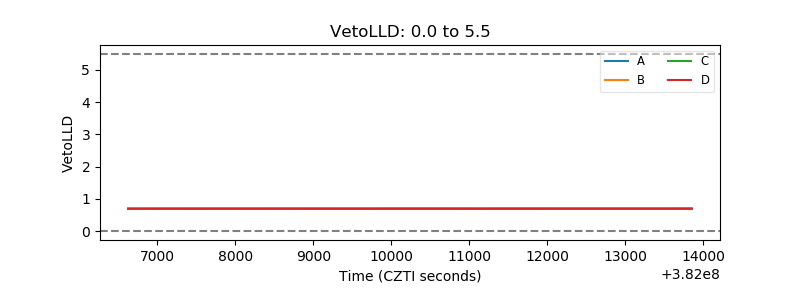 |
| Alpha Counter | 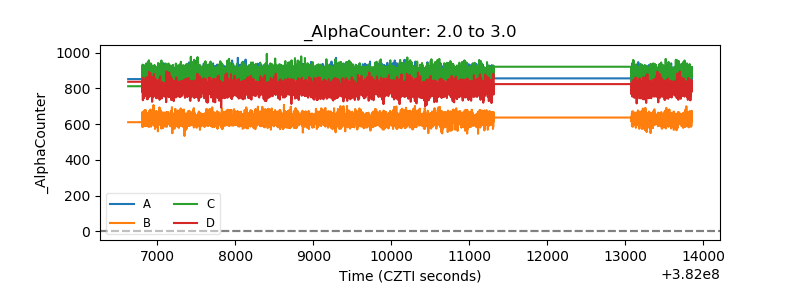 |
| _CPM_Rate | 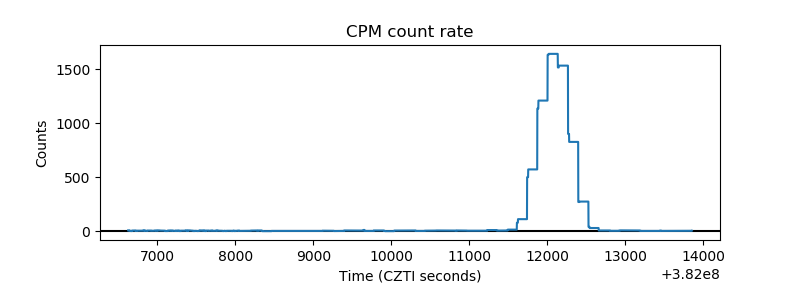 |
| CZT Counter | 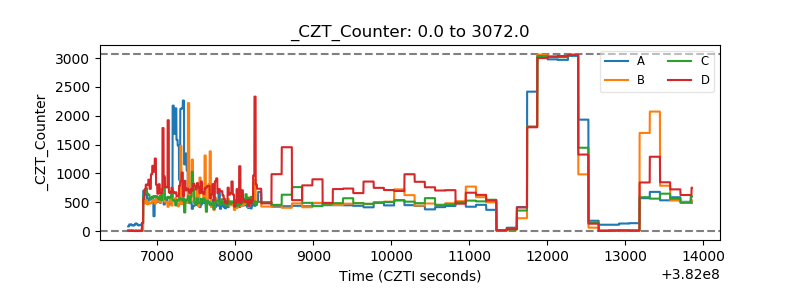 |
| +2.5 Volts monitor | 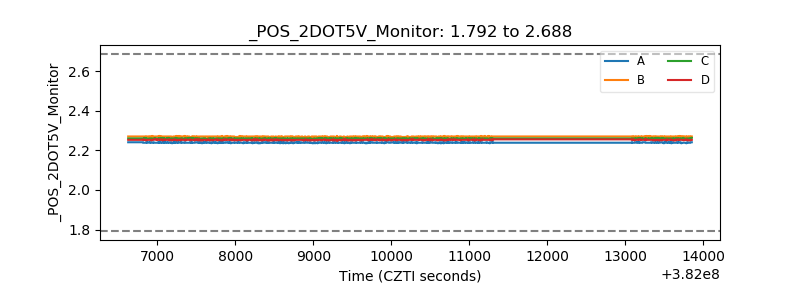 |
| +5 Volts monitor | 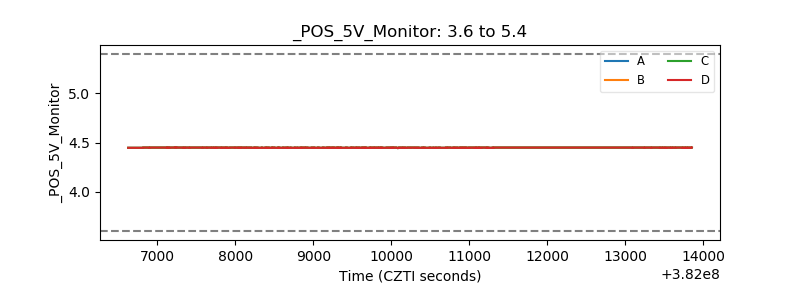 |
| _ROLL_ROT | 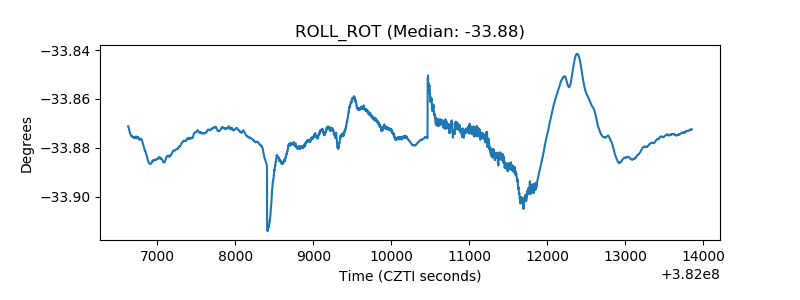 |
| _Roll_DEC | 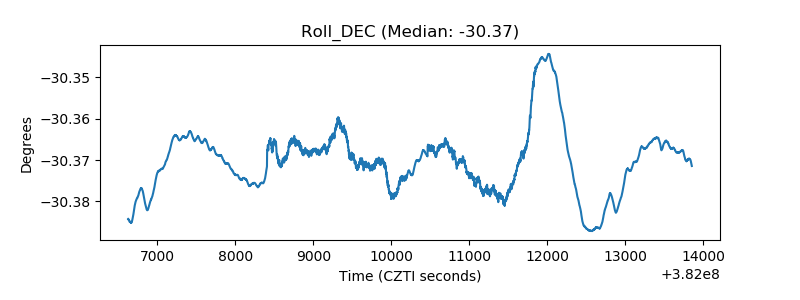 |
| _Roll_RA | 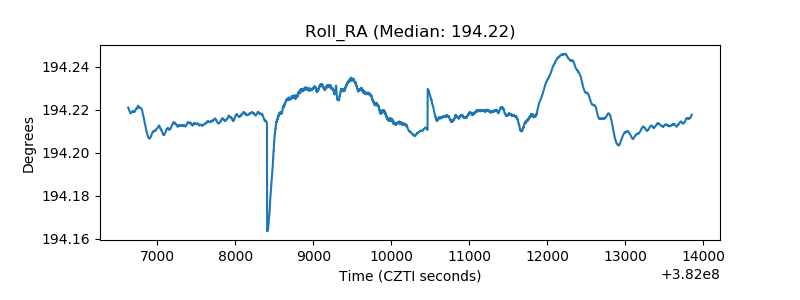 |
| Veto Counter | 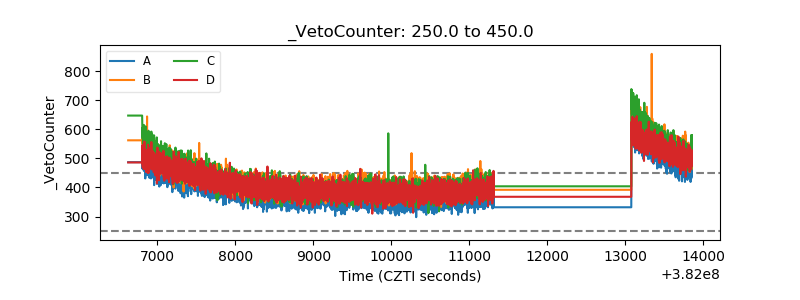 |