| Param | Original file | Final file |
|---|---|---|
| Filename | modeM0/AS1A05_108T02_9000004914_34416cztM0_level2.evt | modeM0/AS1A05_108T02_9000004914_34416cztM0_level2_quad_clean.evt |
| Size (bytes) | 1,354,645,440 | 169,096,320 |
| Size | 1.3 GB | 161.3 MB |
| Events in quadrant A | 7,119,962 | 1,046,039 |
| Events in quadrant B | 9,150,578 | 1,044,048 |
| Events in quadrant C | 10,070,248 | 1,033,180 |
| Events in quadrant D | 13,673,695 | 961,902 |
| Mode SS | |||
|---|---|---|---|
| Quadrant | BADHDUFLAG | Total packets | Discarded packets |
| A | 0 | 308 | 0 |
| B | 0 | 308 | 0 |
| C | 0 | 308 | 0 |
| D | 0 | 308 | 0 |
| Mode M9 | |||
|---|---|---|---|
| Quadrant | BADHDUFLAG | Total packets | Discarded packets |
| A | 0 | 55 | 0 |
| B | 0 | 55 | 0 |
| C | 0 | 55 | 0 |
| D | 0 | 55 | 0 |
| Mode M0 | |||
|---|---|---|---|
| Quadrant | BADHDUFLAG | Total packets | Discarded packets |
| A | 0 | 30844 | 4 |
| B | 0 | 36746 | 3 |
| C | 0 | 38970 | 3 |
| D | 0 | 51295 | 3 |
| Quadrant | Total seconds | Saturated seconds | Saturation percentage |
|---|---|---|---|
| A | 15005 | 68 | 0.453182% |
| B | 15005 | 566 | 3.772076% |
| C | 15005 | 515 | 3.432189% |
| D | 15005 | 1378 | 9.183605% |
Noise dominated data is calculated using 1-second bins in cleaned event files. If a bin has >2000 counts, and if more than 50% of those come from <1% of pixels, then it is considered to be noise-dominated and hence unusable.
| Quadrant | # 1 sec bins | Bins with >0 counts | Bins with >2000 counts | High rate bins dominated by noise | Noise dominated (total time) | Noise dominated (detector-on time) | Marked lightcurve |
|---|---|---|---|---|---|---|---|
| A | 20464 | 15009 | 48 | 48 | 0.23% | 0.32% | 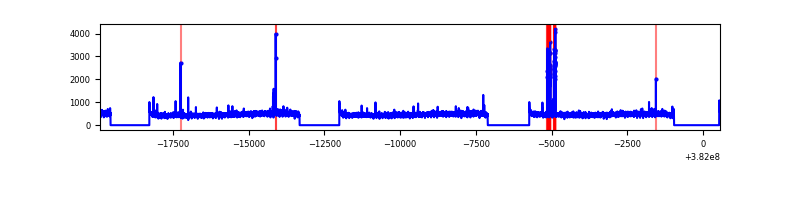 |
| B | 20464 | 15009 | 377 | 377 | 1.84% | 2.51% | 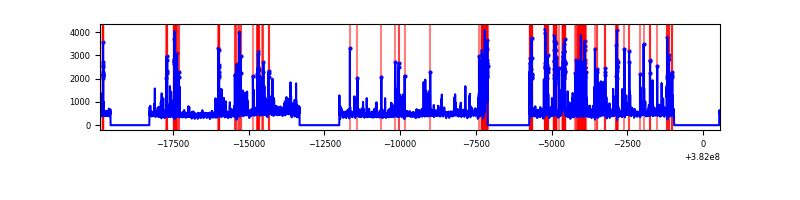 |
| C | 20464 | 15009 | 440 | 440 | 2.15% | 2.93% | 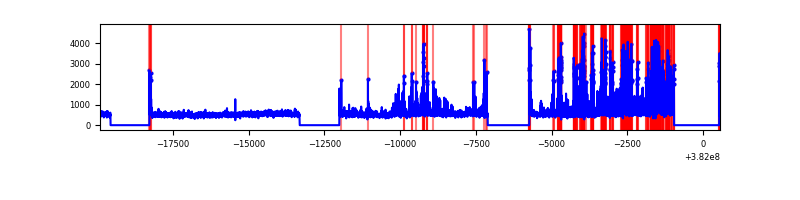 |
| D | 20464 | 15009 | 1072 | 1072 | 5.24% | 7.14% | 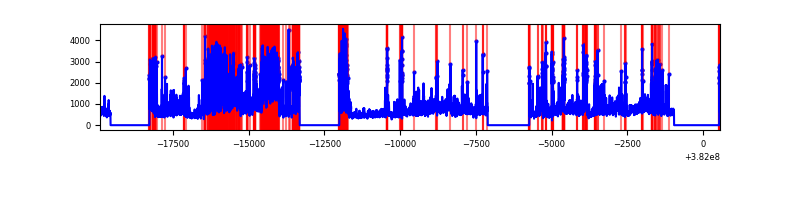 |
Top three noisy pixels from each quadrant. If the there are fewer than three noisy pixels in the level2.evt file, extra rows are filled as -1
| Pixel properties | Quadrant properties | ||||||
|---|---|---|---|---|---|---|---|
| Quadrant | DetID | PixID | Counts | Sigma | Mean | Median | Sigma |
| A | 9 | 143 | 201937 | 569.8 | 1761 | 1724 | 351.4 |
| A | 10 | 83 | 66527 | 184.43 | 1761 | 1724 | 351.4 |
| A | 13 | 254 | 28668 | 76.68 | 1761 | 1724 | 351.4 |
| B | 5 | 172 | 1355479 | 4057.7 | 1735 | 1690 | 333.6 |
| B | 0 | 229 | 373197 | 1113.51 | 1735 | 1690 | 333.6 |
| B | 4 | 171 | 207407 | 616.59 | 1735 | 1690 | 333.6 |
| C | 4 | 254 | 2257968 | 5736.19 | 1704 | 1717 | 393.3 |
| C | 15 | 214 | 615077 | 1559.38 | 1704 | 1717 | 393.3 |
| C | 14 | 67 | 351753 | 889.92 | 1704 | 1717 | 393.3 |
| D | 2 | 249 | 2231824 | 5467.02 | 1663 | 1616 | 407.9 |
| D | 8 | 195 | 1872831 | 4587.01 | 1663 | 1616 | 407.9 |
| D | 1 | 47 | 909453 | 2225.43 | 1663 | 1616 | 407.9 |
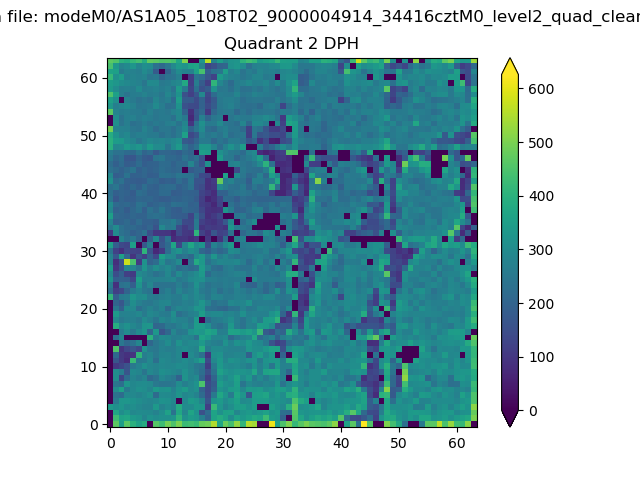
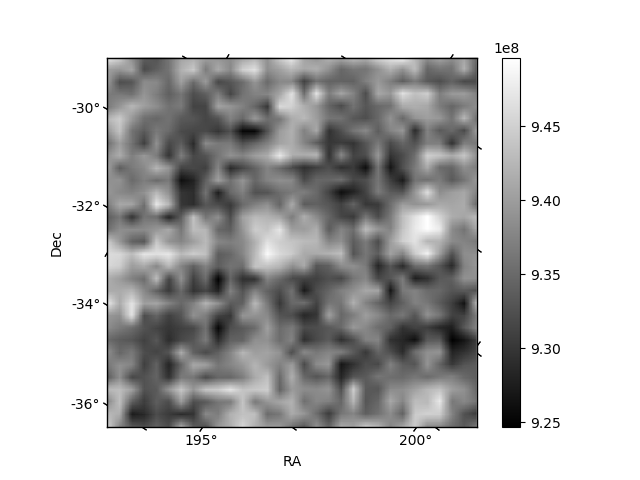
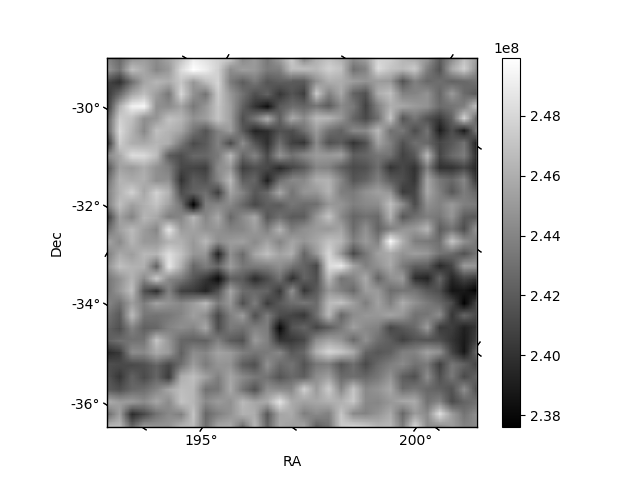
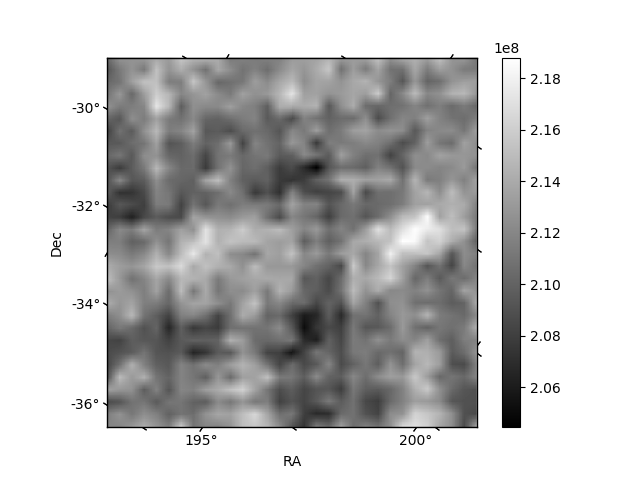
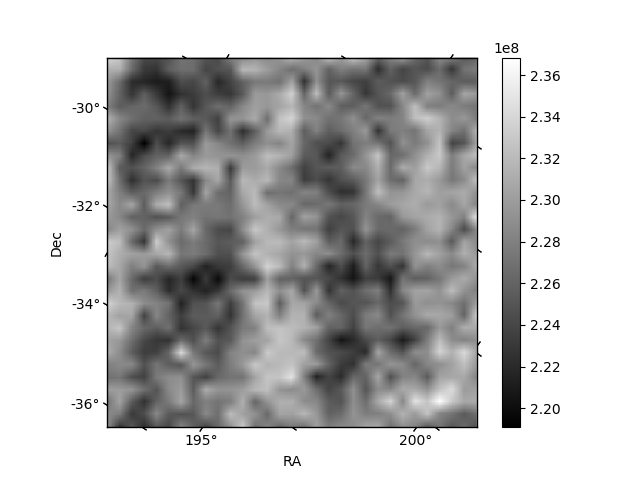
Histogram calculated using DETX and DETY for each event in the final _common_clean file
| Quadrant A | 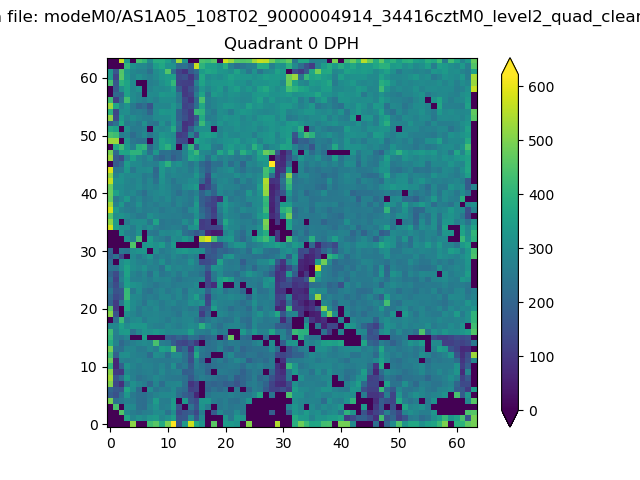 |
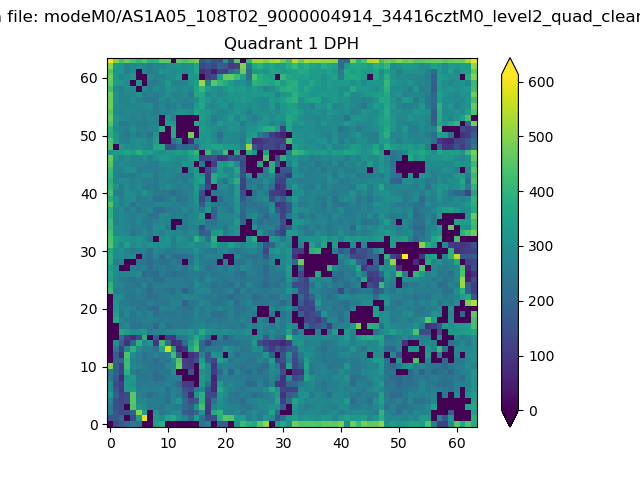 |
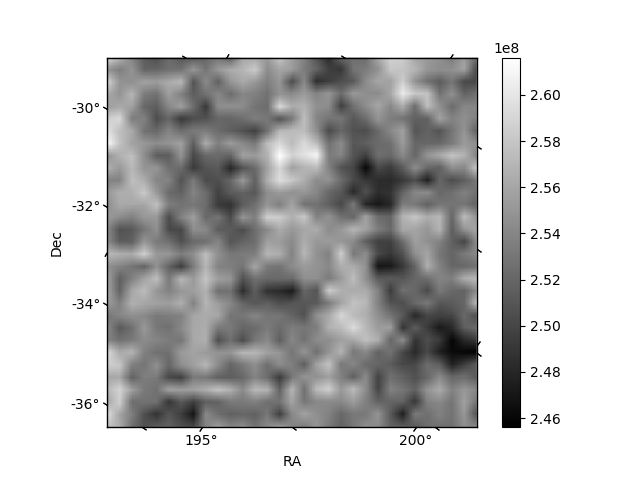
Quadrant B |
|---|---|---|---|
| Quadrant D | 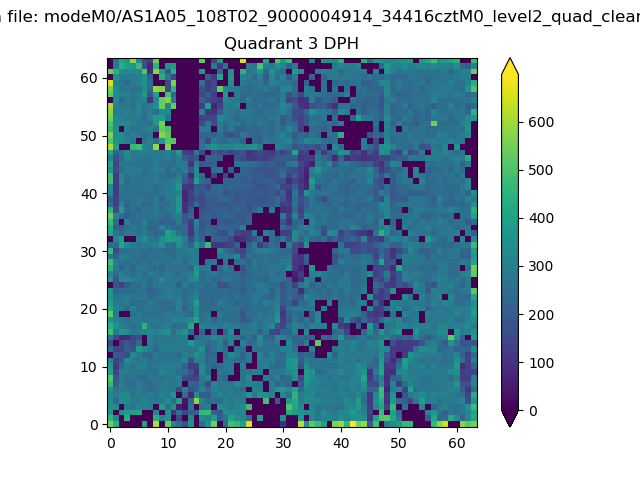 |
 |
Quadrant C |
| Plot type | Count rate plots | Images |
|---|---|---|
| Comparison with Poisson distribution Blue bars denote a histogram of data divided into 1 sec bins. Red curve is a Poisson curve with rate = median count rate of data. |
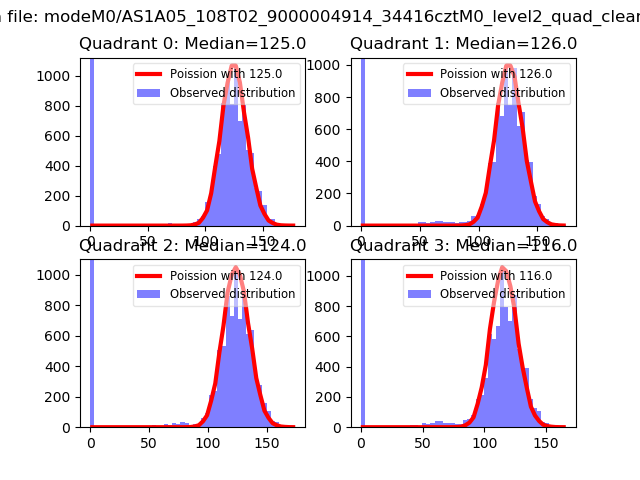 |
 |
| Quadrant-wise count rates Data is divided into 100 sec bins |
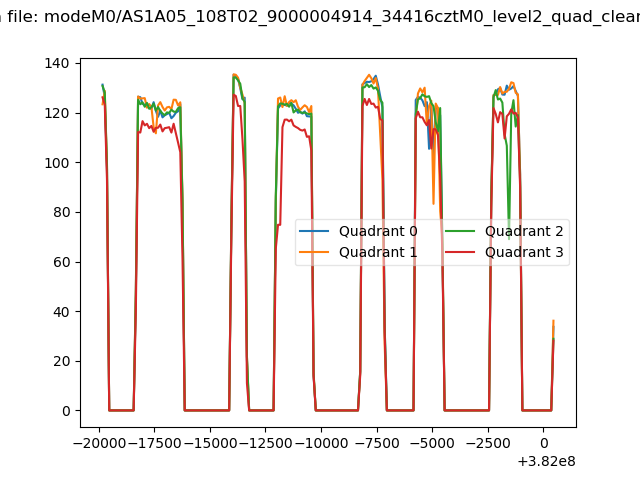 |
|
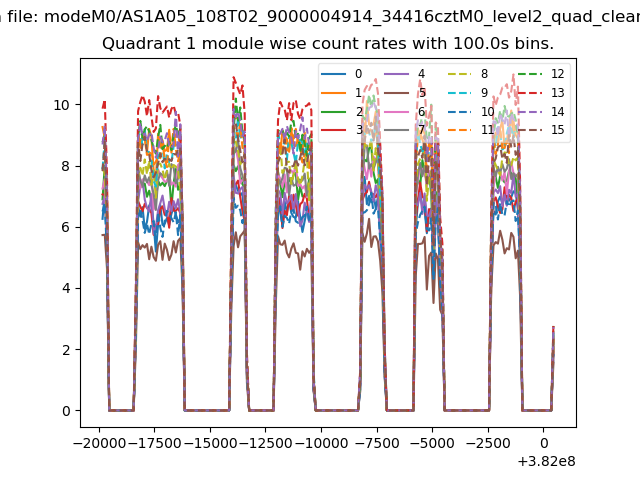
| Module-wise count rates for Quadrant A Data is divided into 100 sec bins |
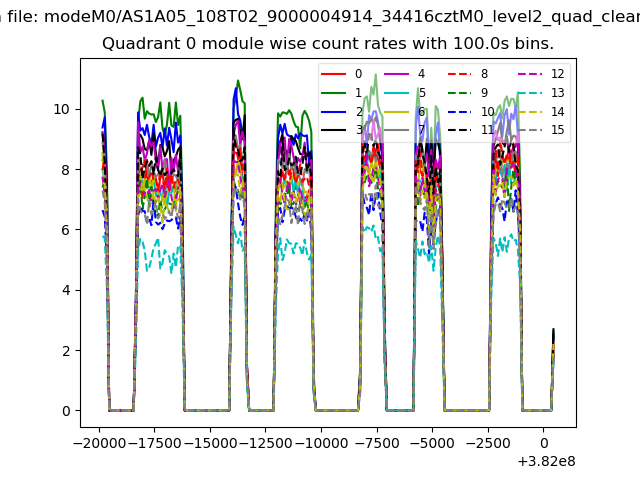 |
 |
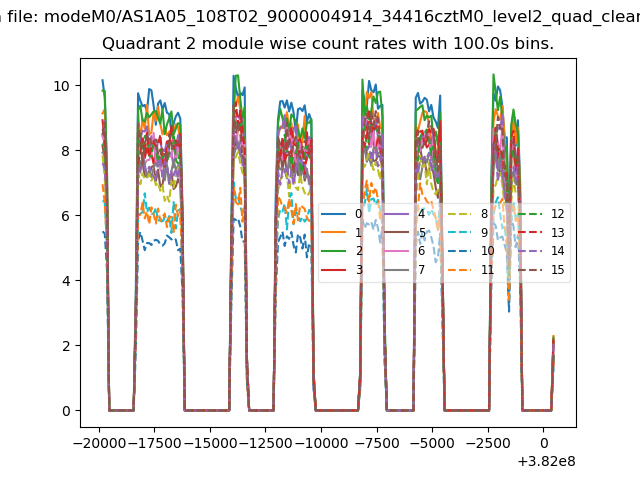
| Module-wise count rates for Quadrant B Data is divided into 100 sec bins |
 |
 |
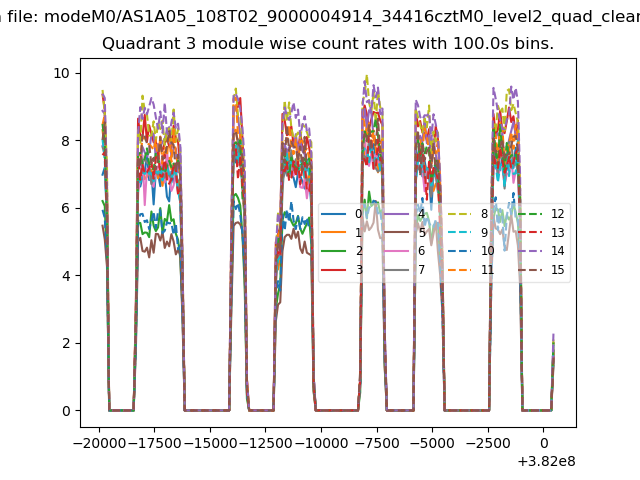
| Module-wise count rates for Quadrant C Data is divided into 100 sec bins |
 |
 |
| Module-wise count rates for Quadrant D Data is divided into 100 sec bins |
 |
 |
| Parameter | Plot |
|---|---|
| CZT HV Monitor | 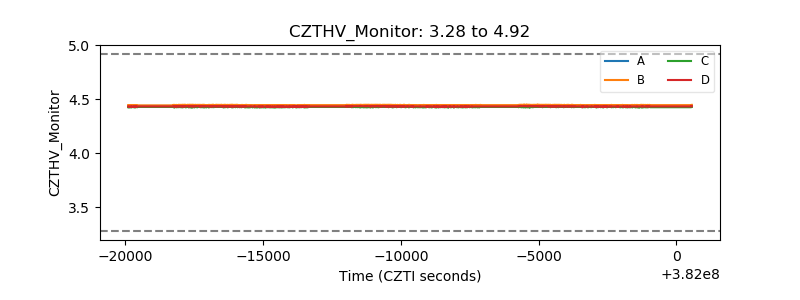 |
| D_VDD | 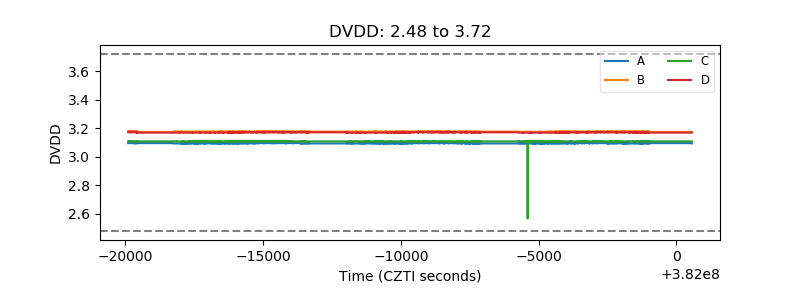 |
| Temperature 1 | 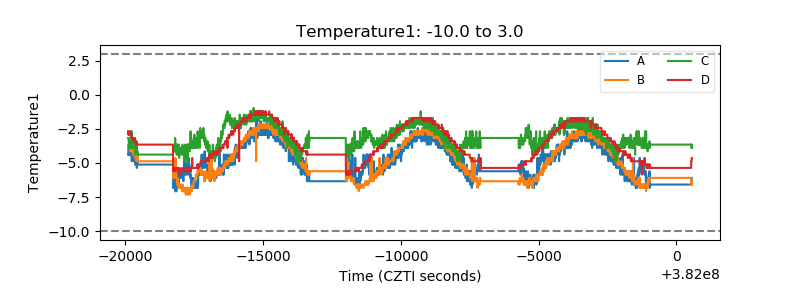 |
| Veto HV Monitor | 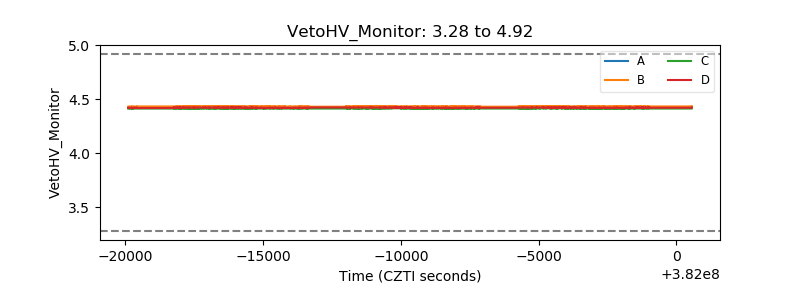 |
| Veto LLD | 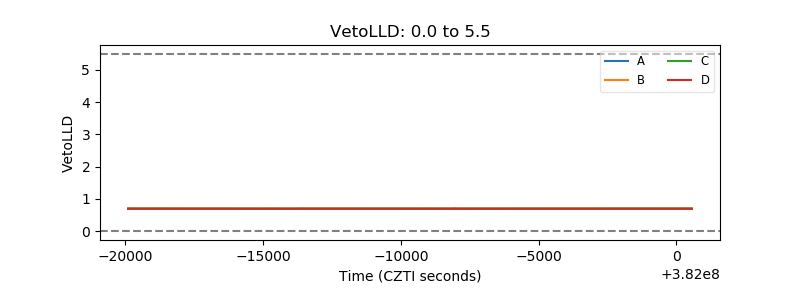 |
| Alpha Counter | 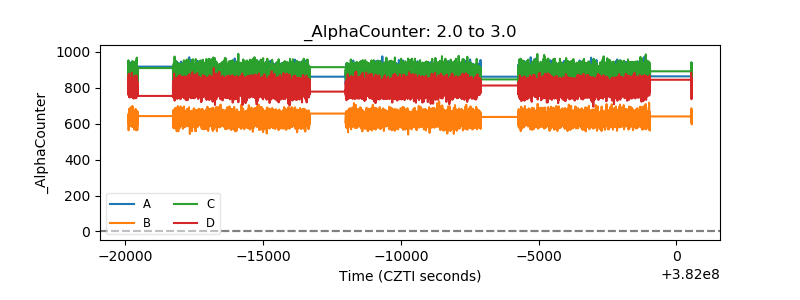 |
| _CPM_Rate |  |
| CZT Counter | 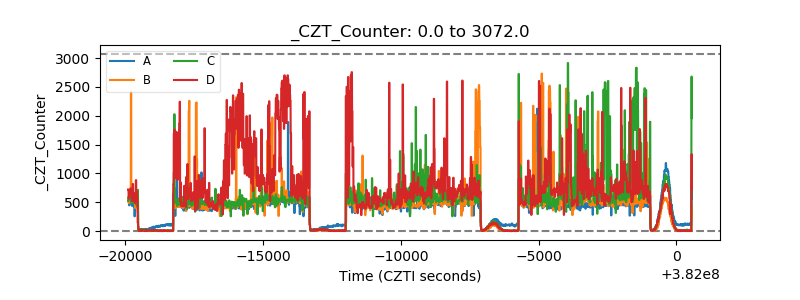 |
| +2.5 Volts monitor | 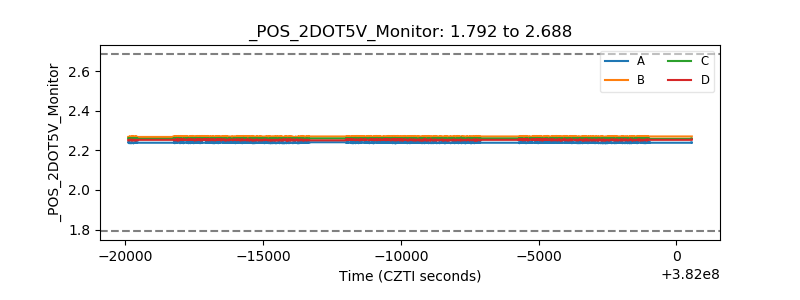 |
| +5 Volts monitor | 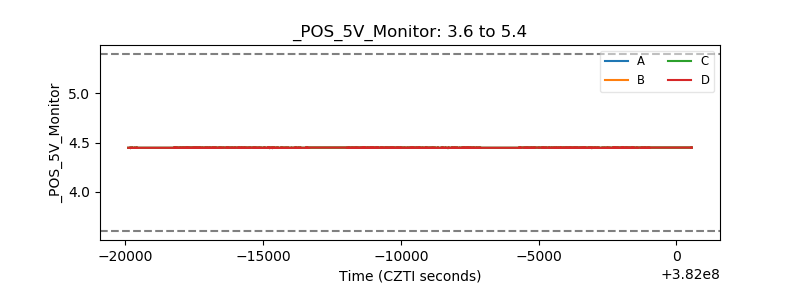 |
| _ROLL_ROT | 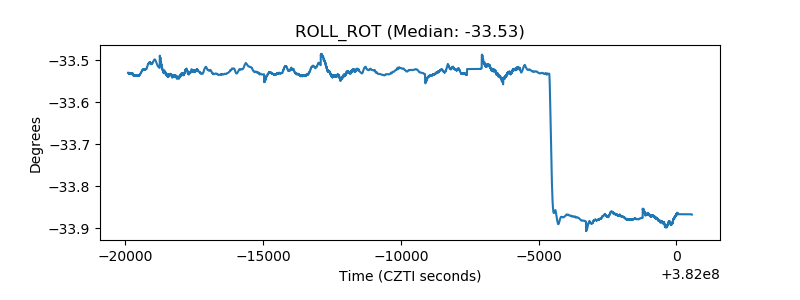 |
| _Roll_DEC | 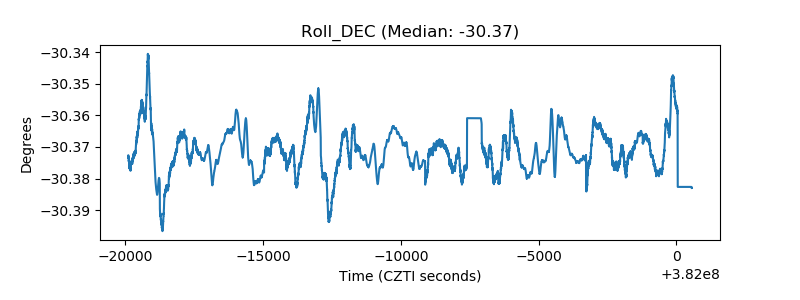 |
| _Roll_RA | 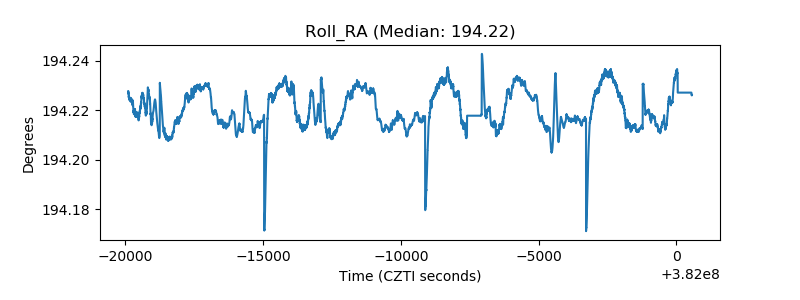 |
| Veto Counter | 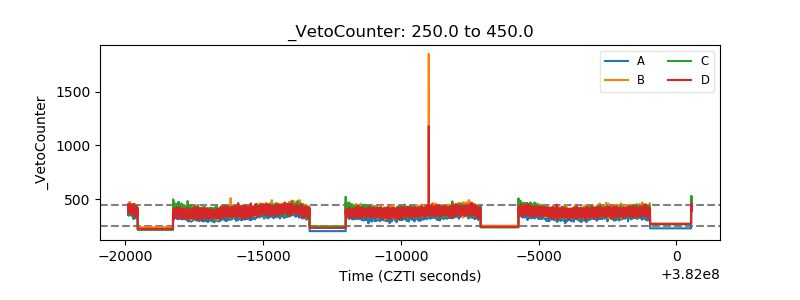 |