| Param | Original file | Final file |
|---|---|---|
| Filename | modeM0/AS1A05_108T02_9000004914_34409cztM0_level2.evt | modeM0/AS1A05_108T02_9000004914_34409cztM0_level2_quad_clean.evt |
| Size (bytes) | 170,850,240 | 33,350,400 |
| Size | 162.9 MB | 31.8 MB |
| Events in quadrant A | 883,175 | 227,994 |
| Events in quadrant B | 928,706 | 232,960 |
| Events in quadrant C | 1,002,353 | 229,524 |
| Events in quadrant D | 2,242,214 | 194,232 |
| Mode SS | |||
|---|---|---|---|
| Quadrant | BADHDUFLAG | Total packets | Discarded packets |
| A | 0 | 34 | 0 |
| B | 0 | 34 | 0 |
| C | 0 | 34 | 0 |
| D | 0 | 34 | 0 |
| Mode M9 | |||
|---|---|---|---|
| Quadrant | BADHDUFLAG | Total packets | Discarded packets |
| A | 0 | 22 | 0 |
| B | 0 | 22 | 0 |
| C | 0 | 22 | 0 |
| D | 0 | 22 | 0 |
| Mode M0 | |||
|---|---|---|---|
| Quadrant | BADHDUFLAG | Total packets | Discarded packets |
| A | 0 | 3573 | 2 |
| B | 0 | 3712 | 1 |
| C | 0 | 3941 | 1 |
| D | 0 | 7862 | 1 |
| Quadrant | Total seconds | Saturated seconds | Saturation percentage |
|---|---|---|---|
| A | 1706 | 3 | 0.175850% |
| B | 1706 | 17 | 0.996483% |
| C | 1706 | 23 | 1.348183% |
| D | 1706 | 368 | 21.570926% |
Noise dominated data is calculated using 1-second bins in cleaned event files. If a bin has >2000 counts, and if more than 50% of those come from <1% of pixels, then it is considered to be noise-dominated and hence unusable.
| Quadrant | # 1 sec bins | Bins with >0 counts | Bins with >2000 counts | High rate bins dominated by noise | Noise dominated (total time) | Noise dominated (detector-on time) | Marked lightcurve |
|---|---|---|---|---|---|---|---|
| A | 3858 | 1707 | 1 | 1 | 0.03% | 0.06% | 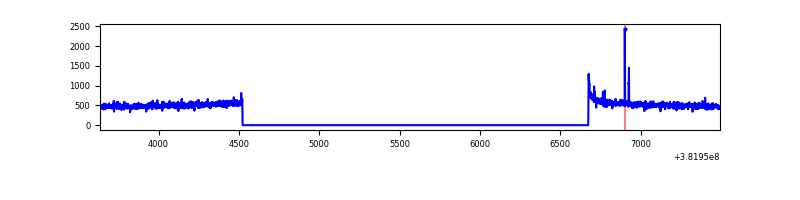 |
| B | 3858 | 1707 | 9 | 9 | 0.23% | 0.53% | 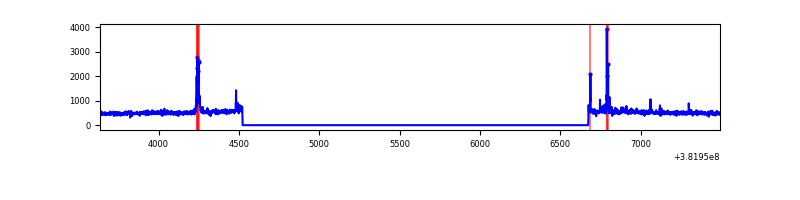 |
| C | 3858 | 1707 | 14 | 14 | 0.36% | 0.82% | 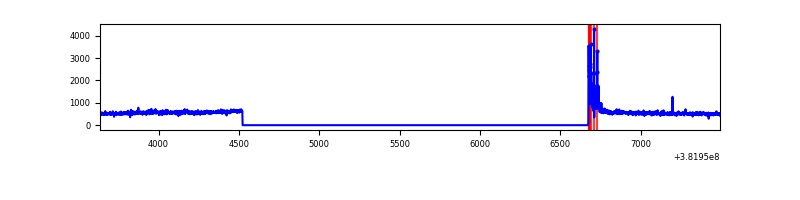 |
| D | 3858 | 1707 | 345 | 345 | 8.94% | 20.21% | 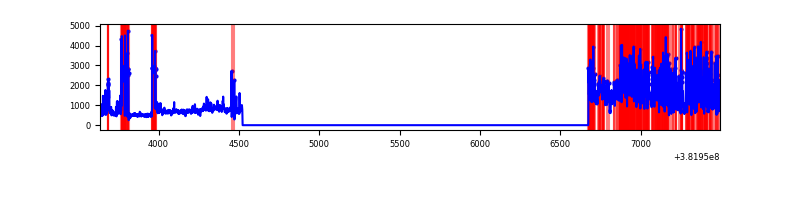 |
Top three noisy pixels from each quadrant. If the there are fewer than three noisy pixels in the level2.evt file, extra rows are filled as -1
| Pixel properties | Quadrant properties | ||||||
|---|---|---|---|---|---|---|---|
| Quadrant | DetID | PixID | Counts | Sigma | Mean | Median | Sigma |
| A | 10 | 83 | 16889 | 356.74 | 220 | 215 | 46.7 |
| A | 9 | 143 | 8556 | 178.46 | 220 | 215 | 46.7 |
| A | 13 | 6 | 4243 | 86.18 | 220 | 215 | 46.7 |
| B | 5 | 172 | 58467 | 1334.69 | 219 | 214 | 43.6 |
| B | 12 | 111 | 5073 | 111.33 | 219 | 214 | 43.6 |
| B | 11 | 111 | 4617 | 100.88 | 219 | 214 | 43.6 |
| C | 15 | 214 | 73671 | 1432.4 | 215 | 216 | 51.3 |
| C | 0 | 10 | 67065 | 1303.58 | 215 | 216 | 51.3 |
| C | 14 | 67 | 10253 | 195.73 | 215 | 216 | 51.3 |
| D | 7 | 80 | 521096 | 9694.07 | 196 | 192 | 53.7 |
| D | 10 | 230 | 413800 | 7697.28 | 196 | 192 | 53.7 |
| D | 1 | 52 | 191373 | 3557.9 | 196 | 192 | 53.7 |
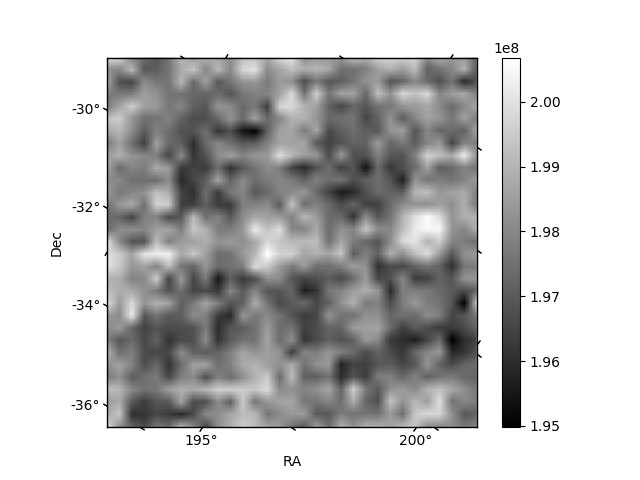
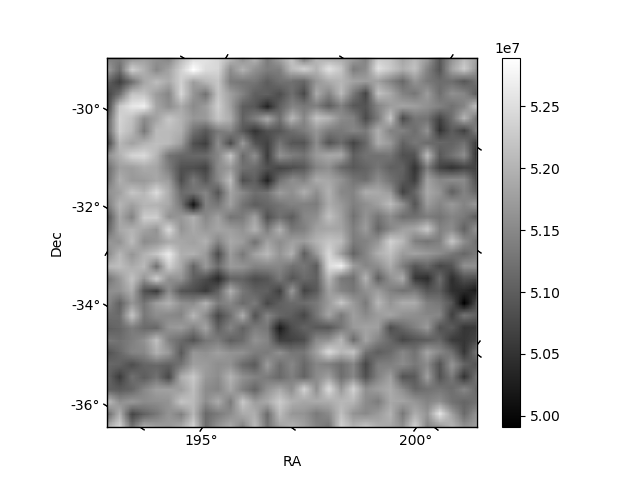
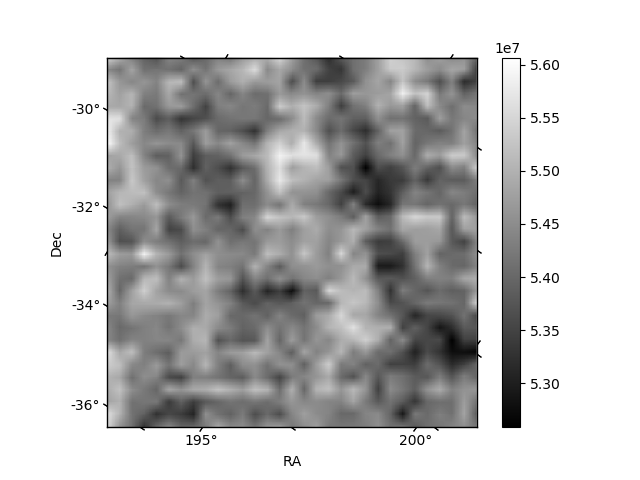
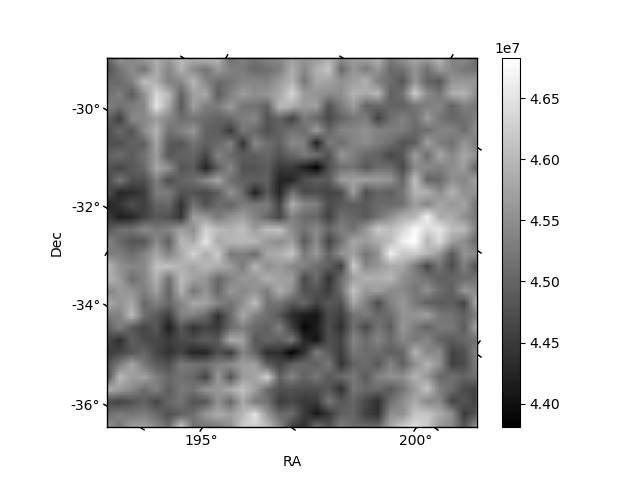
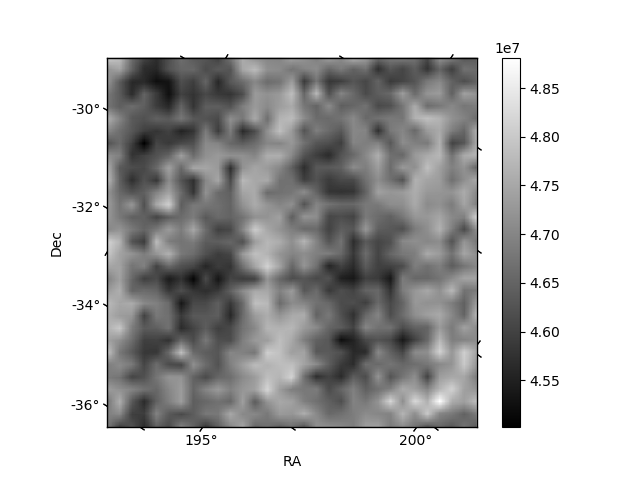
Histogram calculated using DETX and DETY for each event in the final _common_clean file
| Quadrant A | 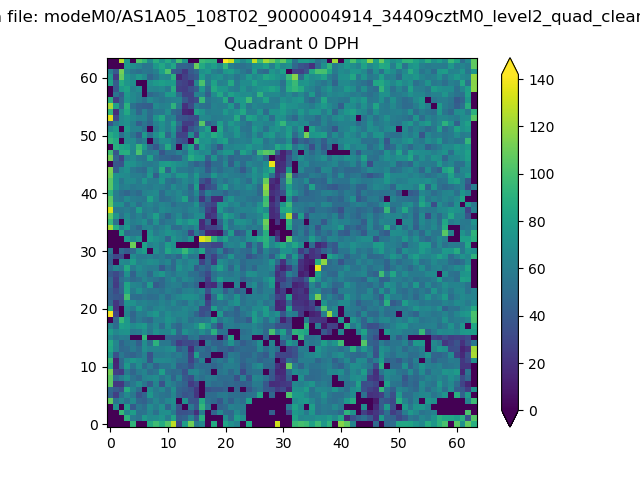 |
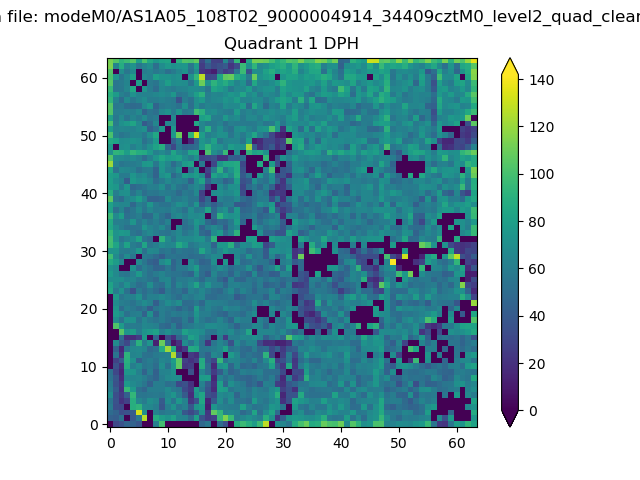 |
Quadrant B |
|---|---|---|---|
| Quadrant D | 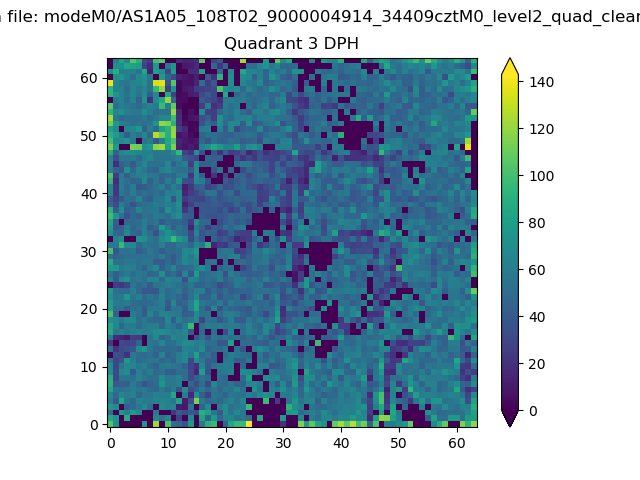 |
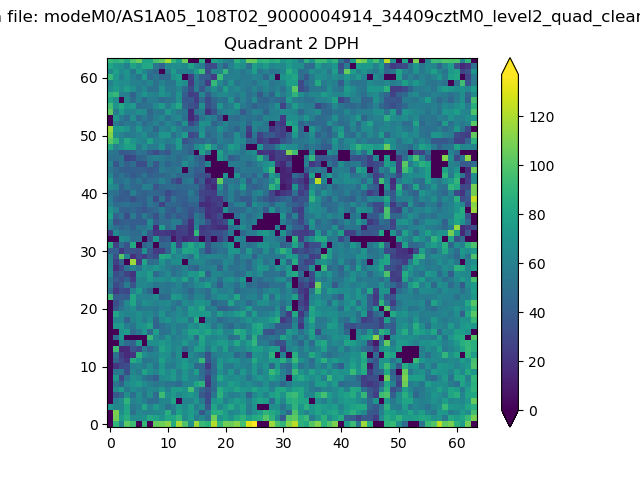 |
Quadrant C |
| Plot type | Count rate plots | Images |
|---|---|---|
| Comparison with Poisson distribution Blue bars denote a histogram of data divided into 1 sec bins. Red curve is a Poisson curve with rate = median count rate of data. |
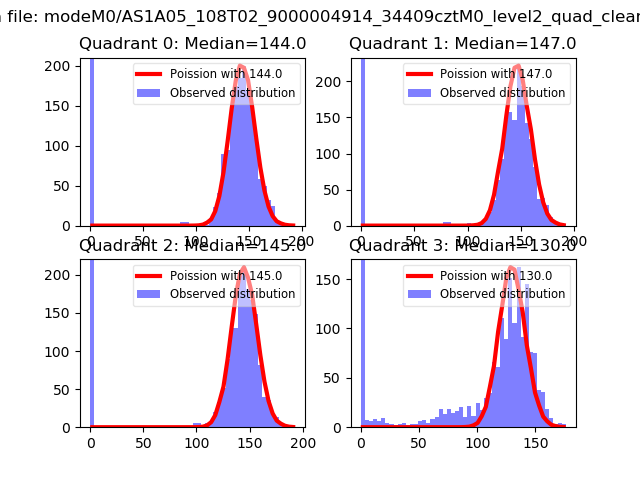 |
 |
| Quadrant-wise count rates Data is divided into 100 sec bins |
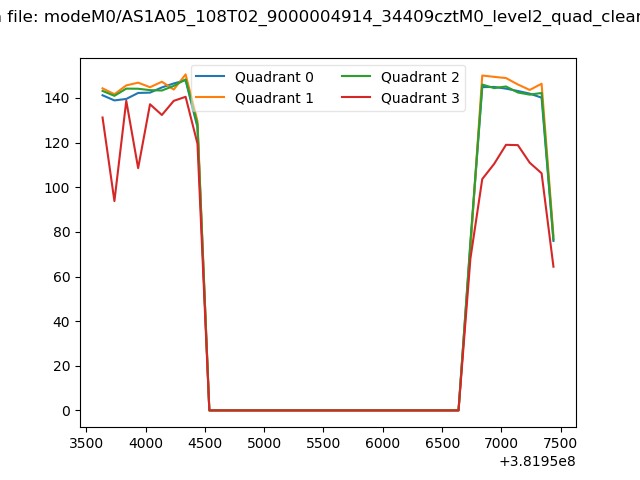 |
|
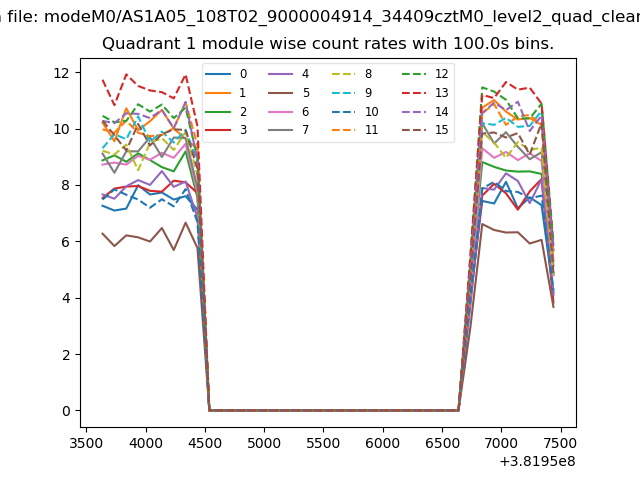
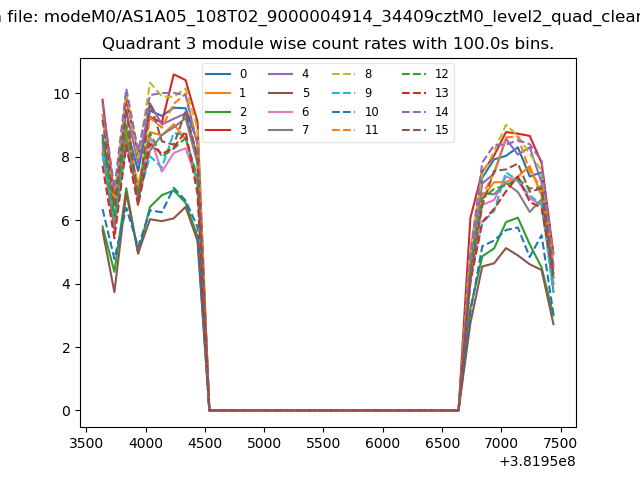
| Module-wise count rates for Quadrant A Data is divided into 100 sec bins |
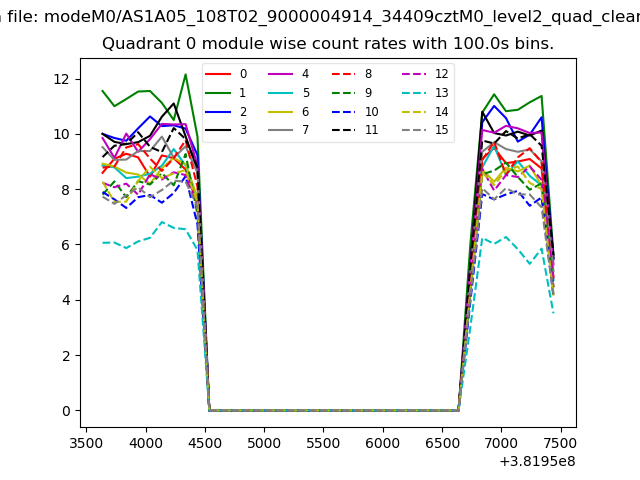 |
 |
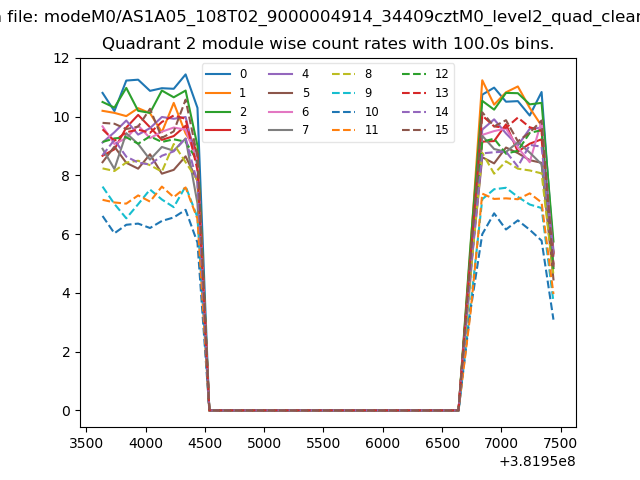
| Module-wise count rates for Quadrant B Data is divided into 100 sec bins |
 |
 |
| Module-wise count rates for Quadrant C Data is divided into 100 sec bins |
 |
 |
| Module-wise count rates for Quadrant D Data is divided into 100 sec bins |
 |
 |
| Parameter | Plot |
|---|---|
| CZT HV Monitor | 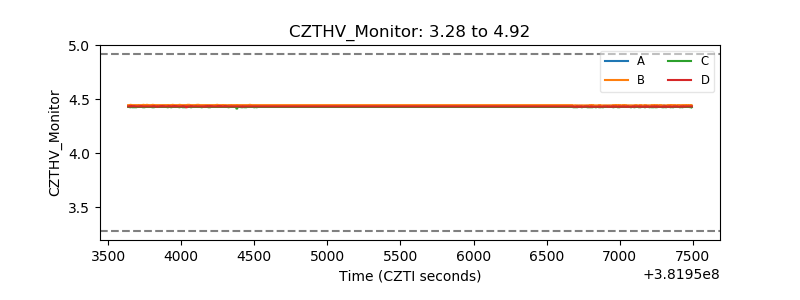 |
| D_VDD | 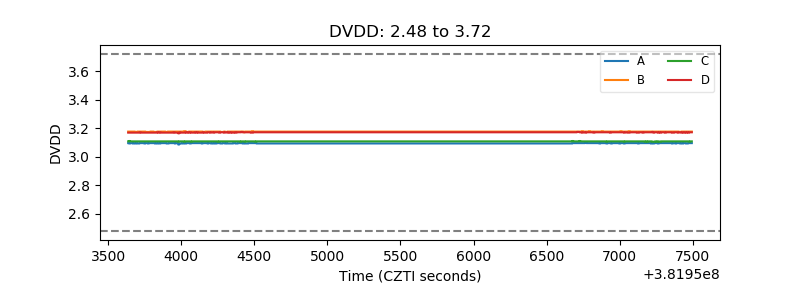 |
| Temperature 1 | 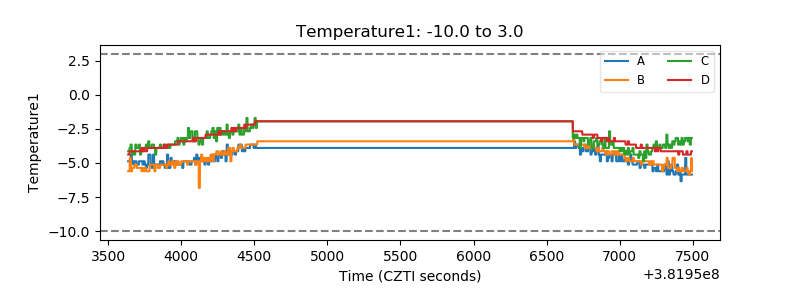 |
| Veto HV Monitor |  |
| Veto LLD | 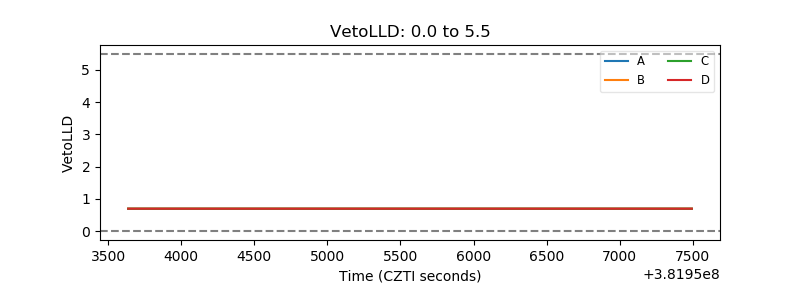 |
| Alpha Counter | 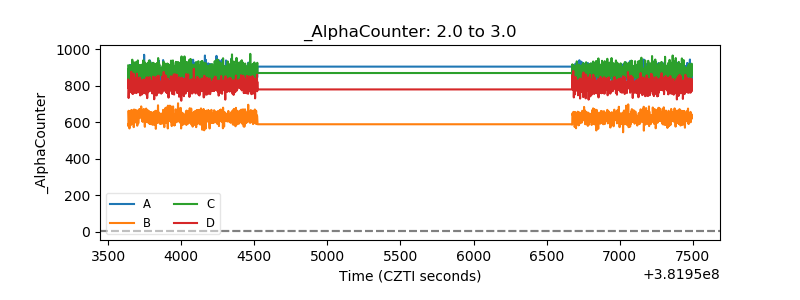 |
| _CPM_Rate | 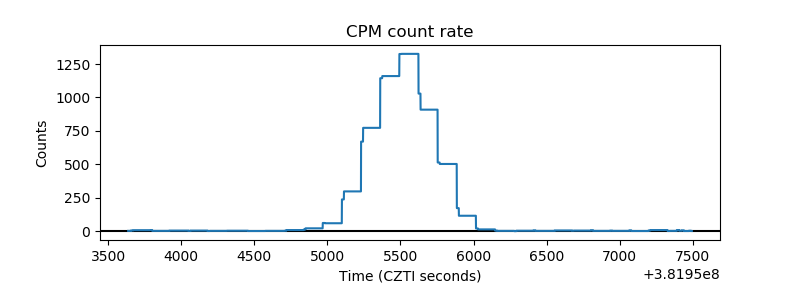 |
| CZT Counter | 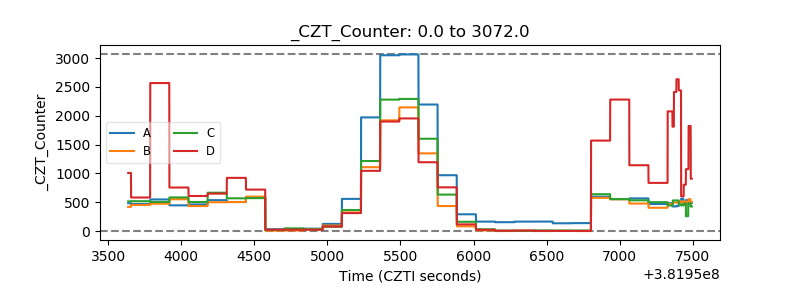 |
| +2.5 Volts monitor | 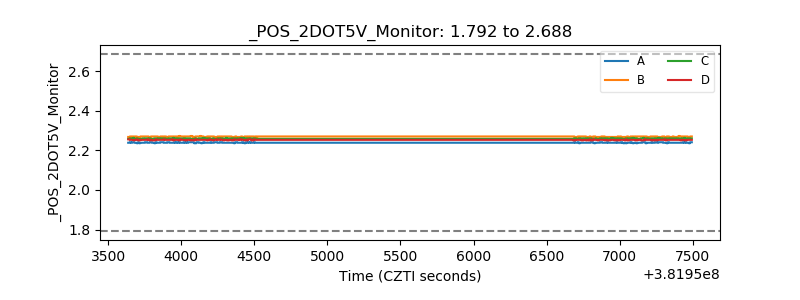 |
| +5 Volts monitor | 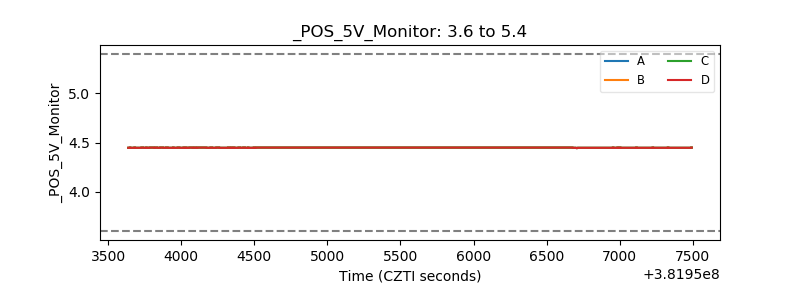 |
| _ROLL_ROT | 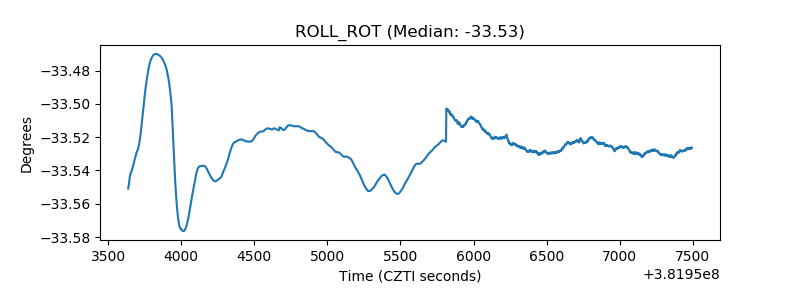 |
| _Roll_DEC | 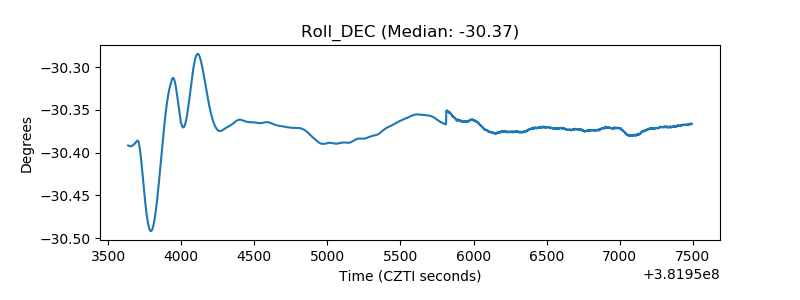 |
| _Roll_RA | 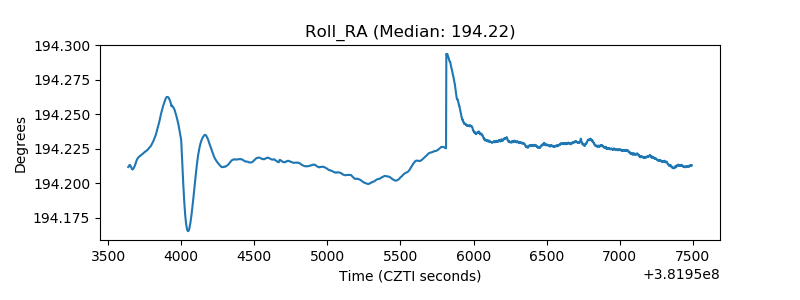 |
| Veto Counter | 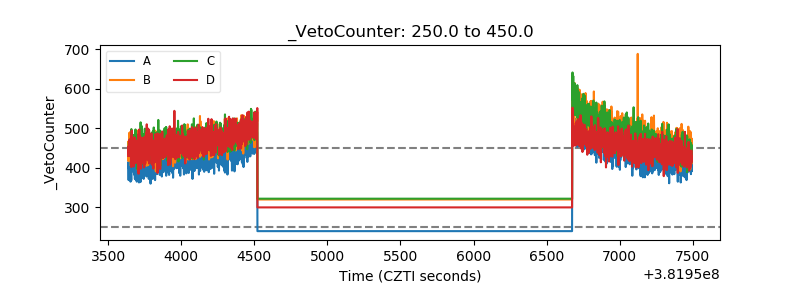 |