| Param | Original file | Final file |
|---|---|---|
| Filename | modeM0/AS1A05_103T01_9000004912cztM0_level2_bc.evt | modeM0/AS1A05_103T01_9000004912cztM0_level2_quad_clean.evt |
| Size (bytes) | 612,008,640 | 191,543,040 |
| Size | 583.7 MB | 182.7 MB |
| Events in quadrant A | 2,689,480 | 1,277,938 |
| Events in quadrant B | 3,609,910 | 1,298,199 |
| Events in quadrant C | 3,367,625 | 1,298,520 |
| Events in quadrant D | 8,121,031 | 1,173,111 |
| Mode M9 | |||
|---|---|---|---|
| Quadrant | BADHDUFLAG | Total packets | Discarded packets |
| A | 0 | 54 | 0 |
| B | 0 | 54 | 0 |
| C | 0 | 54 | 0 |
| D | 0 | 55 | 0 |
| Mode M0 | |||
|---|---|---|---|
| Quadrant | BADHDUFLAG | Total packets | Discarded packets |
| A | 0 | 23317 | 0 |
| B | 0 | 27581 | 0 |
| C | 0 | 25154 | 0 |
| D | 0 | 43460 | 0 |
| Mode SS | |||
|---|---|---|---|
| Quadrant | BADHDUFLAG | Total packets | Discarded packets |
| A | 0 | 222 | 0 |
| B | 0 | 222 | 0 |
| C | 0 | 222 | 0 |
| D | 0 | 222 | 0 |
| Quadrant | Total seconds | Saturated seconds | Saturation percentage |
|---|---|---|---|
| A | 10889 | 17 | 0.156121% |
| B | 10889 | 468 | 4.297915% |
| C | 10889 | 112 | 1.028561% |
| D | 10888 | 1567 | 14.391991% |
Noise dominated data is calculated using 1-second bins in cleaned event files. If a bin has >2000 counts, and if more than 50% of those come from <1% of pixels, then it is considered to be noise-dominated and hence unusable.
| Quadrant | # 1 sec bins | Bins with >0 counts | Bins with >2000 counts | High rate bins dominated by noise | Noise dominated (total time) | Noise dominated (detector-on time) | Marked lightcurve |
|---|---|---|---|---|---|---|---|
| A | 15043 | 10890 | 0 | 0 | 0.00% | 0.00% | 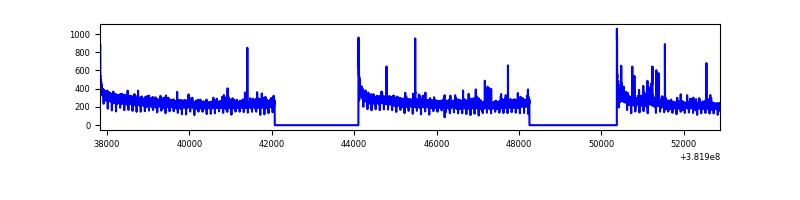 |
| B | 15042 | 10888 | 10 | 10 | 0.07% | 0.09% | 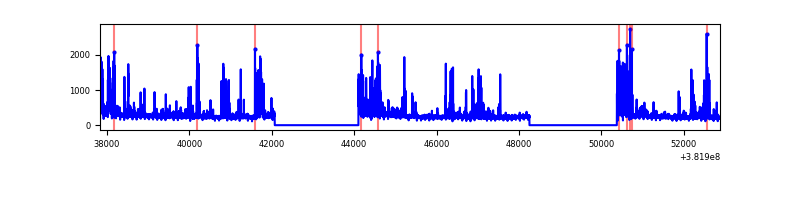 |
| C | 15042 | 10888 | 30 | 30 | 0.20% | 0.28% | 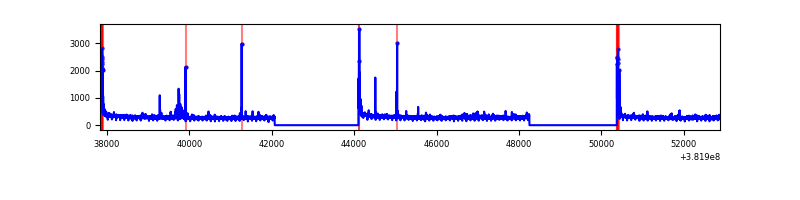 |
| D | 15042 | 10888 | 224 | 224 | 1.49% | 2.06% | 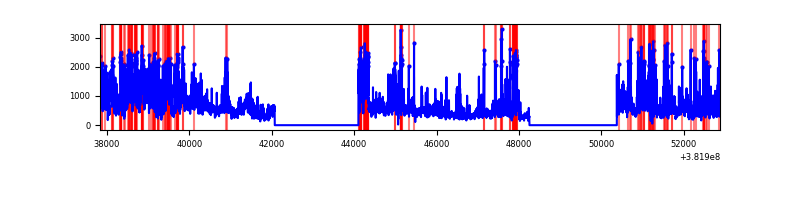 |
Top three noisy pixels from each quadrant. If the there are fewer than three noisy pixels in the level2.evt file, extra rows are filled as -1
| Pixel properties | Quadrant properties | ||||||
|---|---|---|---|---|---|---|---|
| Quadrant | DetID | PixID | Counts | Sigma | Mean | Median | Sigma |
| A | 10 | 83 | 54621 | 376.69 | 665 | 656 | 143.3 |
| A | 13 | 6 | 26789 | 182.41 | 665 | 656 | 143.3 |
| A | 15 | 223 | 22867 | 155.03 | 665 | 656 | 143.3 |
| B | 5 | 172 | 804212 | 6228.21 | 663 | 653 | 129.0 |
| B | 0 | 190 | 108455 | 835.55 | 663 | 653 | 129.0 |
| B | 0 | 229 | 70206 | 539.09 | 663 | 653 | 129.0 |
| C | 15 | 214 | 428368 | 2905.47 | 663 | 664 | 147.2 |
| C | 0 | 10 | 209620 | 1419.48 | 663 | 664 | 147.2 |
| C | 14 | 67 | 63354 | 425.86 | 663 | 664 | 147.2 |
| D | 8 | 195 | 1467499 | 9238.65 | 614 | 602 | 158.8 |
| D | 2 | 249 | 1206388 | 7594.15 | 614 | 602 | 158.8 |
| D | 7 | 80 | 1120295 | 7051.92 | 614 | 602 | 158.8 |
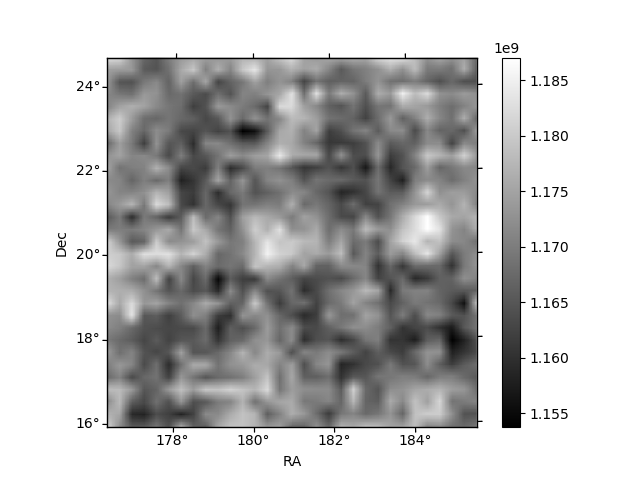
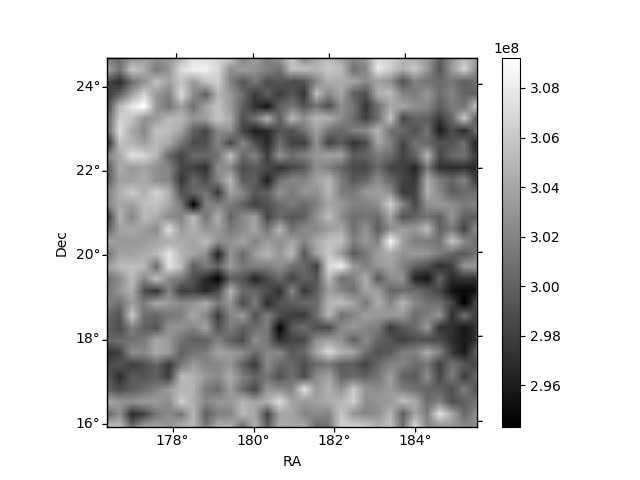
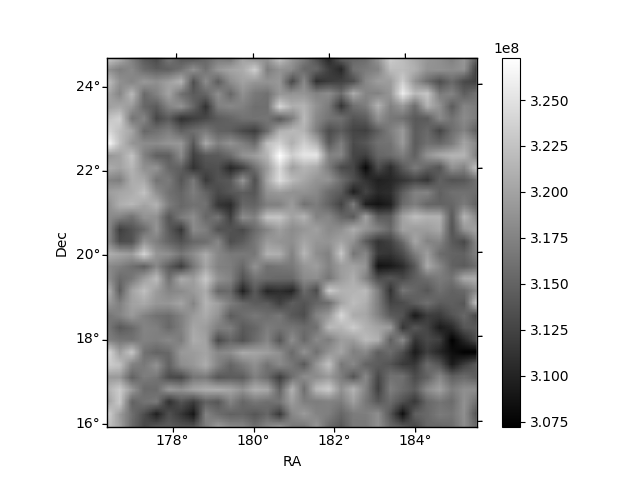
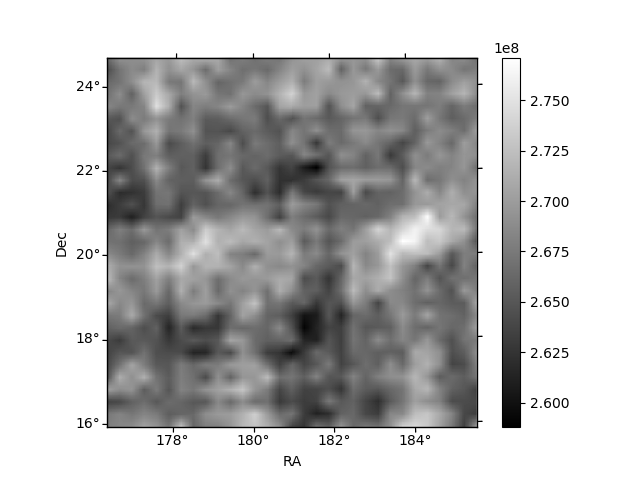
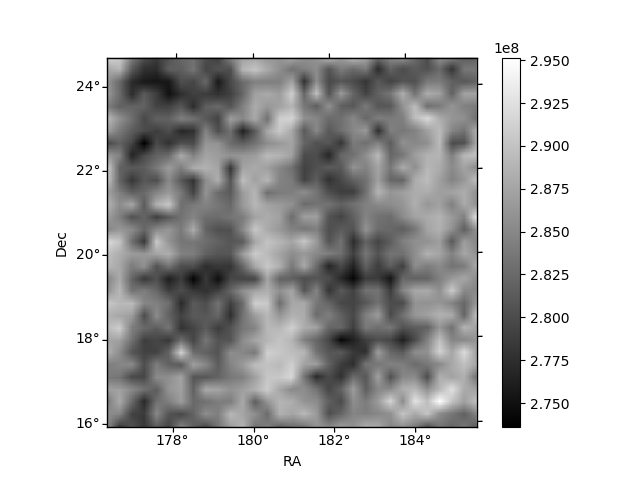
Histogram calculated using DETX and DETY for each event in the final _common_clean file
| Quadrant A | 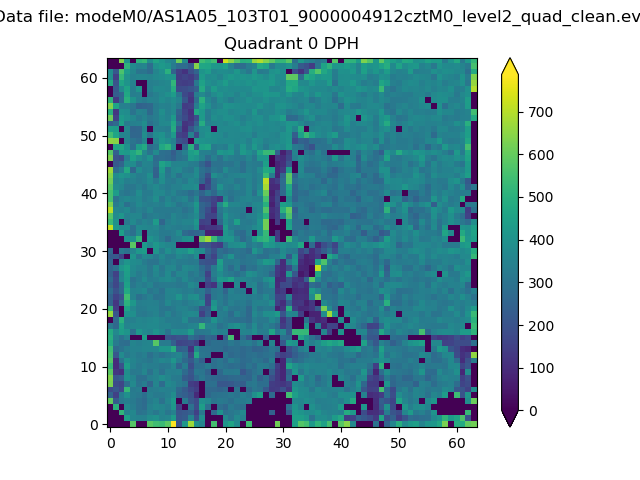 |
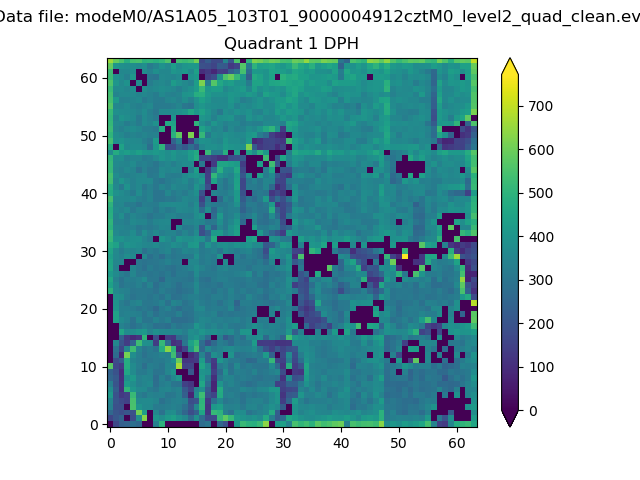 |
Quadrant B |
|---|---|---|---|
| Quadrant D | 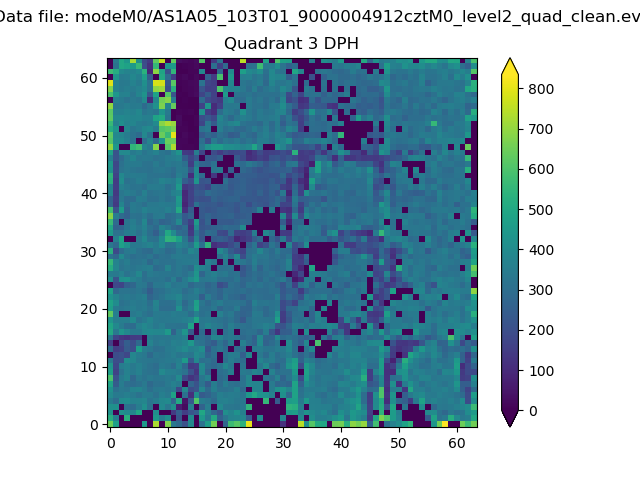 |
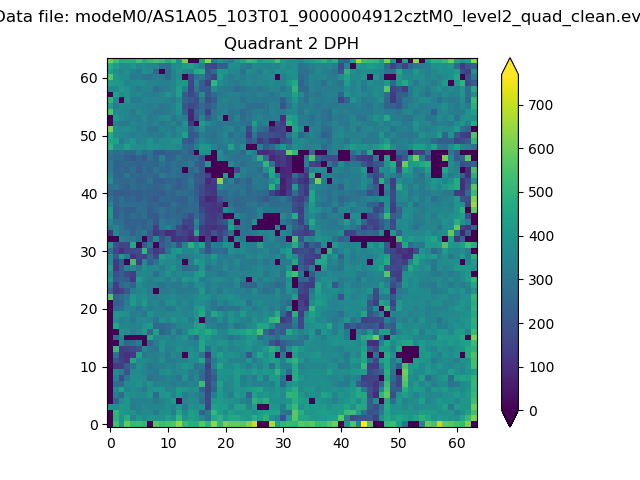 |
Quadrant C |
| Plot type | Count rate plots | Images |
|---|---|---|
| Comparison with Poisson distribution Blue bars denote a histogram of data divided into 1 sec bins. Red curve is a Poisson curve with rate = median count rate of data. |
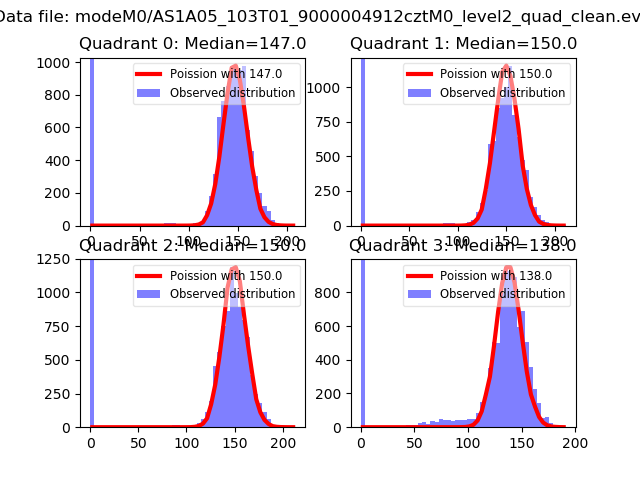 |
 |
| Quadrant-wise count rates Data is divided into 100 sec bins |
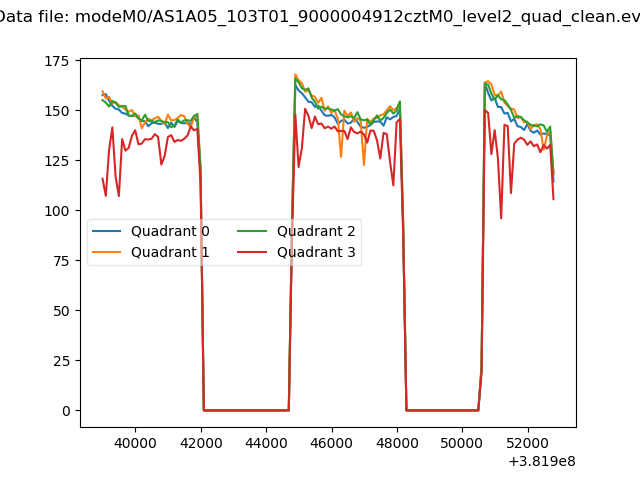 |
|
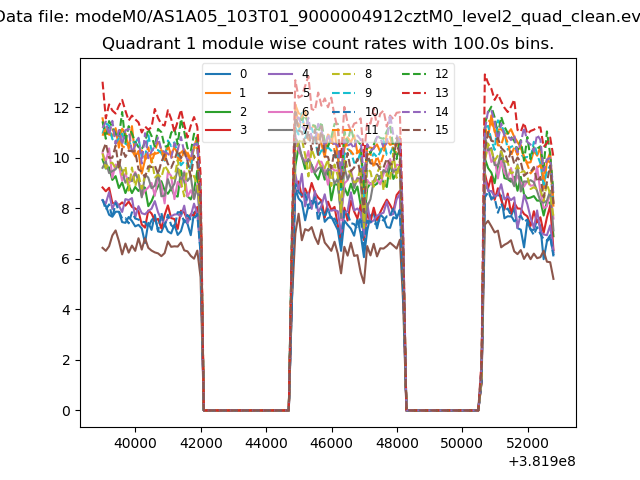
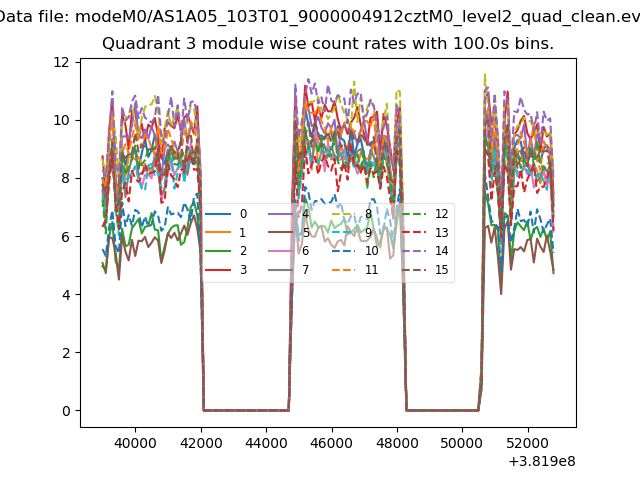
| Module-wise count rates for Quadrant A Data is divided into 100 sec bins |
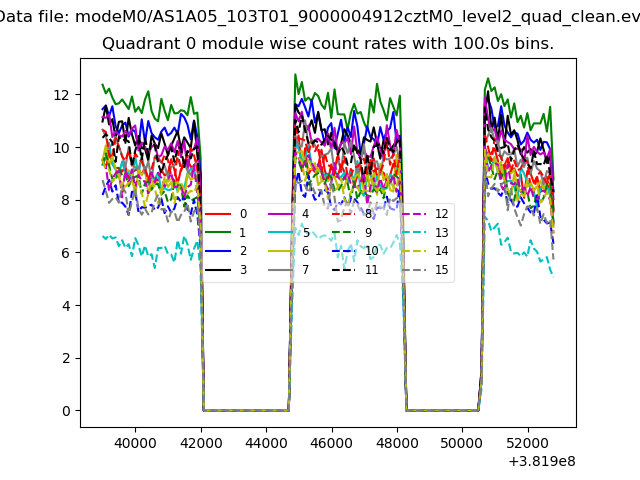 |
 |
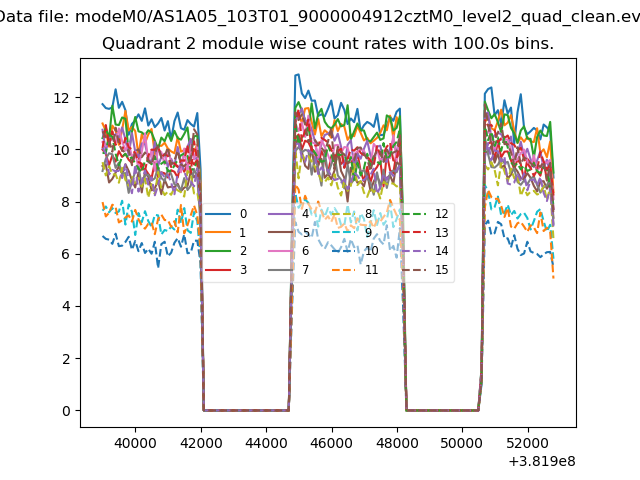
| Module-wise count rates for Quadrant B Data is divided into 100 sec bins |
 |
 |
| Module-wise count rates for Quadrant C Data is divided into 100 sec bins |
 |
 |
| Module-wise count rates for Quadrant D Data is divided into 100 sec bins |
 |
 |
| Parameter | Plot |
|---|---|
| CZT HV Monitor | 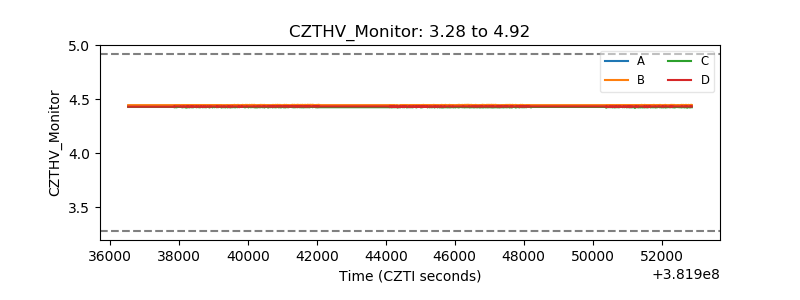 |
| D_VDD | 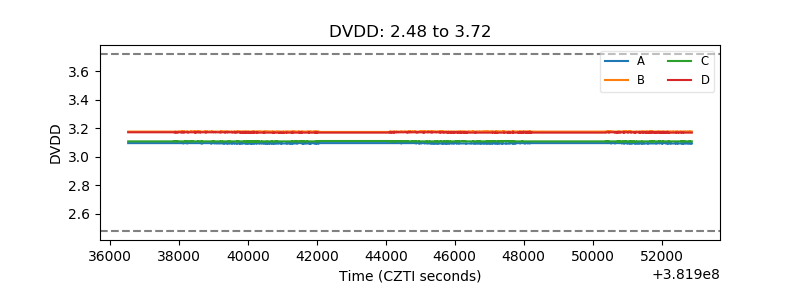 |
| Temperature 1 | 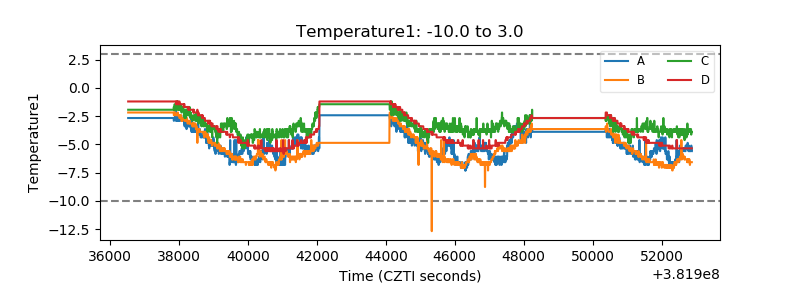 |
| Veto HV Monitor |  |
| Veto LLD | 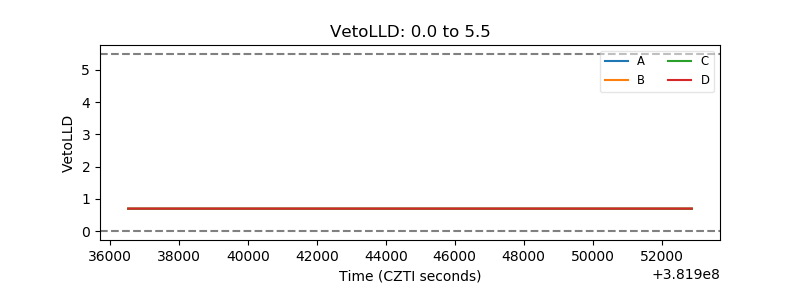 |
| Alpha Counter | 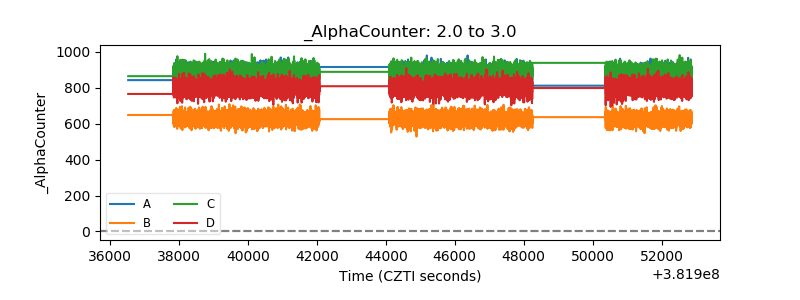 |
| _CPM_Rate | 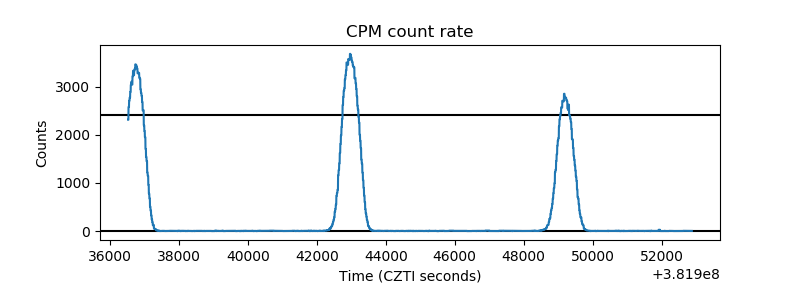 |
| CZT Counter | 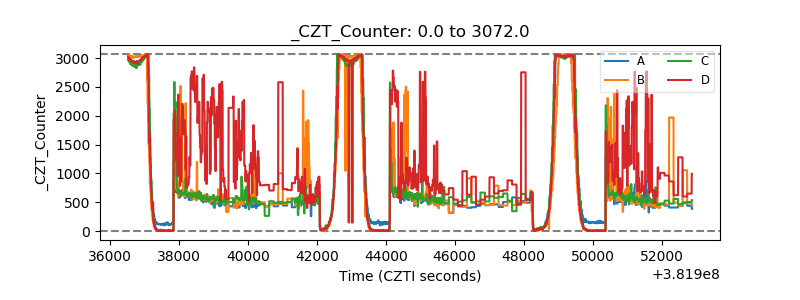 |
| +2.5 Volts monitor | 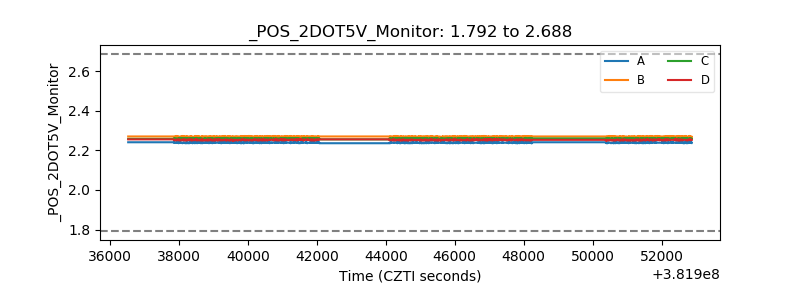 |
| +5 Volts monitor | 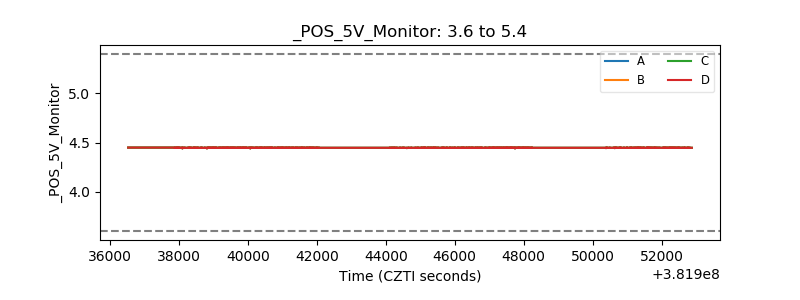 |
| _ROLL_ROT | 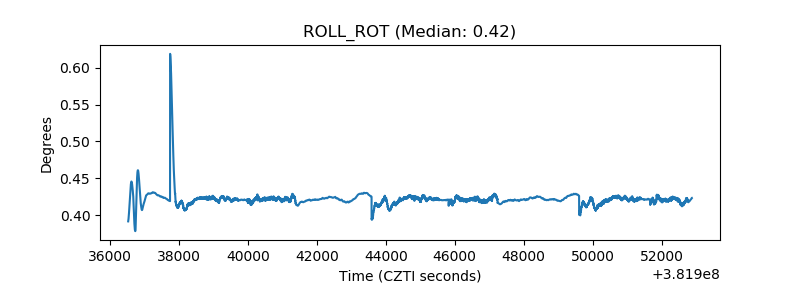 |
| _Roll_DEC | 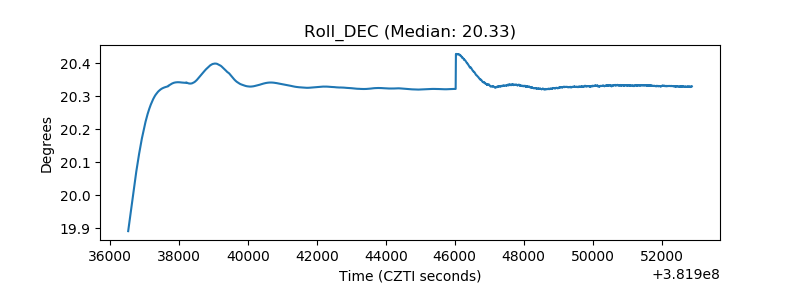 |
| _Roll_RA | 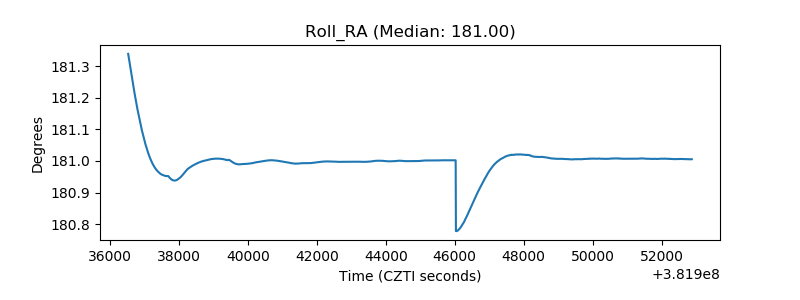 |
| Veto Counter | 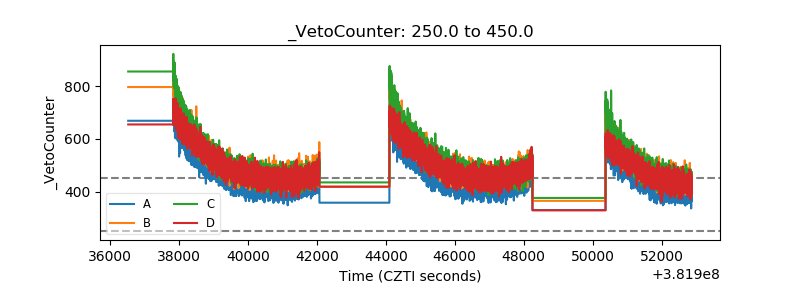 |