| Param | Original file | Final file |
|---|---|---|
| Filename | modeM0/AS1A05_085T01_9000004910_34575cztM0_level2.evt | modeM0/AS1A05_085T01_9000004910_34575cztM0_level2_quad_clean.evt |
| Size (bytes) | 826,943,040 | 124,940,160 |
| Size | 788.6 MB | 119.2 MB |
| Events in quadrant A | 4,613,615 | 810,511 |
| Events in quadrant B | 4,990,627 | 805,731 |
| Events in quadrant C | 4,518,574 | 819,279 |
| Events in quadrant D | 10,314,528 | 724,804 |
| Mode SS | |||
|---|---|---|---|
| Quadrant | BADHDUFLAG | Total packets | Discarded packets |
| A | 0 | 223 | 32 |
| B | 0 | 226 | 38 |
| C | 0 | 234 | 45 |
| D | 0 | 222 | 40 |
| Mode M9 | |||
|---|---|---|---|
| Quadrant | BADHDUFLAG | Total packets | Discarded packets |
| A | 0 | 37 | 9 |
| B | 0 | 39 | 11 |
| C | 0 | 38 | 10 |
| D | 0 | 37 | 9 |
| Mode M0 | |||
|---|---|---|---|
| Quadrant | BADHDUFLAG | Total packets | Discarded packets |
| A | 0 | 23818 | 4019 |
| B | 0 | 27865 | 7235 |
| C | 0 | 23046 | 4167 |
| D | 0 | 44753 | 7663 |
| Quadrant | Total seconds | Saturated seconds | Saturation percentage |
|---|---|---|---|
| A | 9057 | 227 | 2.506349% |
| B | 8934 | 186 | 2.081934% |
| C | 9071 | 28 | 0.308676% |
| D | 8803 | 913 | 10.371464% |
Noise dominated data is calculated using 1-second bins in cleaned event files. If a bin has >2000 counts, and if more than 50% of those come from <1% of pixels, then it is considered to be noise-dominated and hence unusable.
| Quadrant | # 1 sec bins | Bins with >0 counts | Bins with >2000 counts | High rate bins dominated by noise | Noise dominated (total time) | Noise dominated (detector-on time) | Marked lightcurve |
|---|---|---|---|---|---|---|---|
| A | 16093 | 9464 | 136 | 136 | 0.85% | 1.44% | 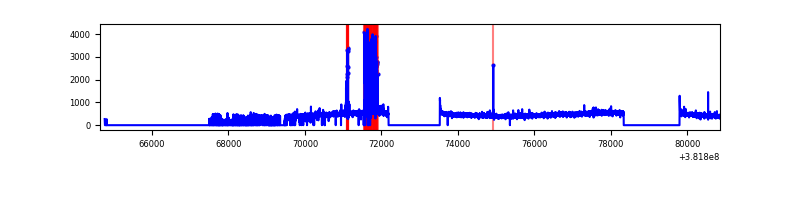 |
| B | 13357 | 9275 | 114 | 114 | 0.85% | 1.23% | 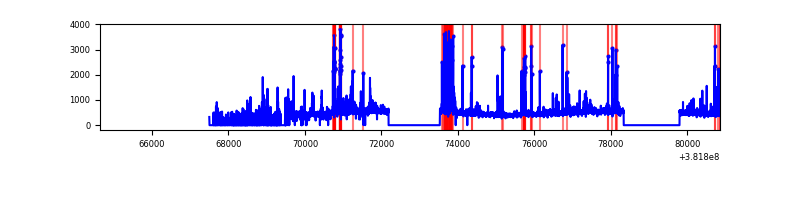 |
| C | 16216 | 9482 | 12 | 12 | 0.07% | 0.13% | 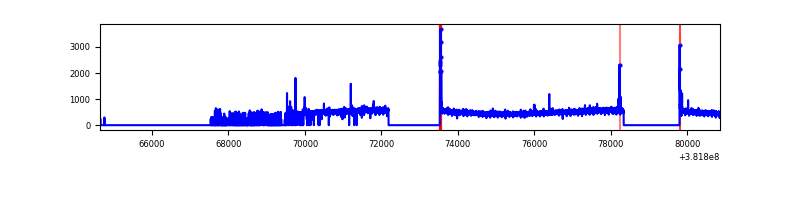 |
| D | 16130 | 9186 | 548 | 548 | 3.40% | 5.97% | 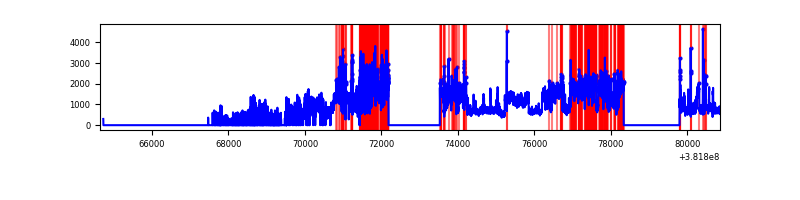 |
Top three noisy pixels from each quadrant. If the there are fewer than three noisy pixels in the level2.evt file, extra rows are filled as -1
| Pixel properties | Quadrant properties | ||||||
|---|---|---|---|---|---|---|---|
| Quadrant | DetID | PixID | Counts | Sigma | Mean | Median | Sigma |
| A | 15 | 223 | 473495 | 2258.63 | 1046 | 1027 | 209.2 |
| A | 10 | 83 | 47817 | 223.68 | 1046 | 1027 | 209.2 |
| A | 13 | 6 | 28691 | 132.25 | 1046 | 1027 | 209.2 |
| B | 5 | 172 | 561100 | 2805.8 | 1037 | 1008 | 199.6 |
| B | 0 | 229 | 148697 | 739.85 | 1037 | 1008 | 199.6 |
| B | 0 | 190 | 46674 | 228.77 | 1037 | 1008 | 199.6 |
| C | 15 | 214 | 379125 | 1578.43 | 1030 | 1037 | 239.5 |
| C | 0 | 10 | 74524 | 306.79 | 1030 | 1037 | 239.5 |
| C | 14 | 67 | 29058 | 116.98 | 1030 | 1037 | 239.5 |
| D | 8 | 195 | 5626051 | 23363.83 | 977 | 949 | 240.8 |
| D | 1 | 47 | 337412 | 1397.5 | 977 | 949 | 240.8 |
| D | 13 | 249 | 153800 | 634.87 | 977 | 949 | 240.8 |
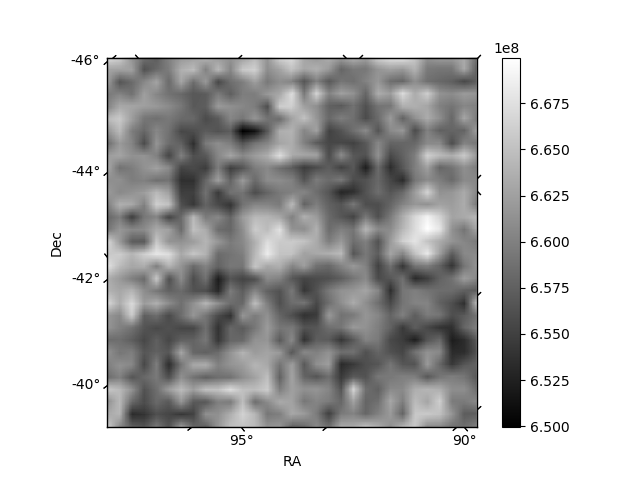
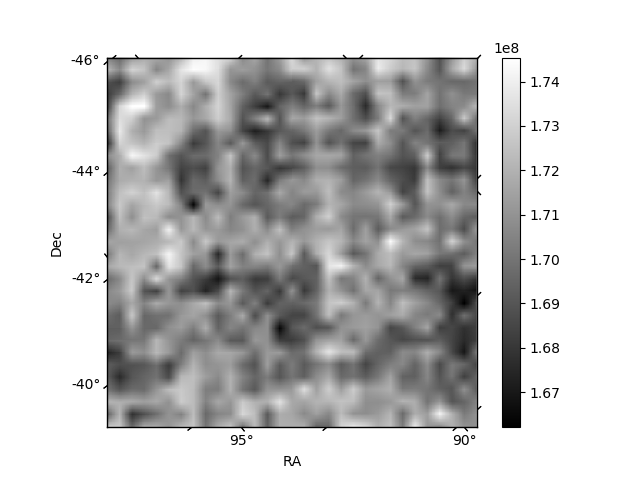
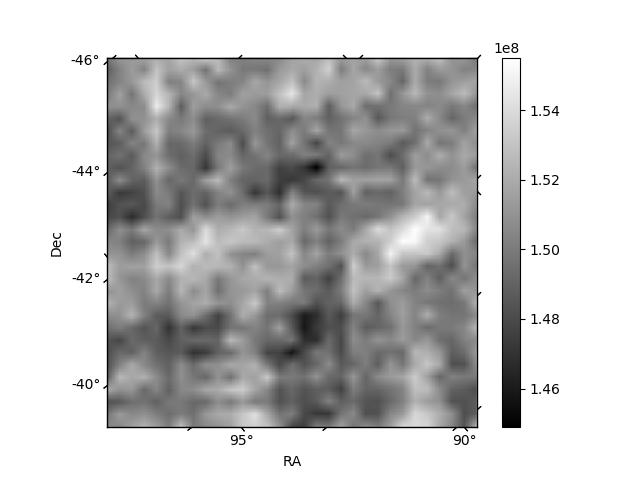
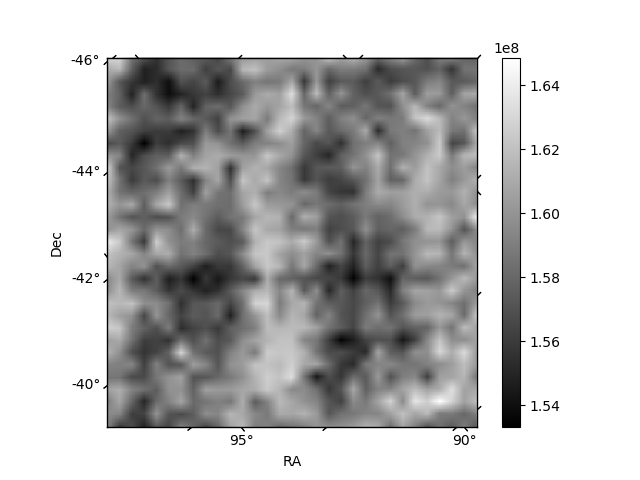
Histogram calculated using DETX and DETY for each event in the final _common_clean file
| Quadrant A | 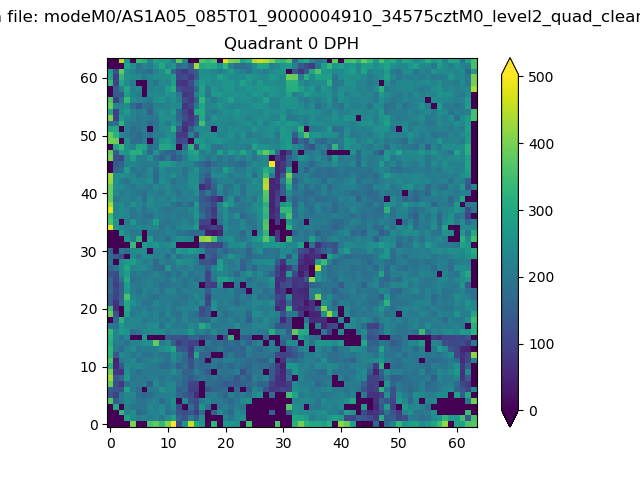 |
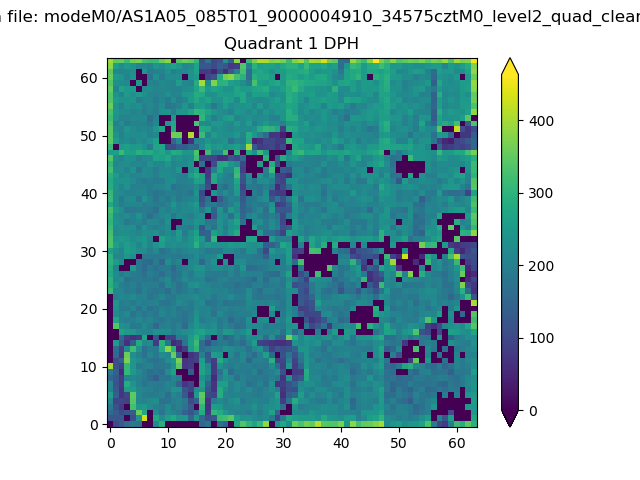 |
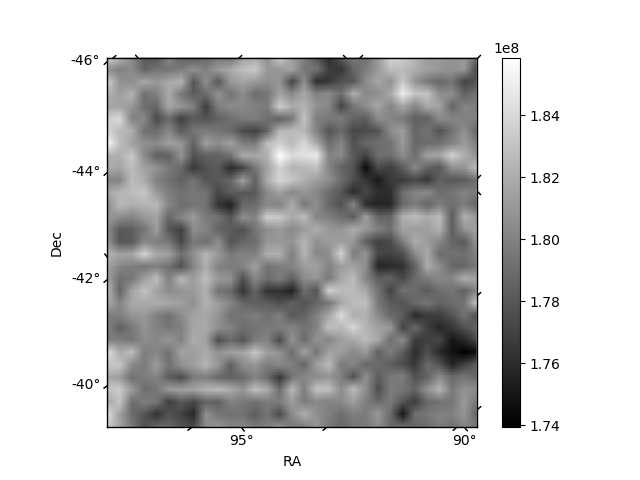
Quadrant B |
|---|---|---|---|
| Quadrant D | 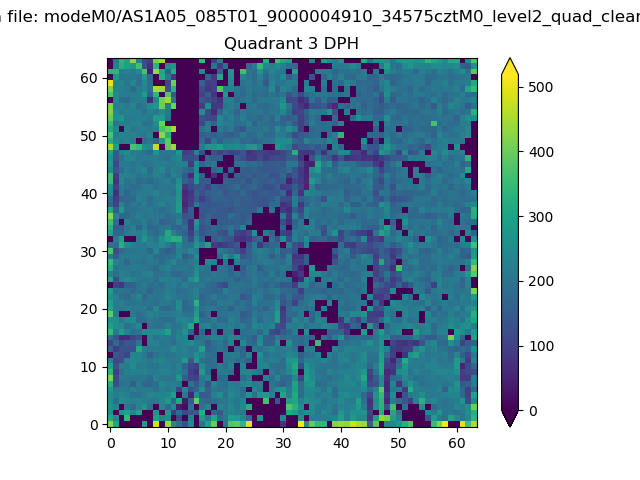 |
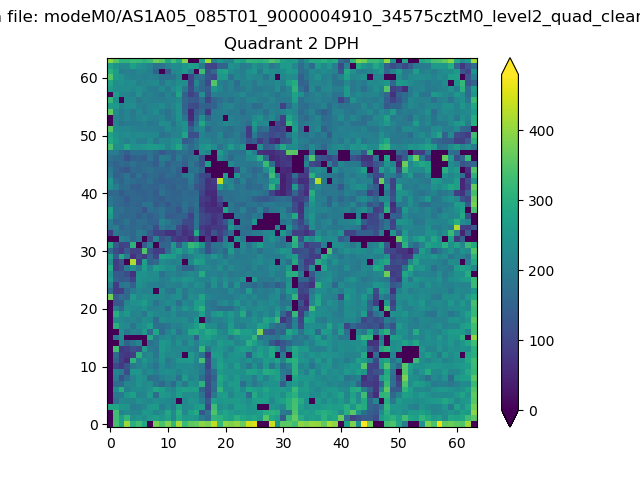 |
Quadrant C |
| Plot type | Count rate plots | Images |
|---|---|---|
| Comparison with Poisson distribution Blue bars denote a histogram of data divided into 1 sec bins. Red curve is a Poisson curve with rate = median count rate of data. |
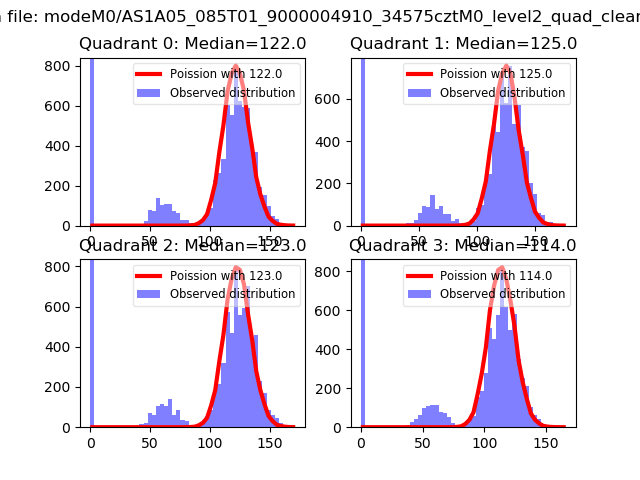 |
 |
| Quadrant-wise count rates Data is divided into 100 sec bins |
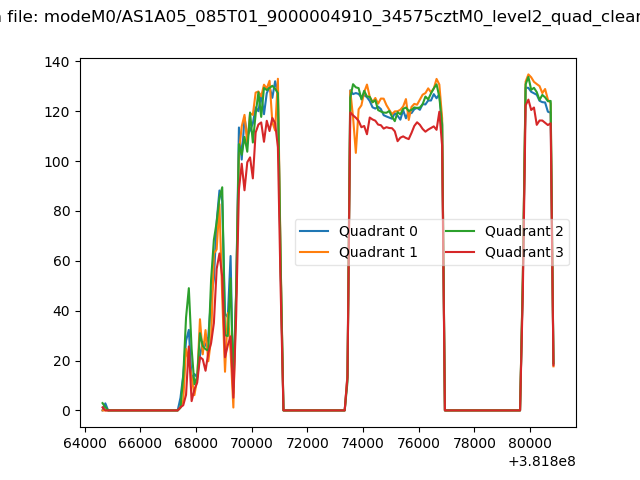 |
|
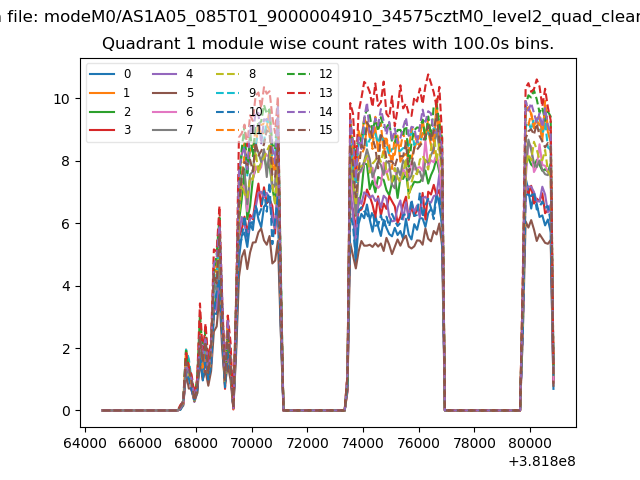
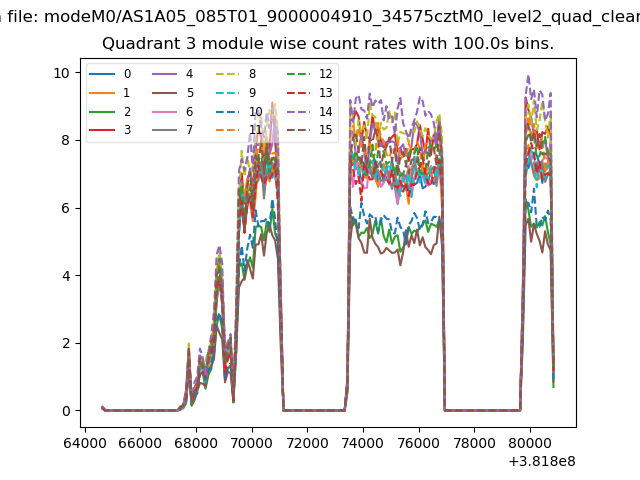
| Module-wise count rates for Quadrant A Data is divided into 100 sec bins |
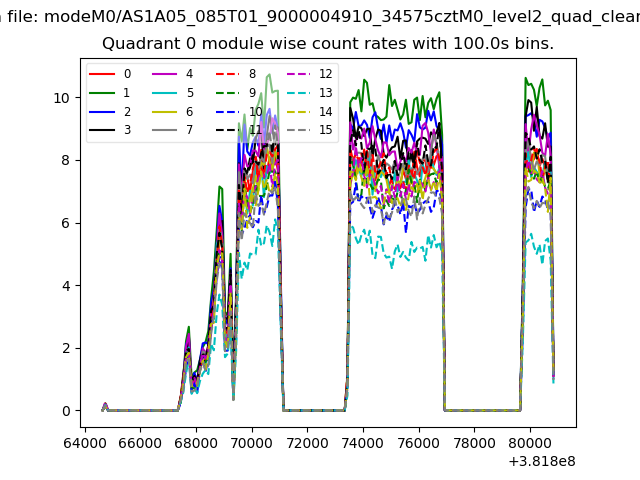 |
 |
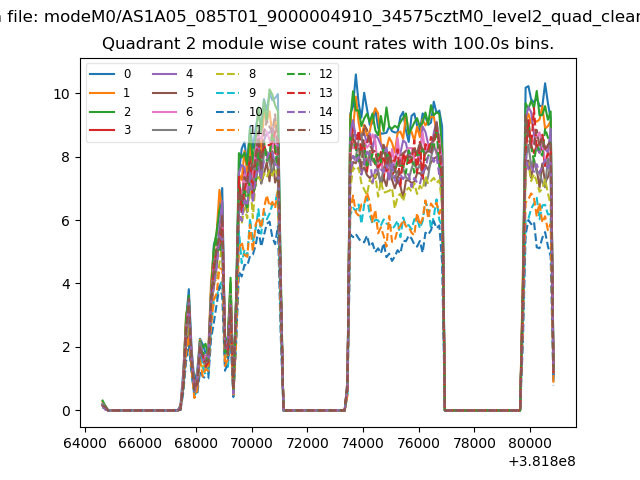
| Module-wise count rates for Quadrant B Data is divided into 100 sec bins |
 |
 |
| Module-wise count rates for Quadrant C Data is divided into 100 sec bins |
 |
 |
| Module-wise count rates for Quadrant D Data is divided into 100 sec bins |
 |
 |
| Parameter | Plot |
|---|---|
| CZT HV Monitor | 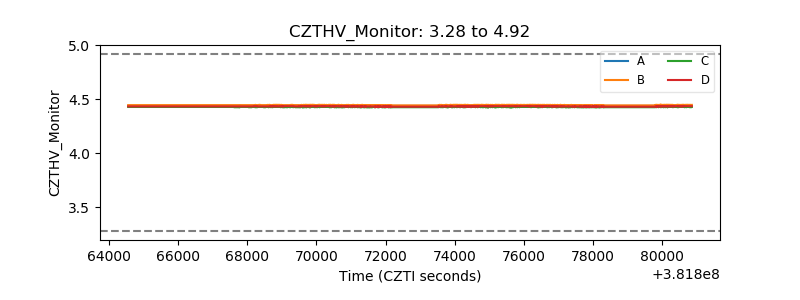 |
| D_VDD | 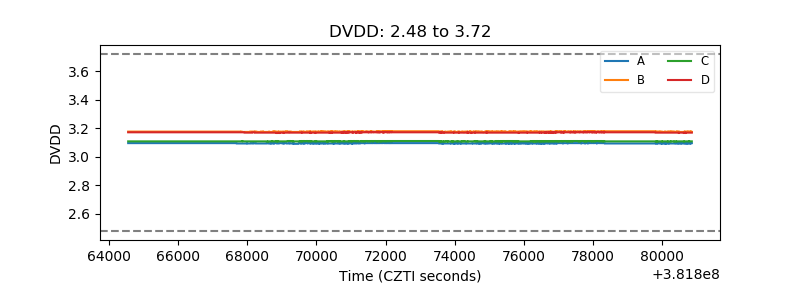 |
| Temperature 1 | 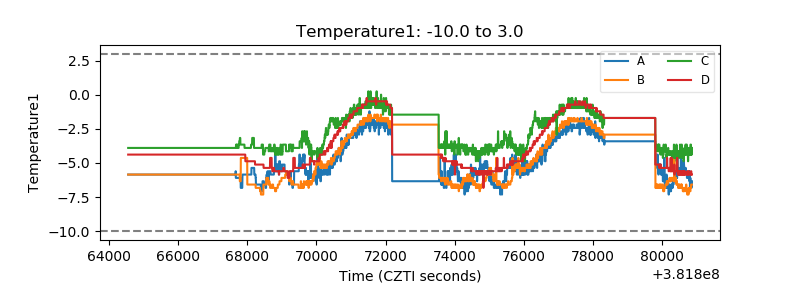 |
| Veto HV Monitor | 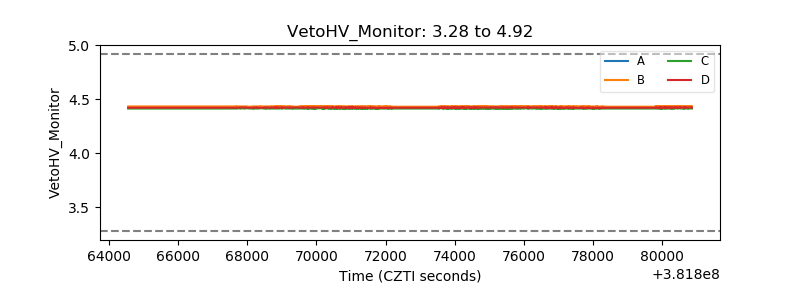 |
| Veto LLD | 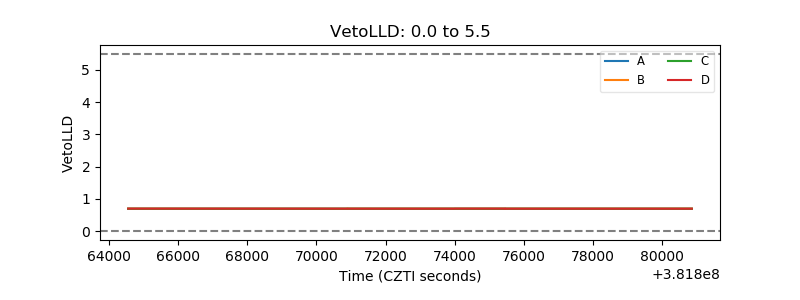 |
| Alpha Counter | 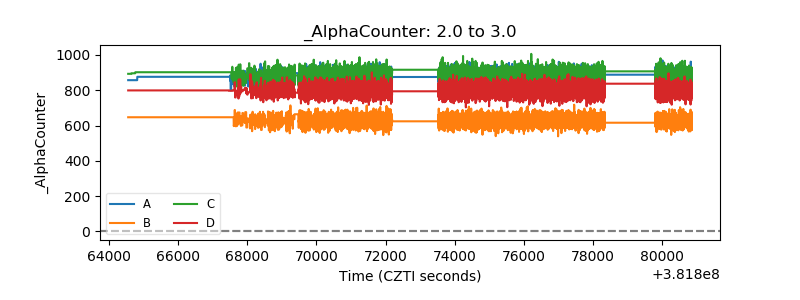 |
| _CPM_Rate | 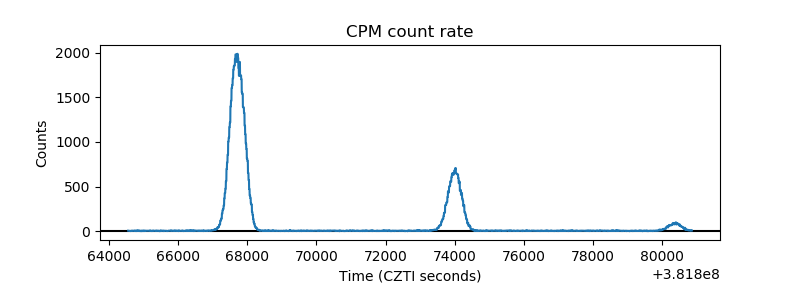 |
| CZT Counter | 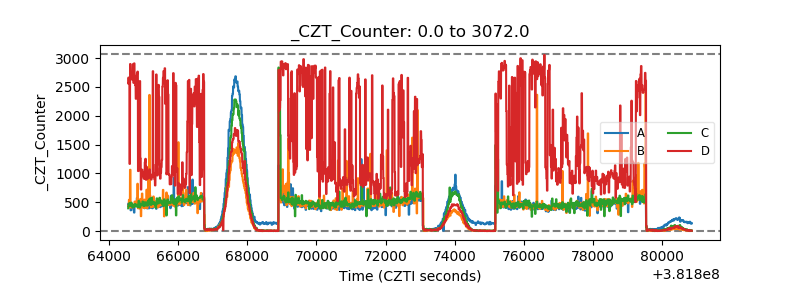 |
| +2.5 Volts monitor | 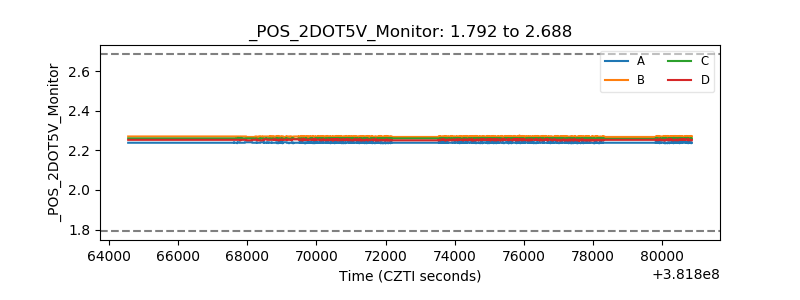 |
| +5 Volts monitor | 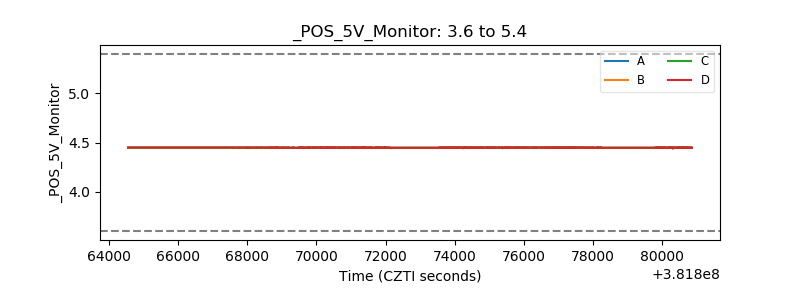 |
| _ROLL_ROT | 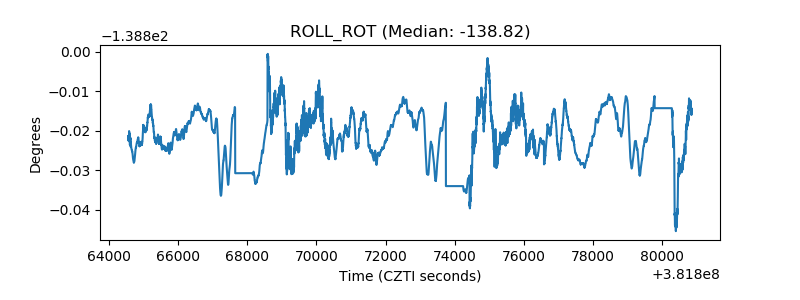 |
| _Roll_DEC | 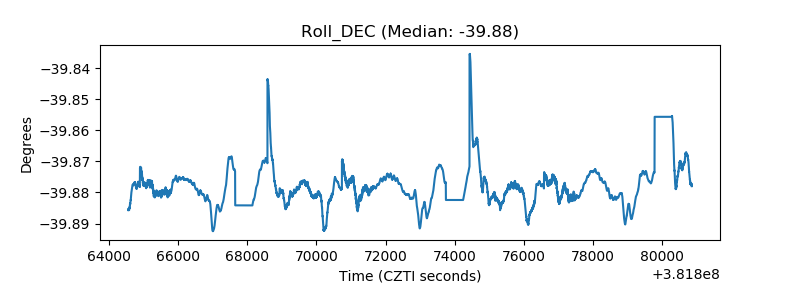 |
| _Roll_RA | 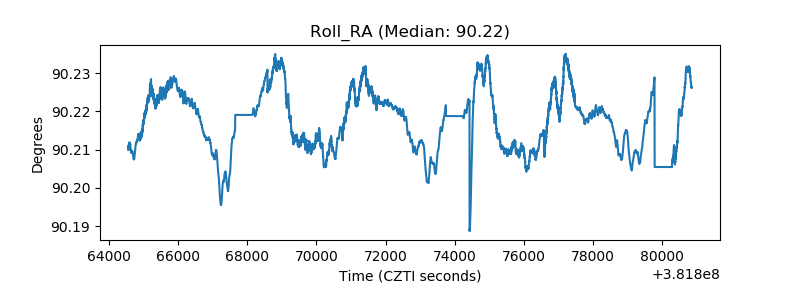 |
| Veto Counter | 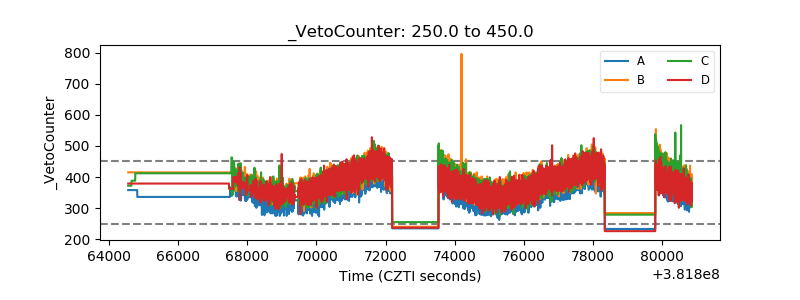 |