| Param | Original file | Final file |
|---|---|---|
| Filename | modeM0/AS1A05_085T01_9000004910_34403cztM0_level2.evt | modeM0/AS1A05_085T01_9000004910_34403cztM0_level2_quad_clean.evt |
| Size (bytes) | 517,464,000 | 83,868,480 |
| Size | 493.5 MB | 80.0 MB |
| Events in quadrant A | 2,632,227 | 557,584 |
| Events in quadrant B | 3,230,790 | 554,352 |
| Events in quadrant C | 2,899,657 | 562,915 |
| Events in quadrant D | 6,533,348 | 477,066 |
| Mode SS | |||
|---|---|---|---|
| Quadrant | BADHDUFLAG | Total packets | Discarded packets |
| A | 0 | 112 | 0 |
| B | 0 | 112 | 0 |
| C | 0 | 112 | 0 |
| D | 0 | 112 | 0 |
| Mode M9 | |||
|---|---|---|---|
| Quadrant | BADHDUFLAG | Total packets | Discarded packets |
| A | 0 | 26 | 0 |
| B | 0 | 26 | 0 |
| C | 0 | 26 | 0 |
| D | 0 | 27 | 0 |
| Mode M0 | |||
|---|---|---|---|
| Quadrant | BADHDUFLAG | Total packets | Discarded packets |
| A | 0 | 11432 | 3 |
| B | 0 | 13075 | 2 |
| C | 0 | 12002 | 2 |
| D | 0 | 23400 | 2 |
| Quadrant | Total seconds | Saturated seconds | Saturation percentage |
|---|---|---|---|
| A | 5542 | 13 | 0.234572% |
| B | 5542 | 146 | 2.634428% |
| C | 5542 | 21 | 0.378925% |
| D | 5542 | 851 | 15.355467% |
Noise dominated data is calculated using 1-second bins in cleaned event files. If a bin has >2000 counts, and if more than 50% of those come from <1% of pixels, then it is considered to be noise-dominated and hence unusable.
| Quadrant | # 1 sec bins | Bins with >0 counts | Bins with >2000 counts | High rate bins dominated by noise | Noise dominated (total time) | Noise dominated (detector-on time) | Marked lightcurve |
|---|---|---|---|---|---|---|---|
| A | 7215 | 5543 | 1 | 1 | 0.01% | 0.02% | 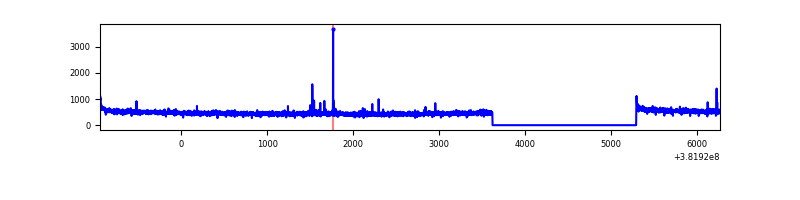 |
| B | 7215 | 5543 | 104 | 104 | 1.44% | 1.88% | 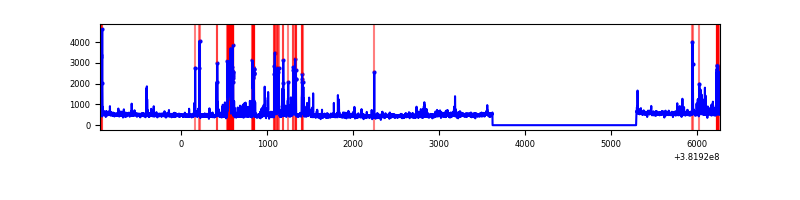 |
| C | 7215 | 5543 | 9 | 9 | 0.12% | 0.16% | 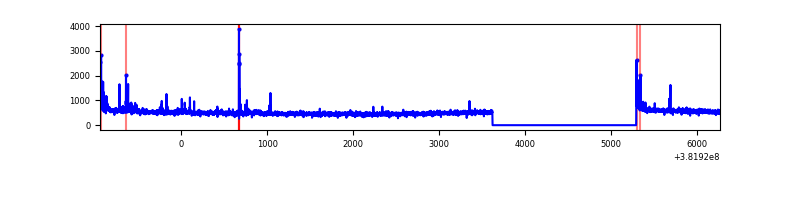 |
| D | 7215 | 5543 | 784 | 784 | 10.87% | 14.14% | 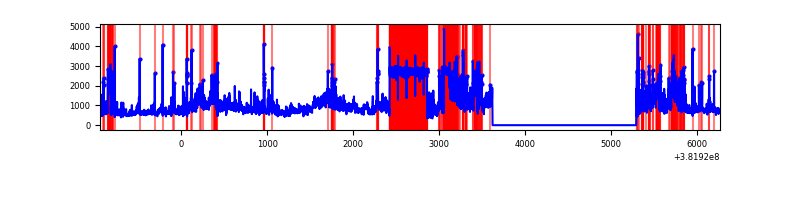 |
Top three noisy pixels from each quadrant. If the there are fewer than three noisy pixels in the level2.evt file, extra rows are filled as -1
| Pixel properties | Quadrant properties | ||||||
|---|---|---|---|---|---|---|---|
| Quadrant | DetID | PixID | Counts | Sigma | Mean | Median | Sigma |
| A | 10 | 83 | 35145 | 256.27 | 663 | 650 | 134.6 |
| A | 9 | 143 | 23736 | 171.51 | 663 | 650 | 134.6 |
| A | 13 | 254 | 10175 | 70.76 | 663 | 650 | 134.6 |
| B | 5 | 172 | 506333 | 4032.39 | 652 | 634 | 125.4 |
| B | 0 | 190 | 72423 | 572.44 | 652 | 634 | 125.4 |
| B | 5 | 255 | 43927 | 345.21 | 652 | 634 | 125.4 |
| C | 15 | 214 | 233848 | 1569.93 | 640 | 646 | 148.5 |
| C | 0 | 10 | 64632 | 430.76 | 640 | 646 | 148.5 |
| C | 14 | 254 | 51317 | 341.12 | 640 | 646 | 148.5 |
| D | 7 | 223 | 1951387 | 13200.8 | 601 | 584 | 147.8 |
| D | 8 | 195 | 933637 | 6313.83 | 601 | 584 | 147.8 |
| D | 2 | 249 | 335843 | 2268.65 | 601 | 584 | 147.8 |
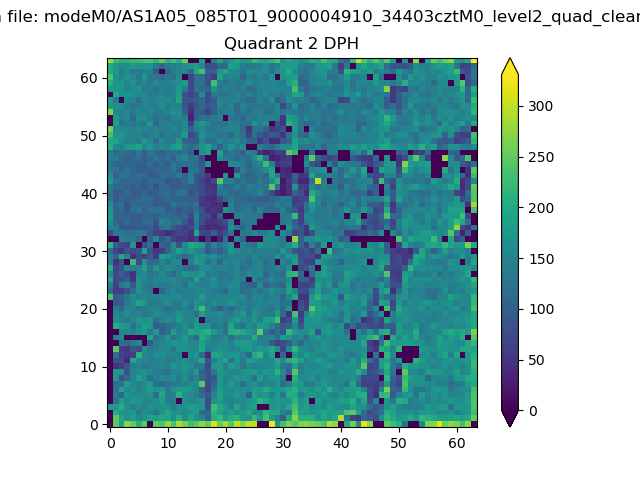
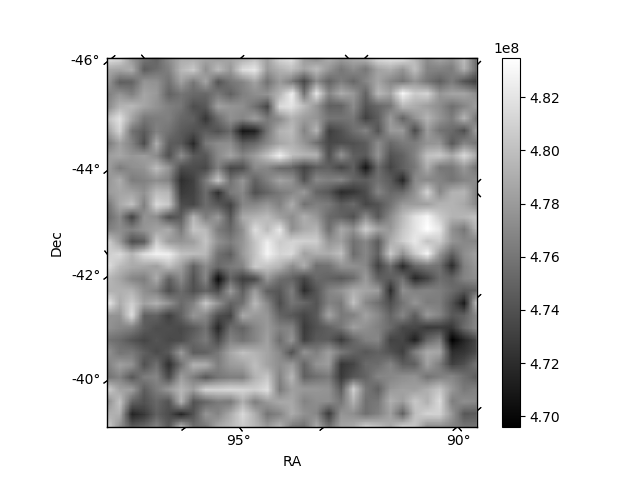
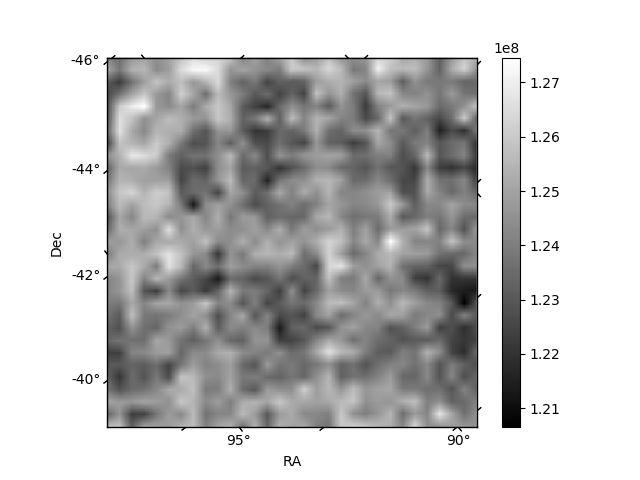
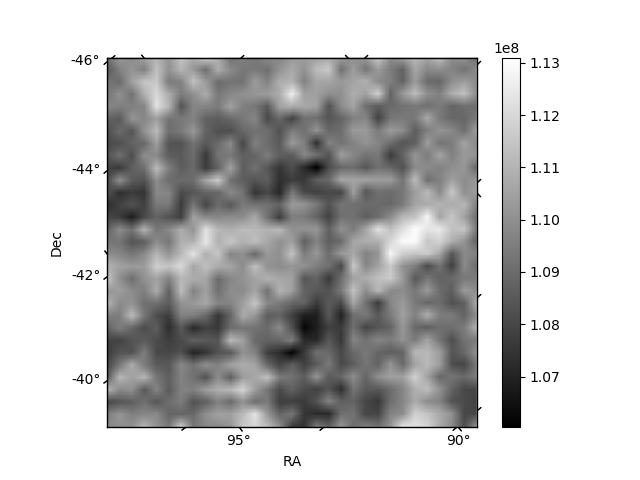
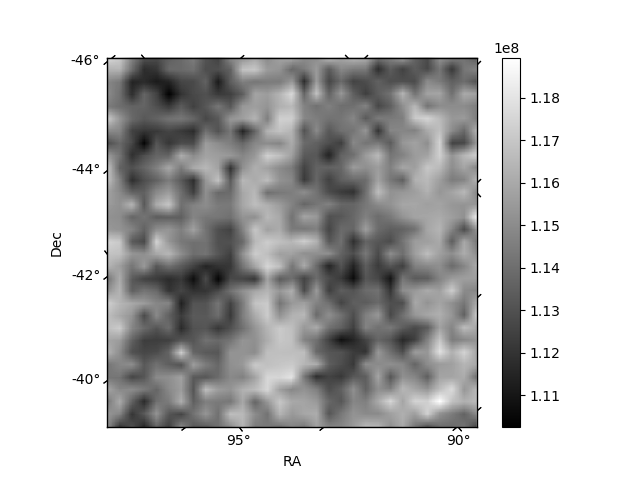
Histogram calculated using DETX and DETY for each event in the final _common_clean file
| Quadrant A | 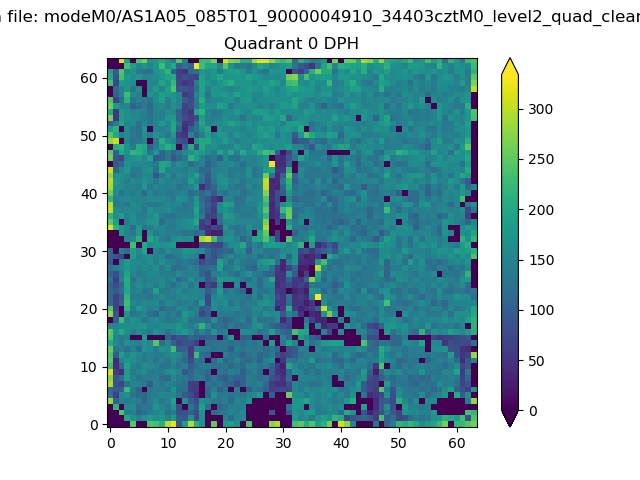 |
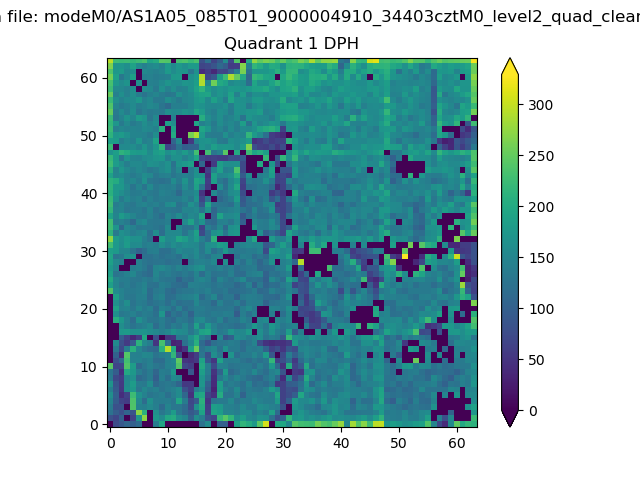 |
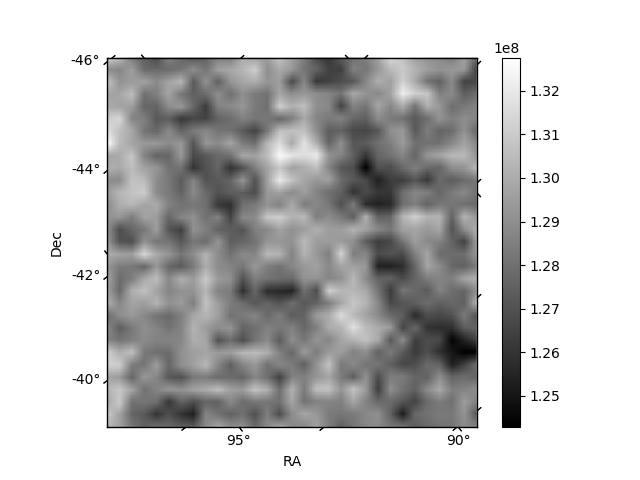
Quadrant B |
|---|---|---|---|
| Quadrant D | 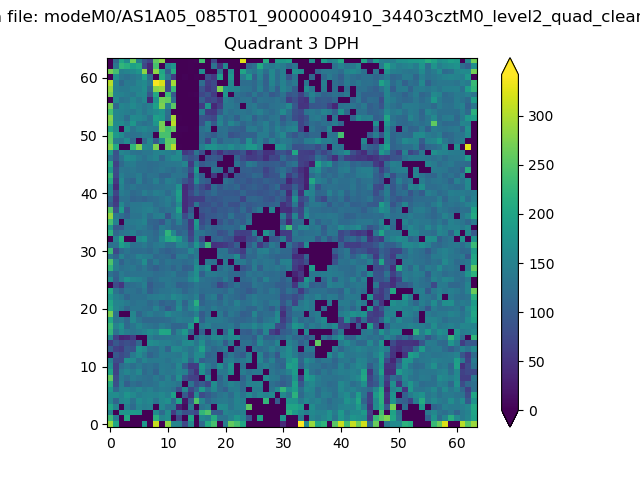 |
 |
Quadrant C |
| Plot type | Count rate plots | Images |
|---|---|---|
| Comparison with Poisson distribution Blue bars denote a histogram of data divided into 1 sec bins. Red curve is a Poisson curve with rate = median count rate of data. |
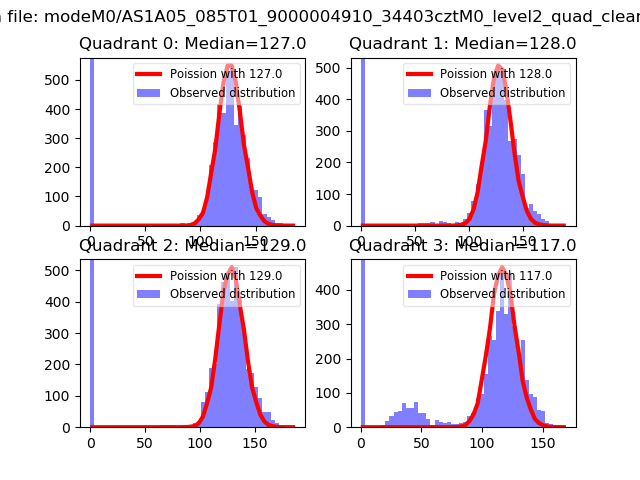 |
 |
| Quadrant-wise count rates Data is divided into 100 sec bins |
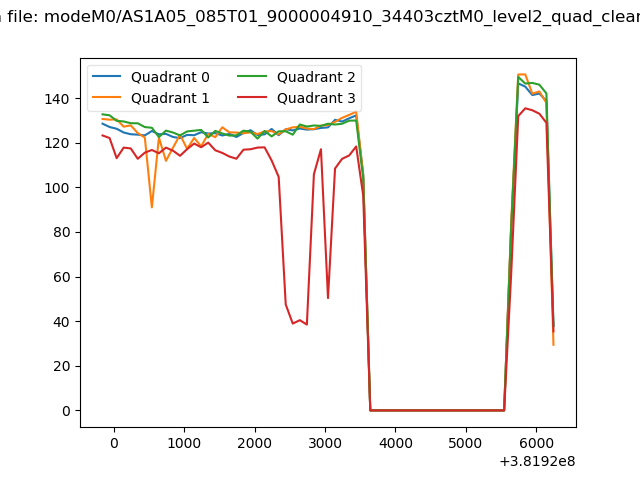 |
|
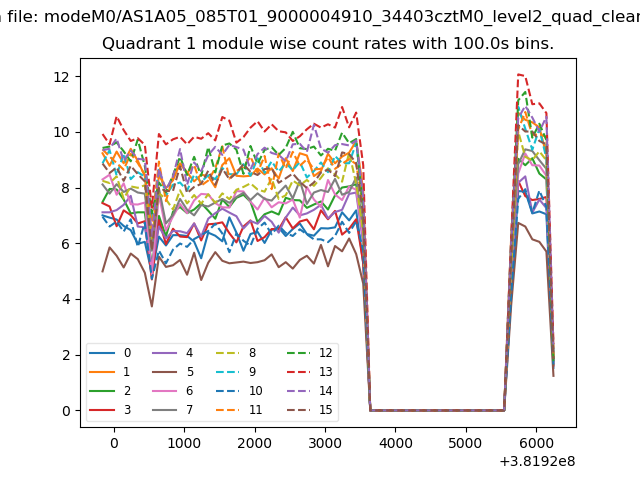
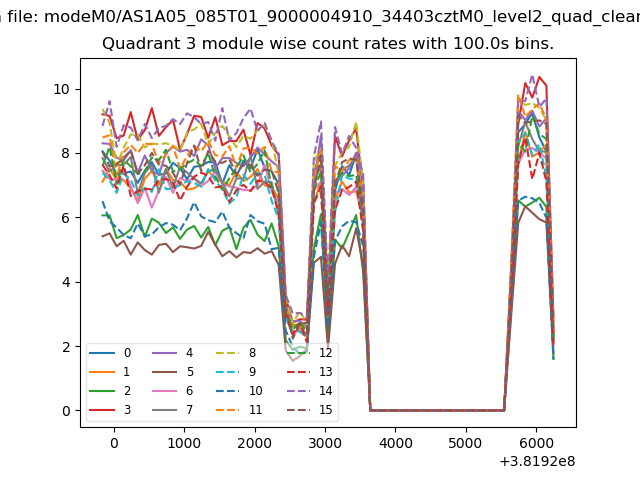
| Module-wise count rates for Quadrant A Data is divided into 100 sec bins |
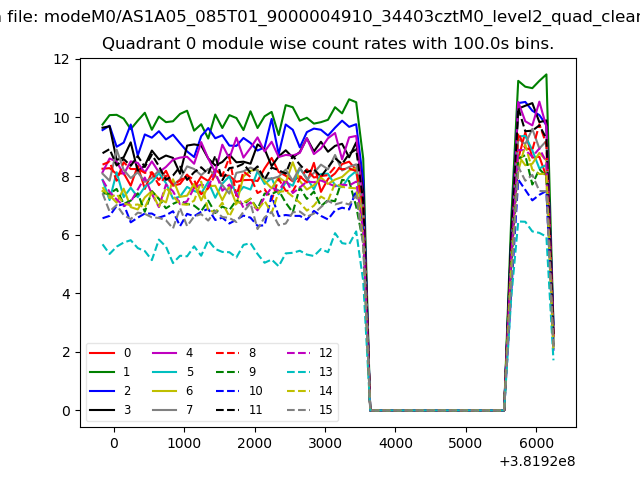 |
 |
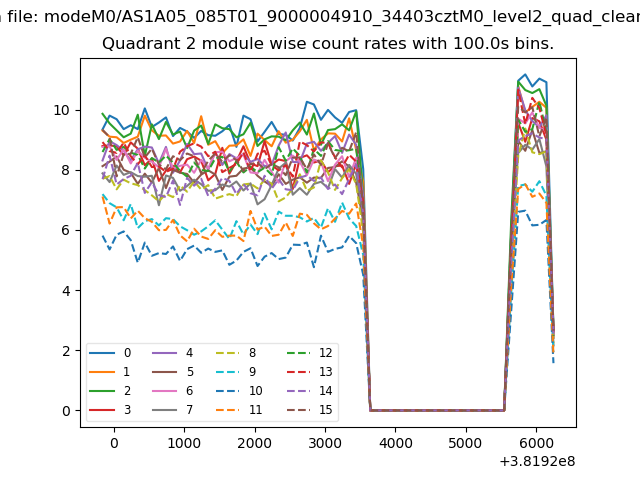
| Module-wise count rates for Quadrant B Data is divided into 100 sec bins |
 |
 |
| Module-wise count rates for Quadrant C Data is divided into 100 sec bins |
 |
 |
| Module-wise count rates for Quadrant D Data is divided into 100 sec bins |
 |
 |
| Parameter | Plot |
|---|---|
| CZT HV Monitor | 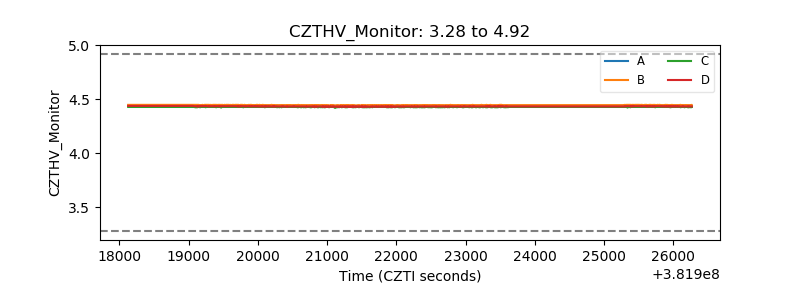 |
| D_VDD | 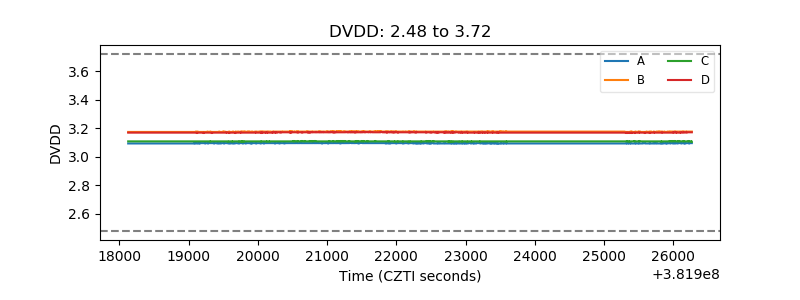 |
| Temperature 1 | 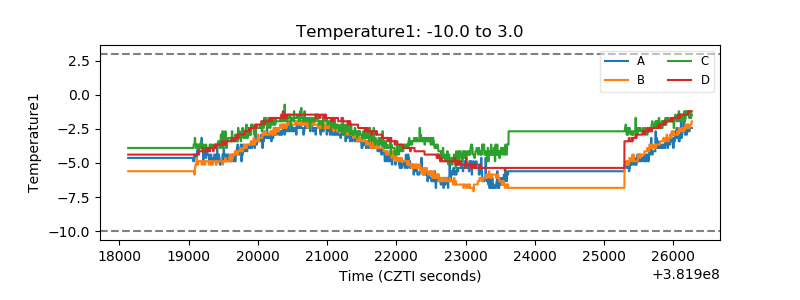 |
| Veto HV Monitor | 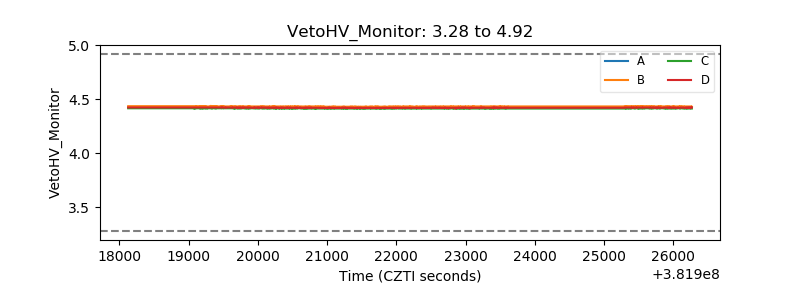 |
| Veto LLD | 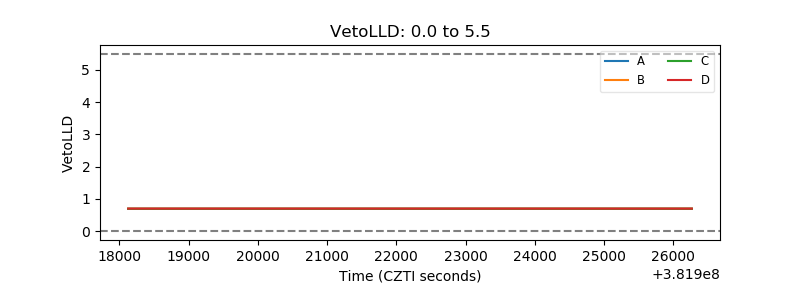 |
| Alpha Counter | 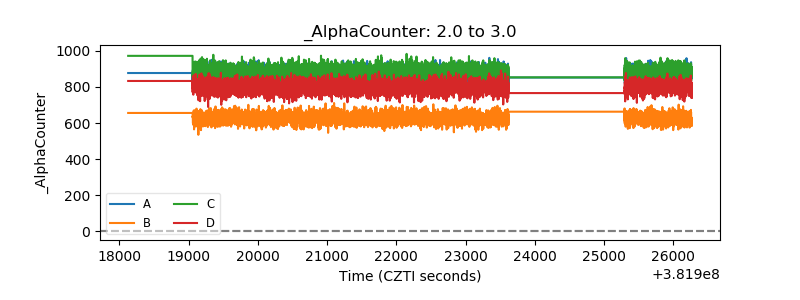 |
| _CPM_Rate | 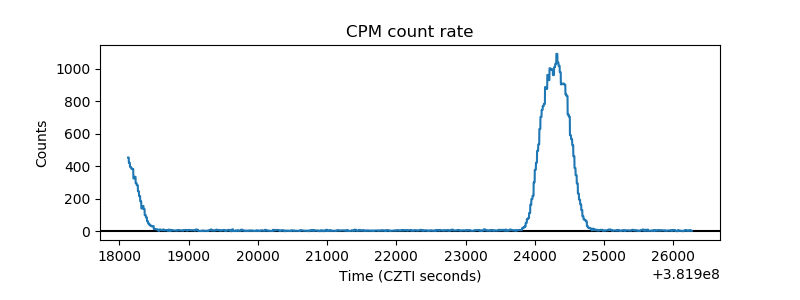 |
| CZT Counter | 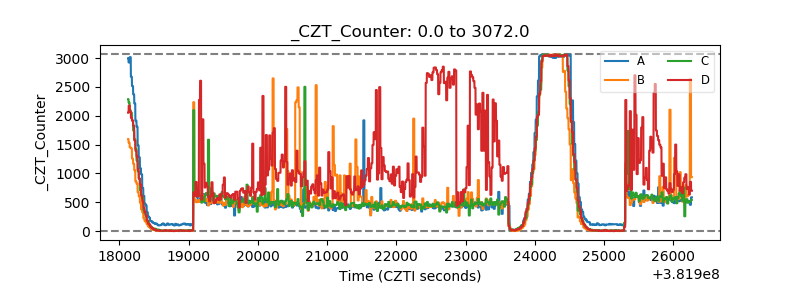 |
| +2.5 Volts monitor | 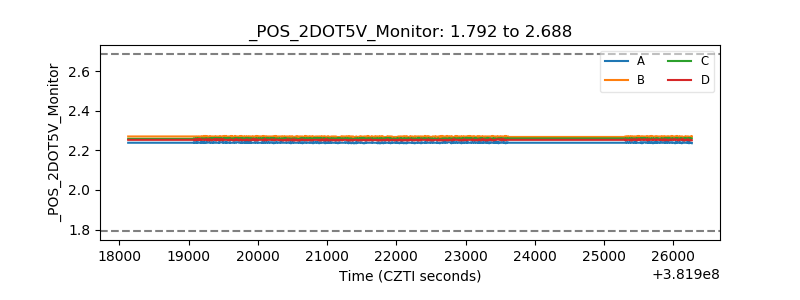 |
| +5 Volts monitor | 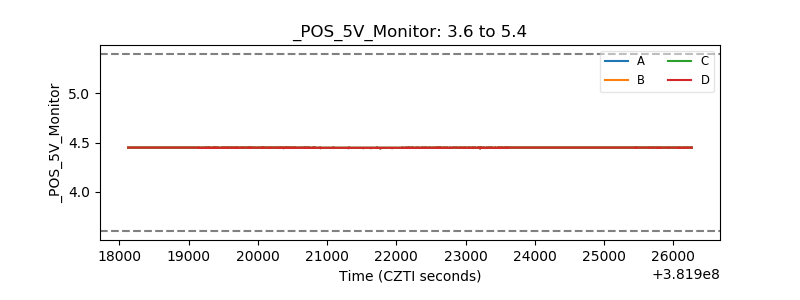 |
| _ROLL_ROT | 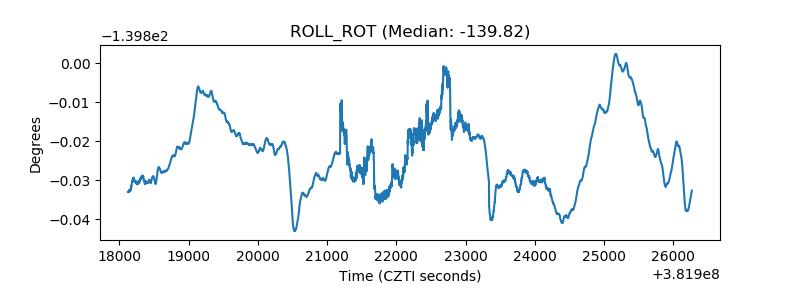 |
| _Roll_DEC | 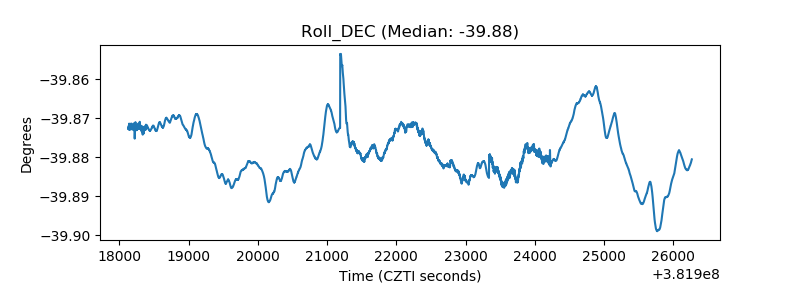 |
| _Roll_RA | 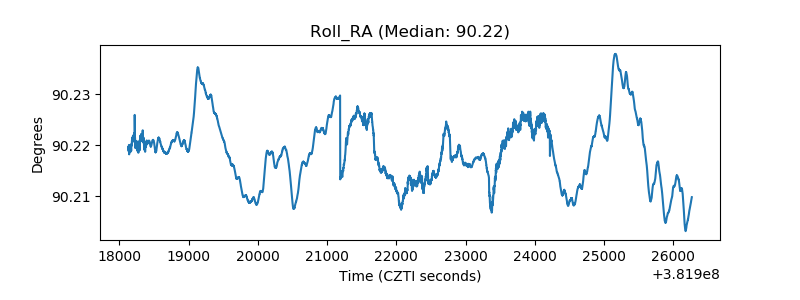 |
| Veto Counter | 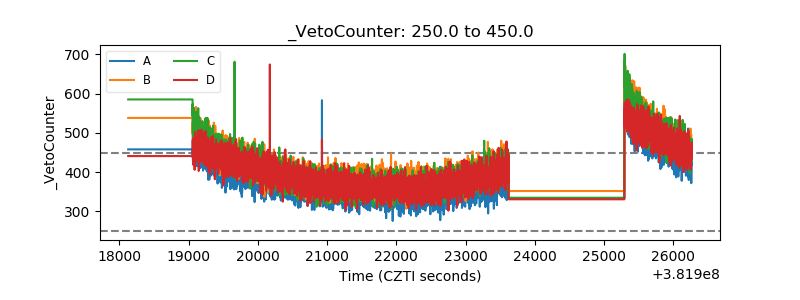 |