| Param | Original file | Final file |
|---|---|---|
| Filename | modeM0/AS1A05_085T01_9000004910_34391cztM0_level2.evt | modeM0/AS1A05_085T01_9000004910_34391cztM0_level2_quad_clean.evt |
| Size (bytes) | 582,079,680 | 103,415,040 |
| Size | 555.1 MB | 98.6 MB |
| Events in quadrant A | 2,824,544 | 738,016 |
| Events in quadrant B | 4,256,062 | 707,075 |
| Events in quadrant C | 2,995,048 | 721,046 |
| Events in quadrant D | 7,172,997 | 573,097 |
| Mode SS | |||
|---|---|---|---|
| Quadrant | BADHDUFLAG | Total packets | Discarded packets |
| A | 0 | 114 | 0 |
| B | 0 | 114 | 0 |
| C | 0 | 114 | 0 |
| D | 0 | 114 | 0 |
| Mode M9 | |||
|---|---|---|---|
| Quadrant | BADHDUFLAG | Total packets | Discarded packets |
| A | 0 | 35 | 0 |
| B | 0 | 35 | 0 |
| C | 0 | 35 | 0 |
| D | 0 | 35 | 0 |
| Mode M0 | |||
|---|---|---|---|
| Quadrant | BADHDUFLAG | Total packets | Discarded packets |
| A | 0 | 11986 | 3 |
| B | 0 | 16313 | 2 |
| C | 0 | 12337 | 2 |
| D | 0 | 25117 | 2 |
| Quadrant | Total seconds | Saturated seconds | Saturation percentage |
|---|---|---|---|
| A | 5606 | 23 | 0.410275% |
| B | 5606 | 518 | 9.240100% |
| C | 5606 | 43 | 0.767035% |
| D | 5606 | 1385 | 24.705672% |
Noise dominated data is calculated using 1-second bins in cleaned event files. If a bin has >2000 counts, and if more than 50% of those come from <1% of pixels, then it is considered to be noise-dominated and hence unusable.
| Quadrant | # 1 sec bins | Bins with >0 counts | Bins with >2000 counts | High rate bins dominated by noise | Noise dominated (total time) | Noise dominated (detector-on time) | Marked lightcurve |
|---|---|---|---|---|---|---|---|
| A | 7488 | 5607 | 14 | 14 | 0.19% | 0.25% | 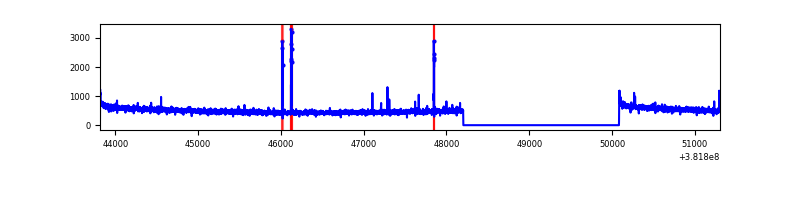 |
| B | 7488 | 5607 | 387 | 387 | 5.17% | 6.90% | 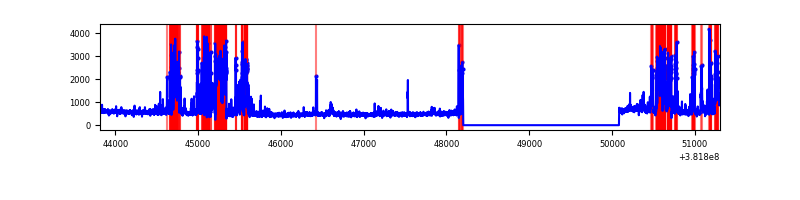 |
| C | 7488 | 5607 | 29 | 29 | 0.39% | 0.52% | 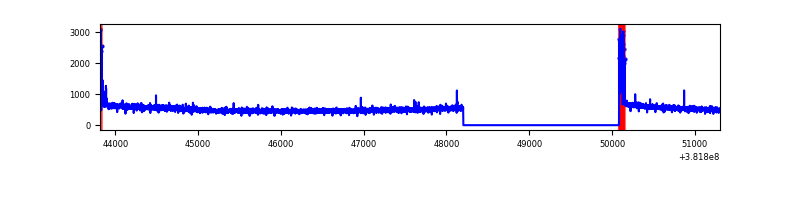 |
| D | 7488 | 5607 | 1341 | 1341 | 17.91% | 23.92% | 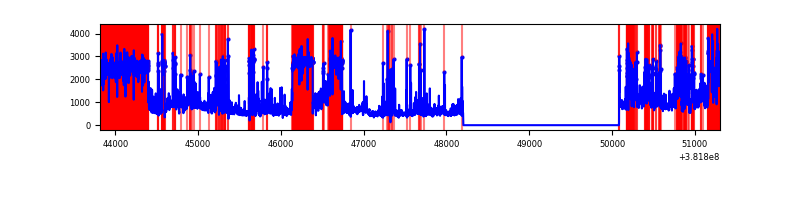 |
Top three noisy pixels from each quadrant. If the there are fewer than three noisy pixels in the level2.evt file, extra rows are filled as -1
| Pixel properties | Quadrant properties | ||||||
|---|---|---|---|---|---|---|---|
| Quadrant | DetID | PixID | Counts | Sigma | Mean | Median | Sigma |
| A | 9 | 143 | 49014 | 342.28 | 707 | 697 | 141.2 |
| A | 10 | 83 | 34324 | 238.22 | 707 | 697 | 141.2 |
| A | 13 | 254 | 10751 | 71.22 | 707 | 697 | 141.2 |
| B | 5 | 172 | 1439089 | 11256.44 | 674 | 659 | 127.8 |
| B | 0 | 190 | 72571 | 562.75 | 674 | 659 | 127.8 |
| B | 5 | 200 | 21122 | 160.13 | 674 | 659 | 127.8 |
| C | 15 | 214 | 235975 | 1518.95 | 670 | 676 | 154.9 |
| C | 0 | 10 | 112256 | 720.29 | 670 | 676 | 154.9 |
| C | 14 | 67 | 20281 | 126.56 | 670 | 676 | 154.9 |
| D | 7 | 223 | 2241232 | 15605.49 | 591 | 578 | 143.6 |
| D | 12 | 235 | 819962 | 5706.77 | 591 | 578 | 143.6 |
| D | 8 | 195 | 583359 | 4058.9 | 591 | 578 | 143.6 |
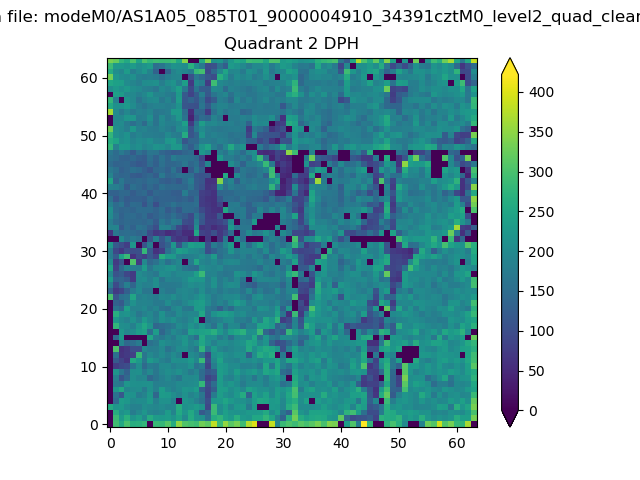
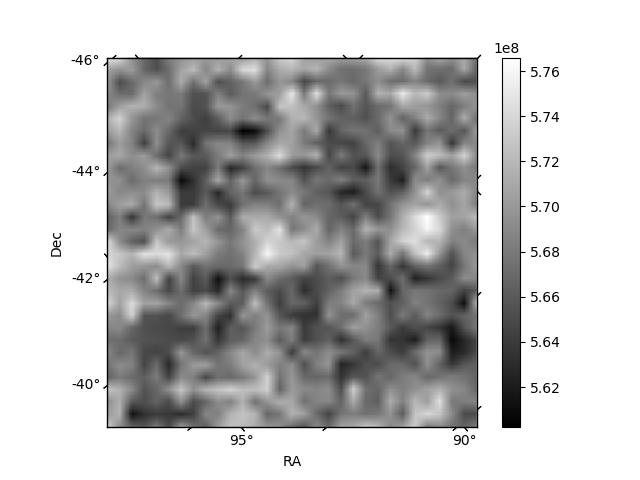
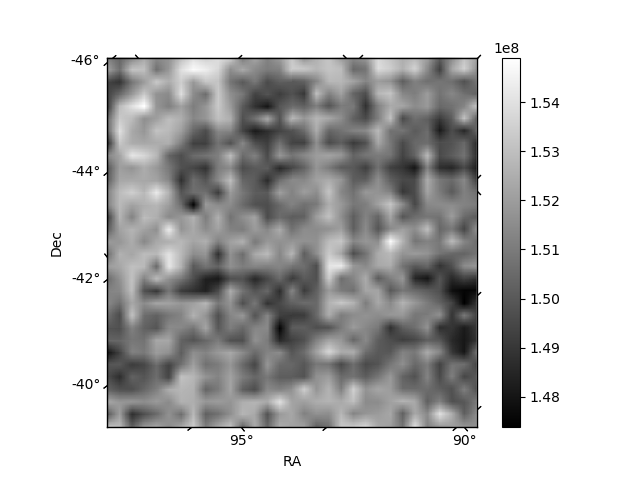
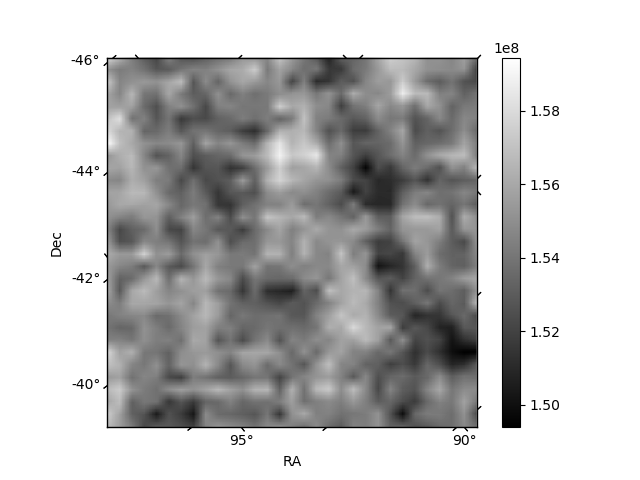
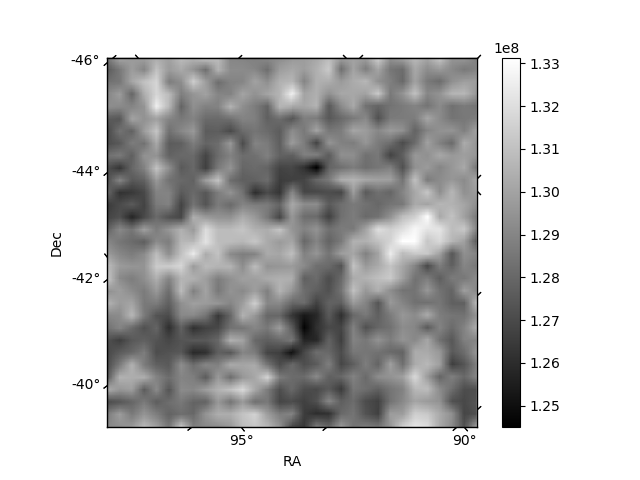
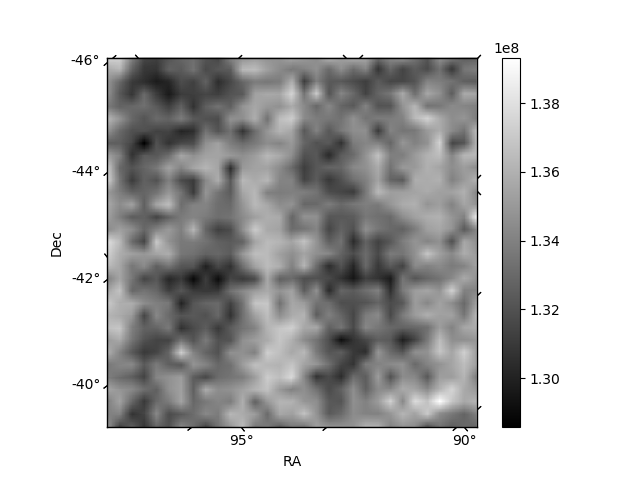
Histogram calculated using DETX and DETY for each event in the final _common_clean file
| Quadrant A | 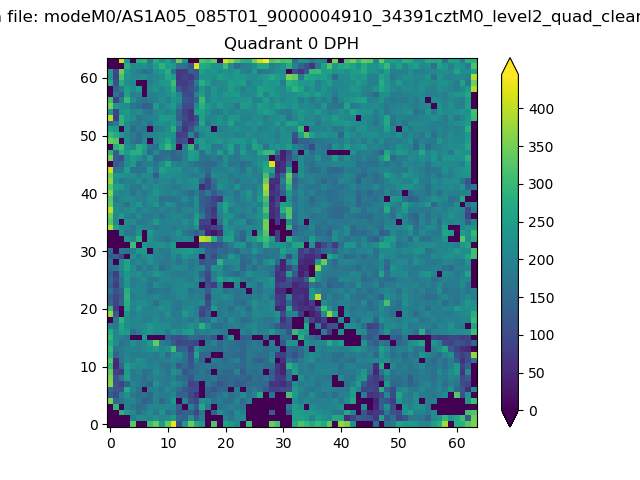 |
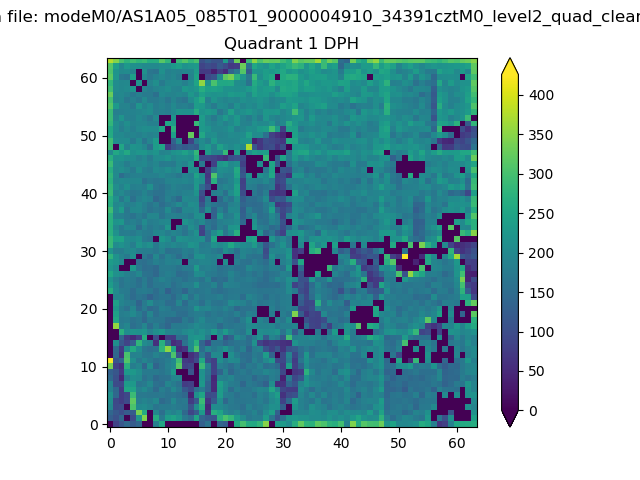 |
Quadrant B |
|---|---|---|---|
| Quadrant D | 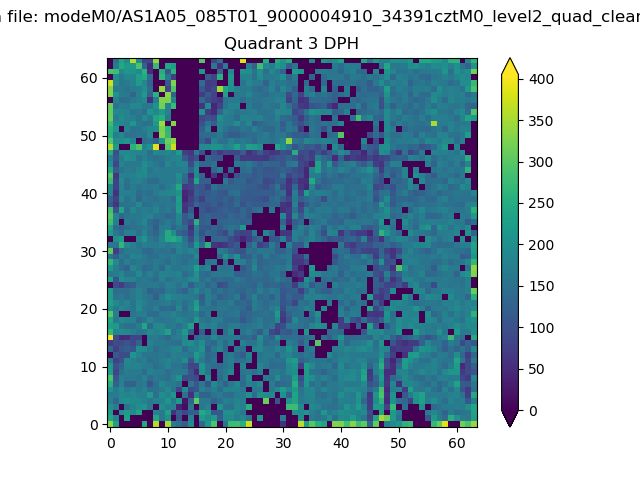 |
 |
Quadrant C |
| Plot type | Count rate plots | Images |
|---|---|---|
| Comparison with Poisson distribution Blue bars denote a histogram of data divided into 1 sec bins. Red curve is a Poisson curve with rate = median count rate of data. |
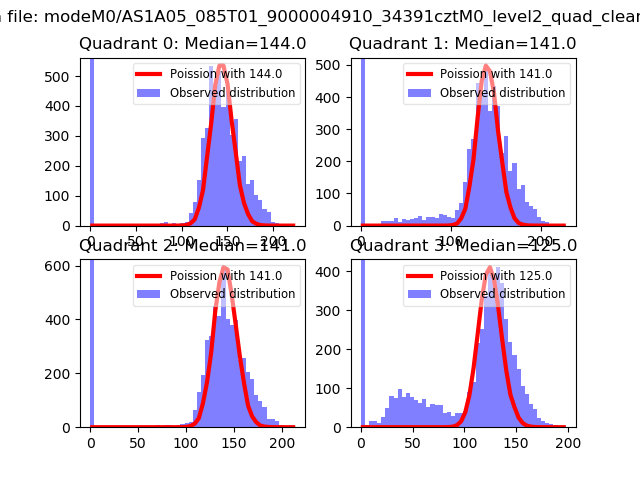 |
 |
| Quadrant-wise count rates Data is divided into 100 sec bins |
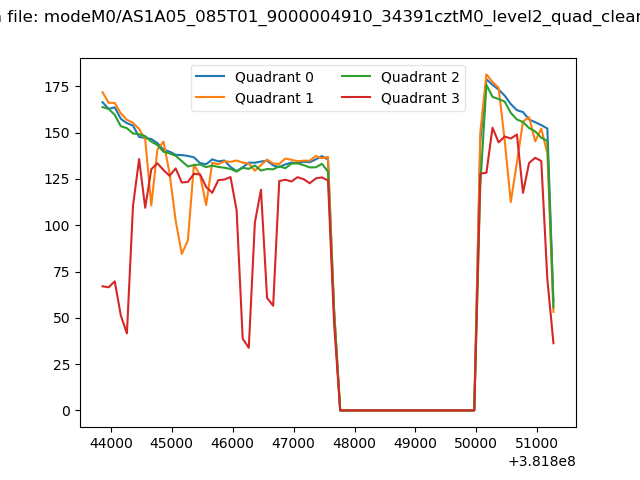 |
|
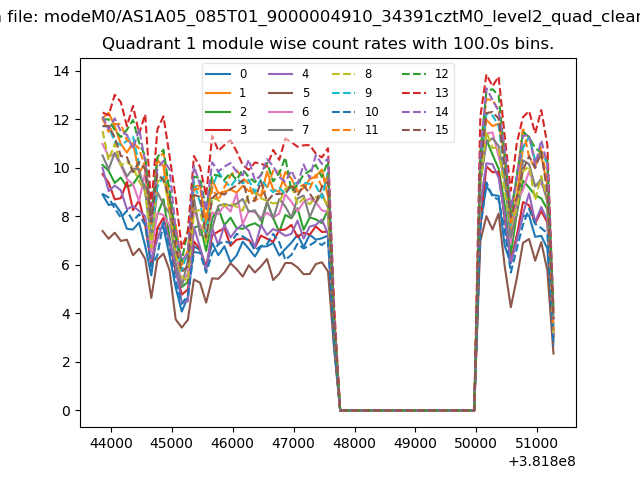
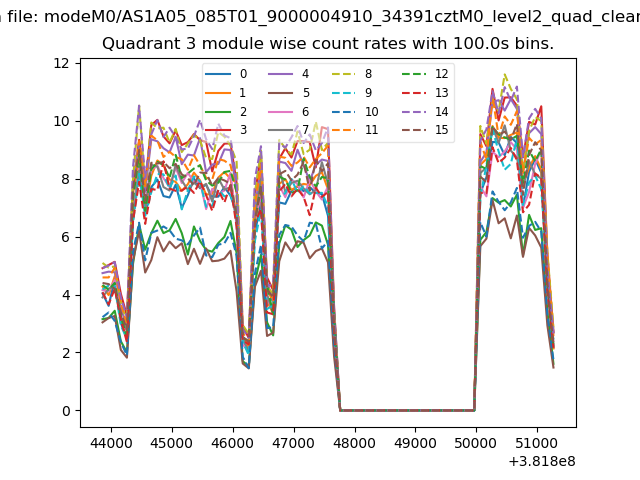
| Module-wise count rates for Quadrant A Data is divided into 100 sec bins |
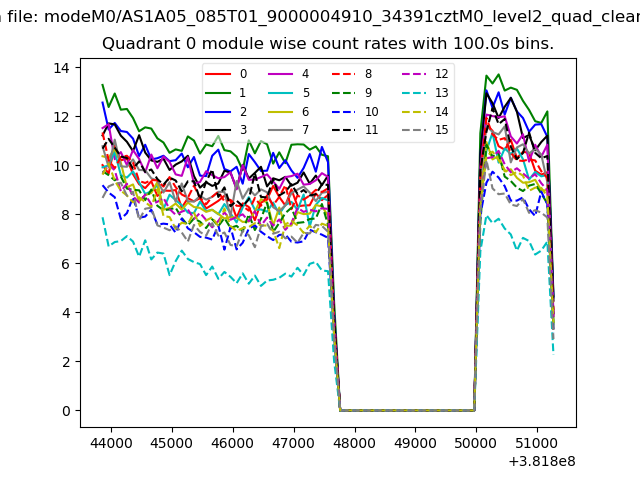 |
 |
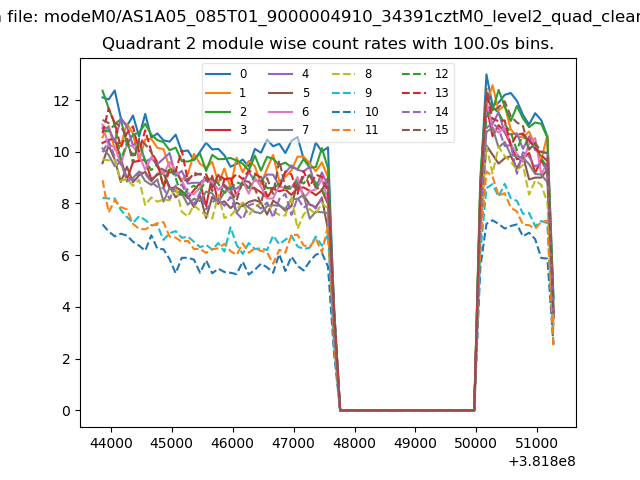
| Module-wise count rates for Quadrant B Data is divided into 100 sec bins |
 |
 |
| Module-wise count rates for Quadrant C Data is divided into 100 sec bins |
 |
 |
| Module-wise count rates for Quadrant D Data is divided into 100 sec bins |
 |
 |
| Parameter | Plot |
|---|---|
| CZT HV Monitor | 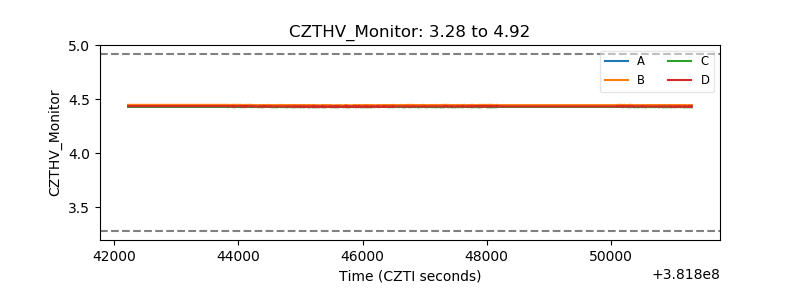 |
| D_VDD | 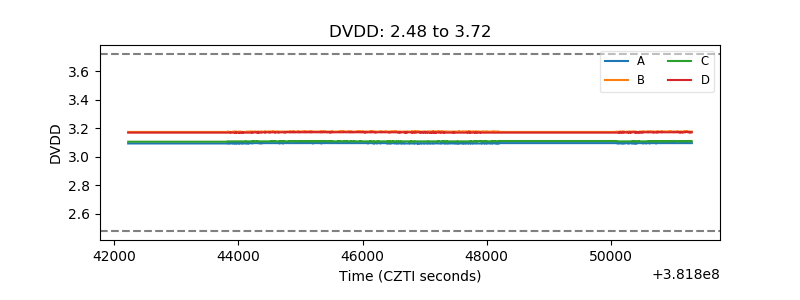 |
| Temperature 1 | 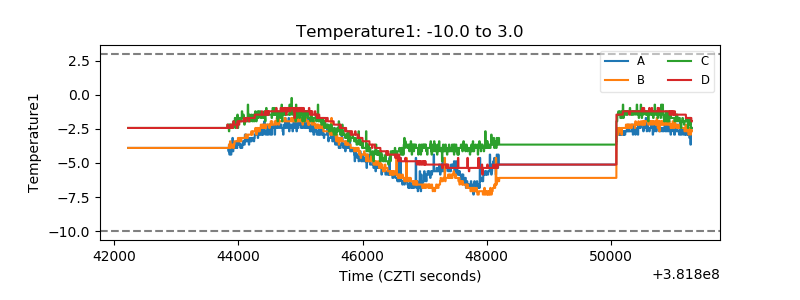 |
| Veto HV Monitor | 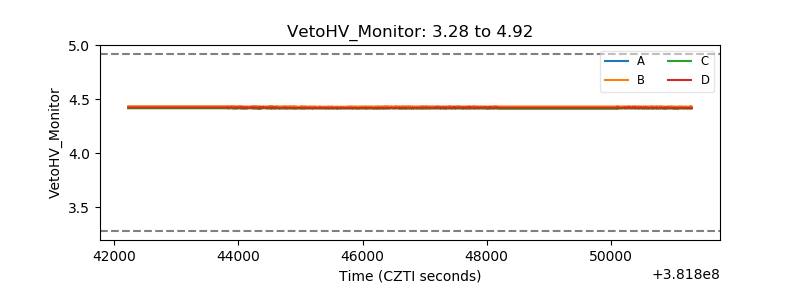 |
| Veto LLD | 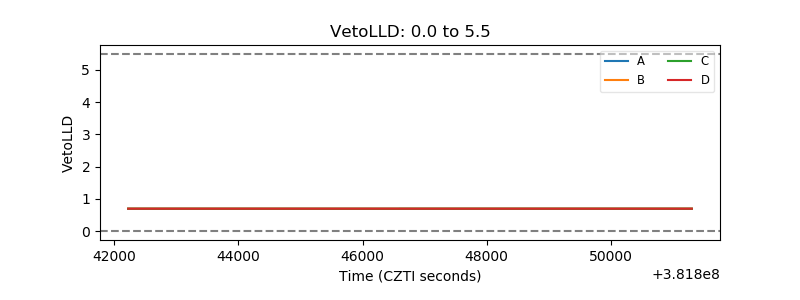 |
| Alpha Counter | 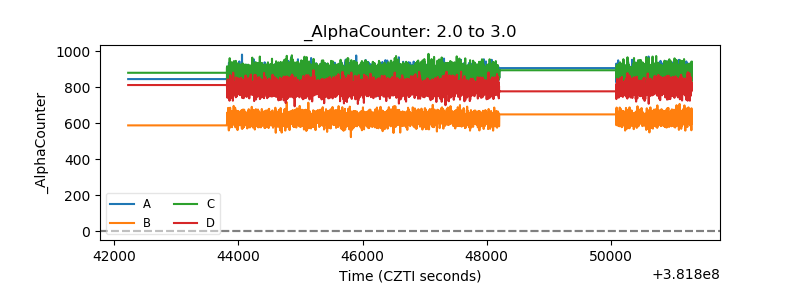 |
| _CPM_Rate | 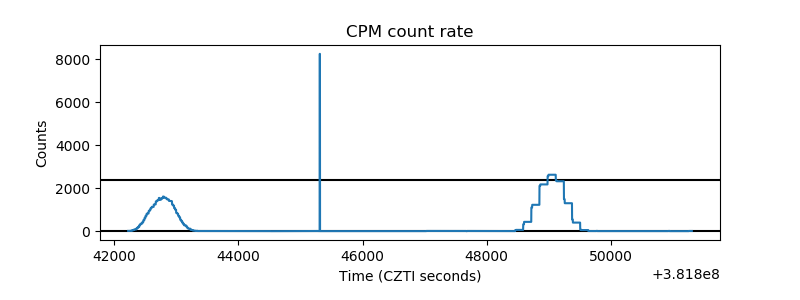 |
| CZT Counter | 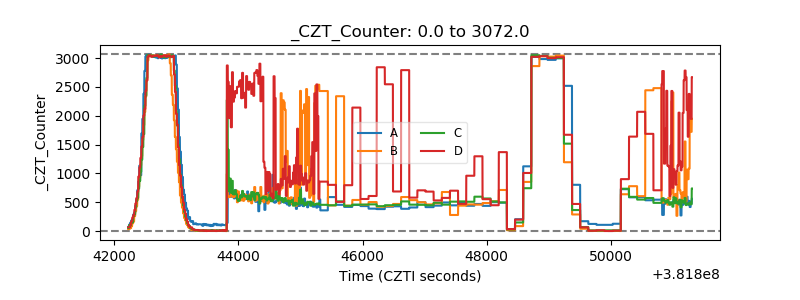 |
| +2.5 Volts monitor | 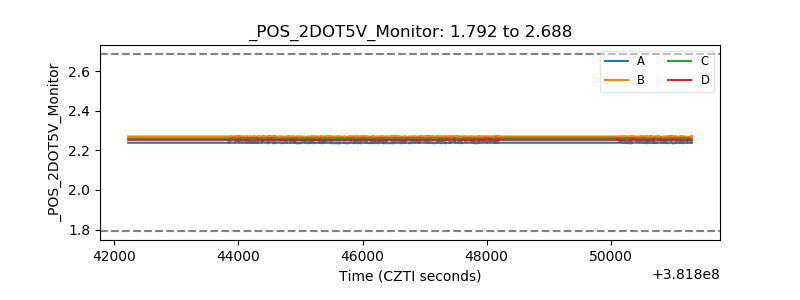 |
| +5 Volts monitor | 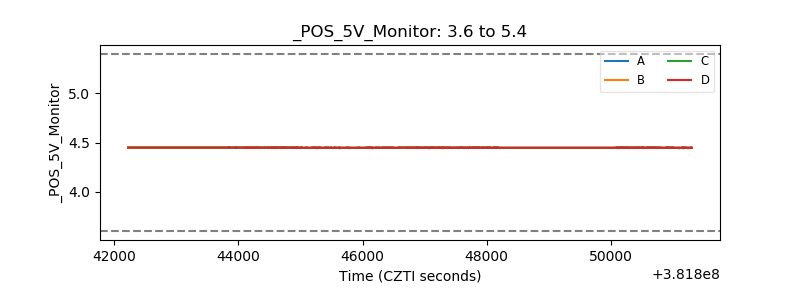 |
| _ROLL_ROT | 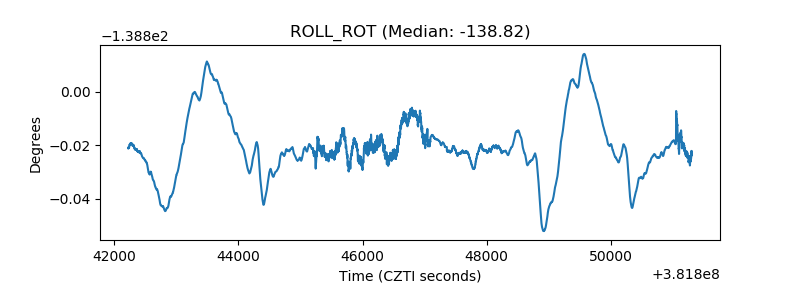 |
| _Roll_DEC | 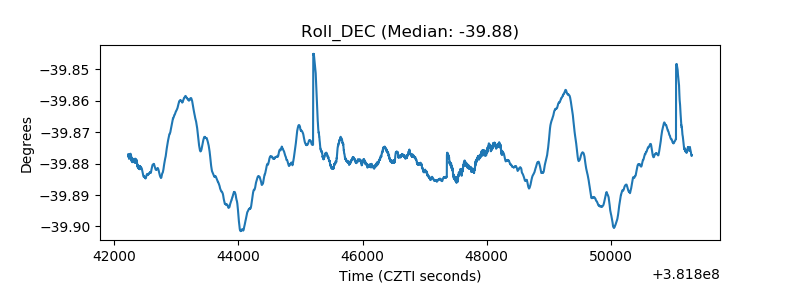 |
| _Roll_RA | 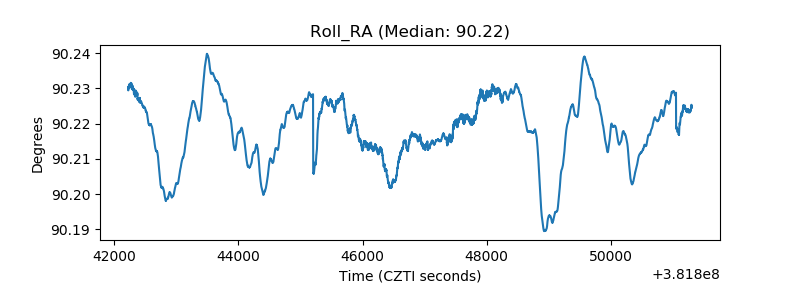 |
| Veto Counter | 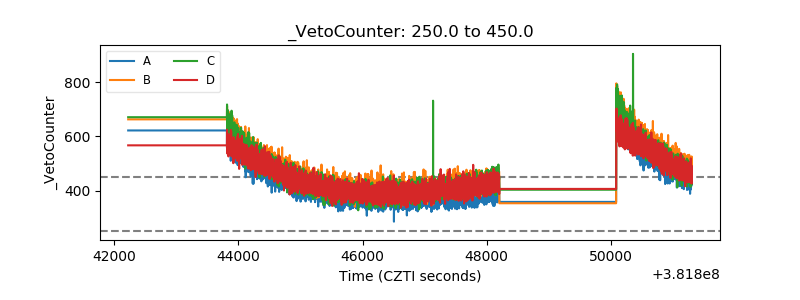 |