| Param | Original file | Final file |
|---|---|---|
| Filename | modeM0/AS1A05_085T01_9000004910_34390cztM0_level2.evt | modeM0/AS1A05_085T01_9000004910_34390cztM0_level2_quad_clean.evt |
| Size (bytes) | 649,886,400 | 86,313,600 |
| Size | 619.8 MB | 82.3 MB |
| Events in quadrant A | 2,566,187 | 619,686 |
| Events in quadrant B | 2,989,236 | 624,920 |
| Events in quadrant C | 2,822,132 | 618,433 |
| Events in quadrant D | 10,940,937 | 373,881 |
| Mode SS | |||
|---|---|---|---|
| Quadrant | BADHDUFLAG | Total packets | Discarded packets |
| A | 0 | 110 | 0 |
| B | 0 | 110 | 0 |
| C | 0 | 110 | 0 |
| D | 0 | 110 | 0 |
| Mode M9 | |||
|---|---|---|---|
| Quadrant | BADHDUFLAG | Total packets | Discarded packets |
| A | 0 | 29 | 0 |
| B | 0 | 29 | 0 |
| C | 0 | 29 | 0 |
| D | 0 | 30 | 0 |
| Mode M0 | |||
|---|---|---|---|
| Quadrant | BADHDUFLAG | Total packets | Discarded packets |
| A | 0 | 11139 | 3 |
| B | 0 | 12325 | 2 |
| C | 0 | 11691 | 2 |
| D | 0 | 36161 | 2 |
| Quadrant | Total seconds | Saturated seconds | Saturation percentage |
|---|---|---|---|
| A | 5361 | 9 | 0.167879% |
| B | 5361 | 77 | 1.436299% |
| C | 5361 | 28 | 0.522291% |
| D | 5361 | 3489 | 65.081142% |
Noise dominated data is calculated using 1-second bins in cleaned event files. If a bin has >2000 counts, and if more than 50% of those come from <1% of pixels, then it is considered to be noise-dominated and hence unusable.
| Quadrant | # 1 sec bins | Bins with >0 counts | Bins with >2000 counts | High rate bins dominated by noise | Noise dominated (total time) | Noise dominated (detector-on time) | Marked lightcurve |
|---|---|---|---|---|---|---|---|
| A | 7124 | 5362 | 0 | 0 | 0.00% | 0.00% | 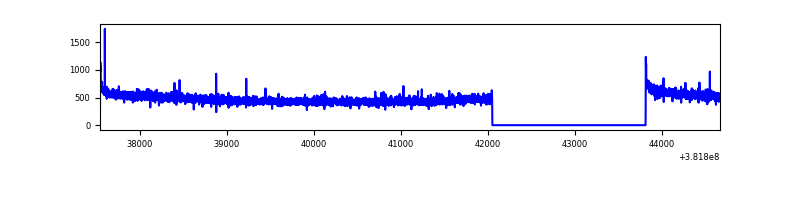 |
| B | 7124 | 5362 | 37 | 37 | 0.52% | 0.69% | 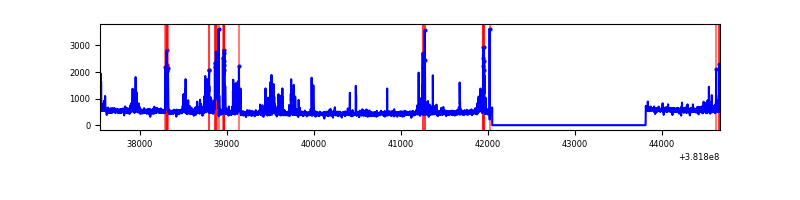 |
| C | 7124 | 5362 | 17 | 17 | 0.24% | 0.32% | 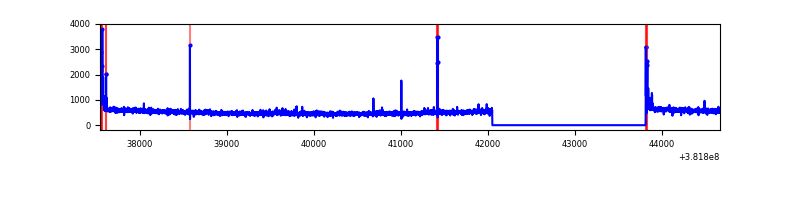 |
| D | 7124 | 5362 | 3298 | 3298 | 46.29% | 61.51% | 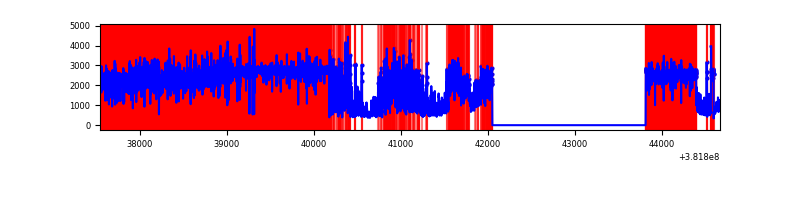 |
Top three noisy pixels from each quadrant. If the there are fewer than three noisy pixels in the level2.evt file, extra rows are filled as -1
| Pixel properties | Quadrant properties | ||||||
|---|---|---|---|---|---|---|---|
| Quadrant | DetID | PixID | Counts | Sigma | Mean | Median | Sigma |
| A | 10 | 83 | 33448 | 254.92 | 651 | 639 | 128.7 |
| A | 13 | 254 | 10021 | 72.9 | 651 | 639 | 128.7 |
| A | 13 | 6 | 8129 | 58.2 | 651 | 639 | 128.7 |
| B | 5 | 172 | 314060 | 2563.05 | 642 | 626 | 122.3 |
| B | 5 | 255 | 66285 | 536.91 | 642 | 626 | 122.3 |
| B | 5 | 200 | 37744 | 303.53 | 642 | 626 | 122.3 |
| C | 15 | 214 | 224543 | 1543.93 | 624 | 628 | 145.0 |
| C | 0 | 10 | 71150 | 486.26 | 624 | 628 | 145.0 |
| C | 14 | 67 | 57616 | 392.94 | 624 | 628 | 145.0 |
| D | 7 | 223 | 6826932 | 62366.32 | 448 | 435 | 109.5 |
| D | 12 | 235 | 856888 | 7824.49 | 448 | 435 | 109.5 |
| D | 2 | 249 | 718918 | 6564.0 | 448 | 435 | 109.5 |
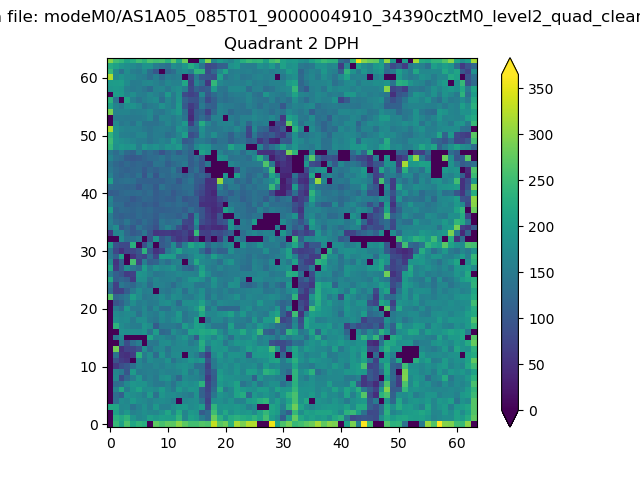
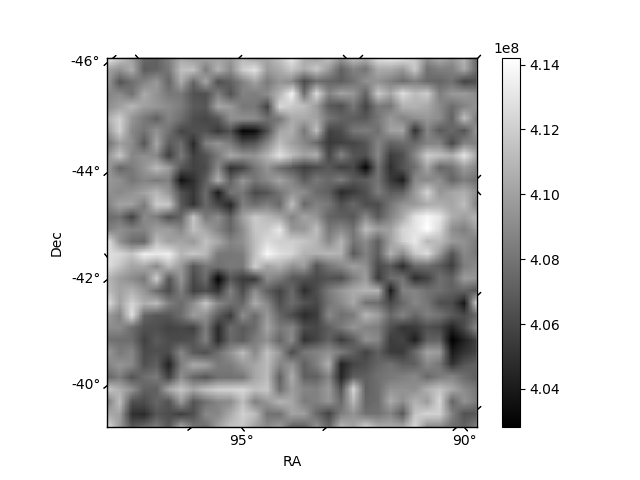
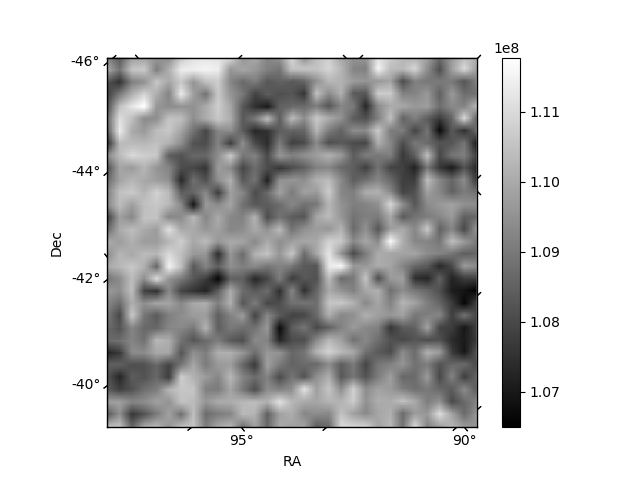
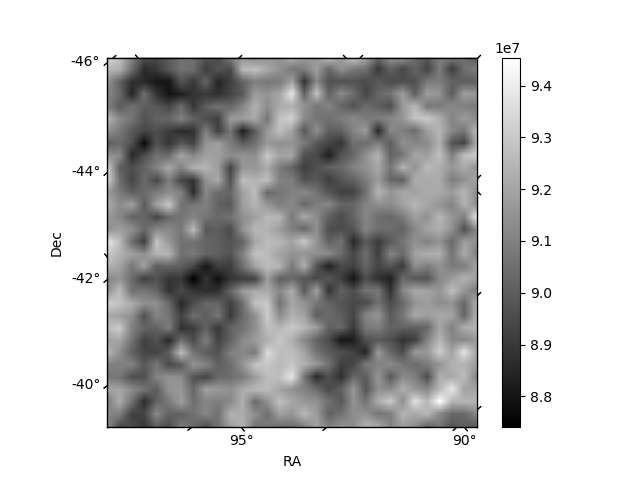
Histogram calculated using DETX and DETY for each event in the final _common_clean file
| Quadrant A | 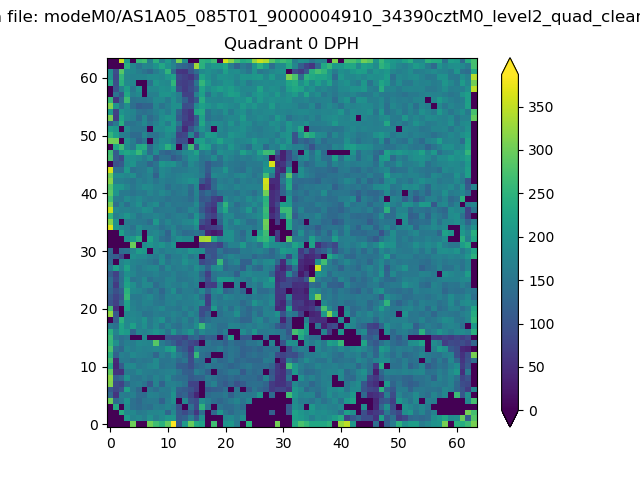 |
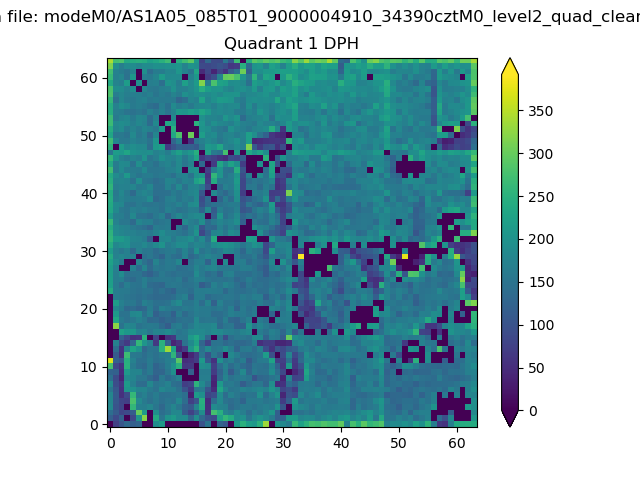 |
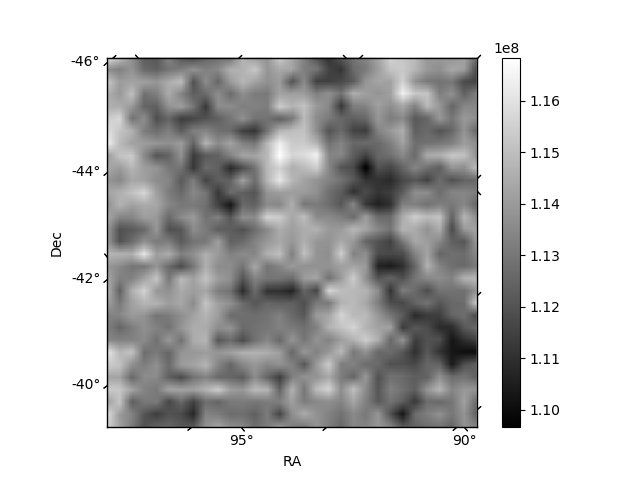
Quadrant B |
|---|---|---|---|
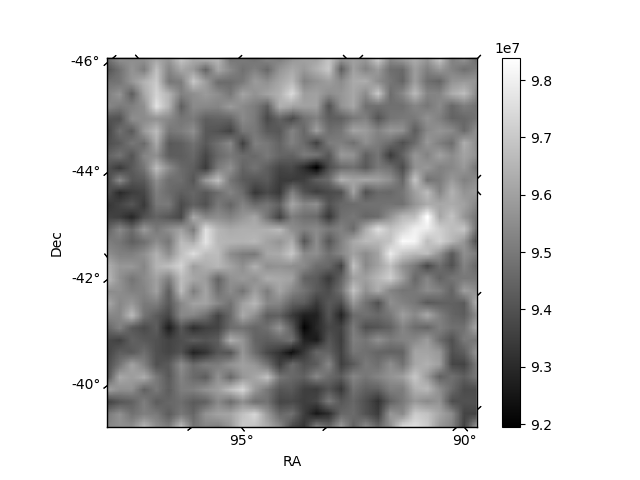
| Quadrant D | 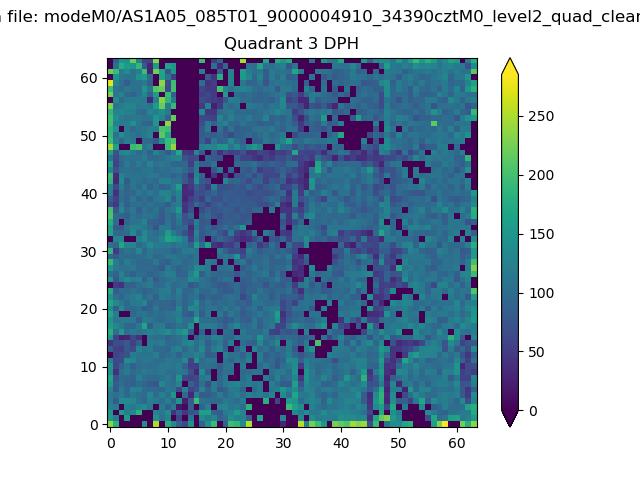 |
 |
Quadrant C |
| Plot type | Count rate plots | Images |
|---|---|---|
| Comparison with Poisson distribution Blue bars denote a histogram of data divided into 1 sec bins. Red curve is a Poisson curve with rate = median count rate of data. |
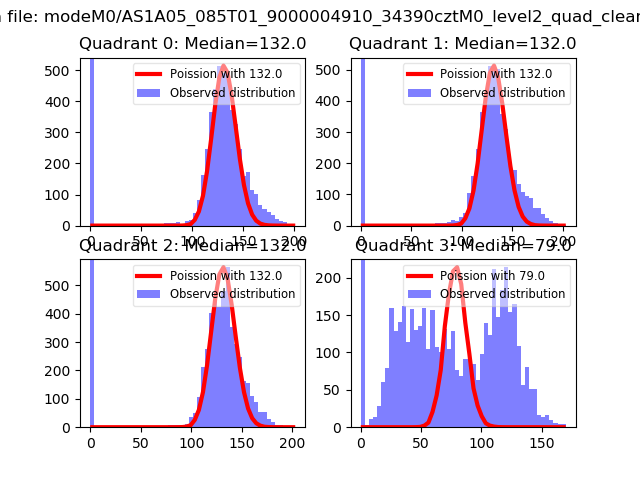 |
 |
| Quadrant-wise count rates Data is divided into 100 sec bins |
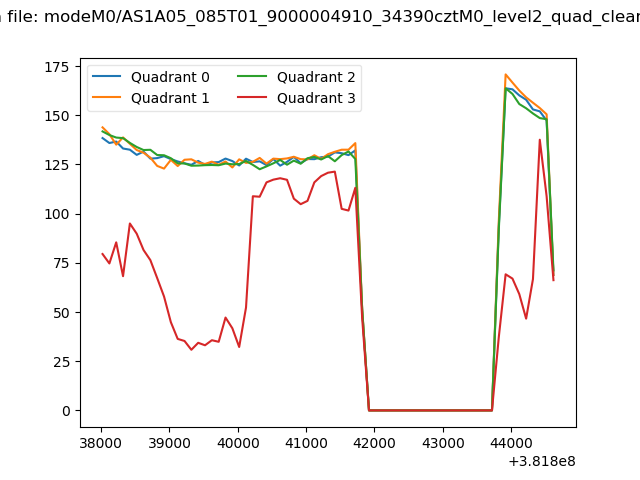 |
|
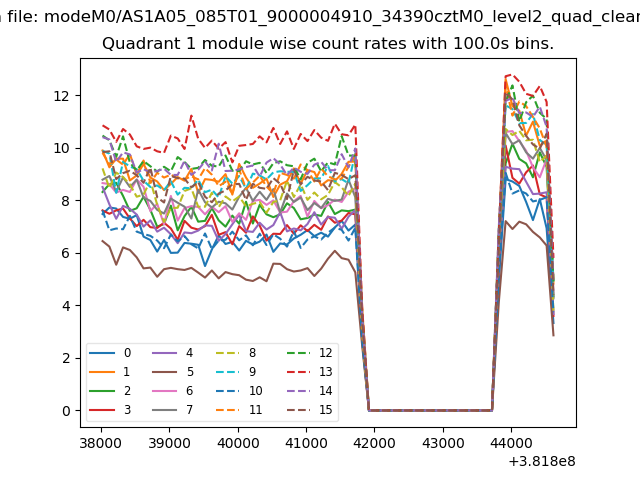
| Module-wise count rates for Quadrant A Data is divided into 100 sec bins |
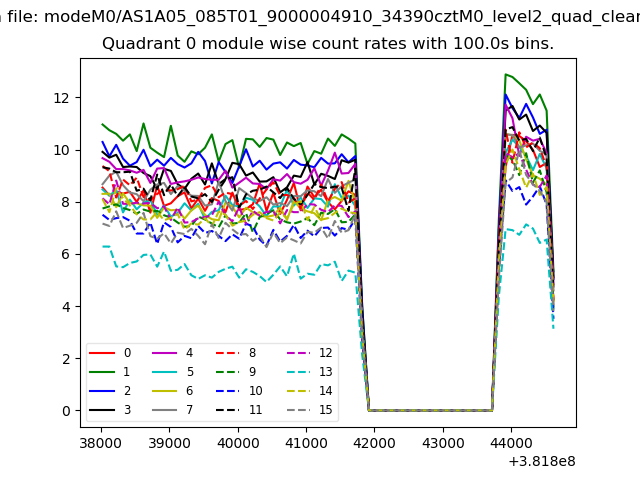 |
 |
| Module-wise count rates for Quadrant B Data is divided into 100 sec bins |
 |
 |
| Module-wise count rates for Quadrant C Data is divided into 100 sec bins |
 |
 |
| Module-wise count rates for Quadrant D Data is divided into 100 sec bins |
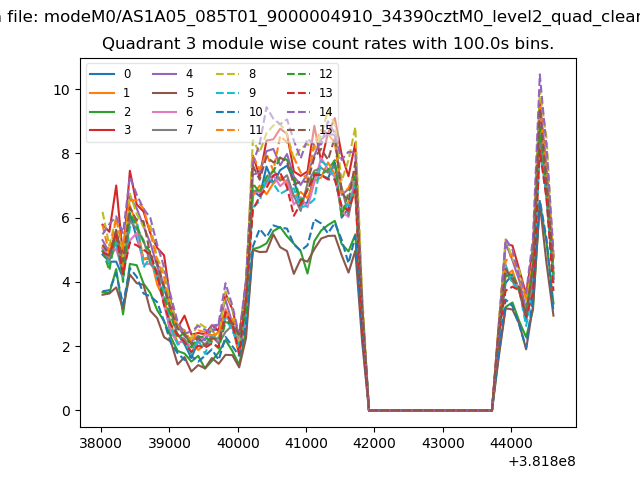 |
 |
| Parameter | Plot |
|---|---|
| CZT HV Monitor | 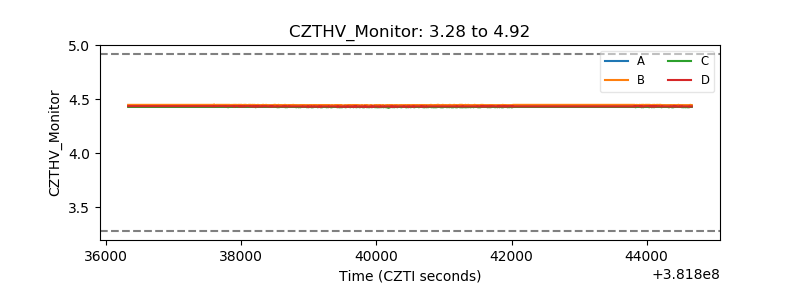 |
| D_VDD | 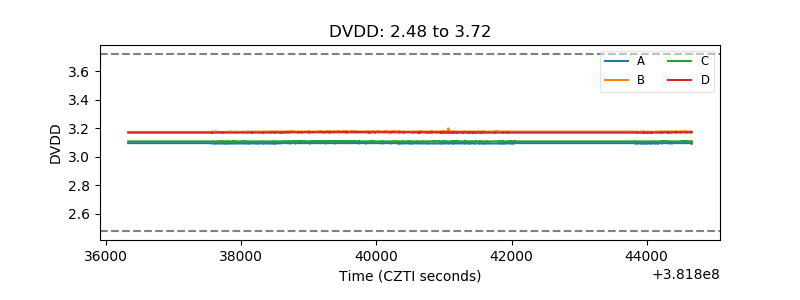 |
| Temperature 1 | 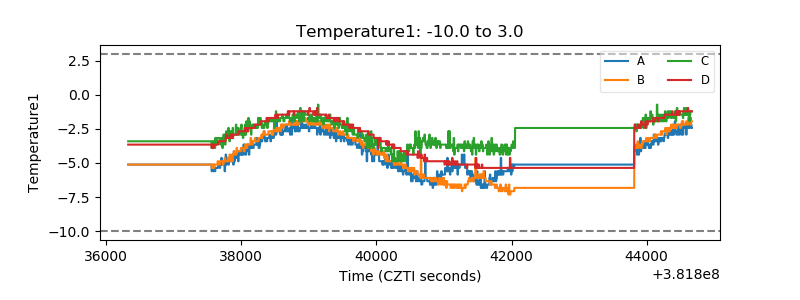 |
| Veto HV Monitor | 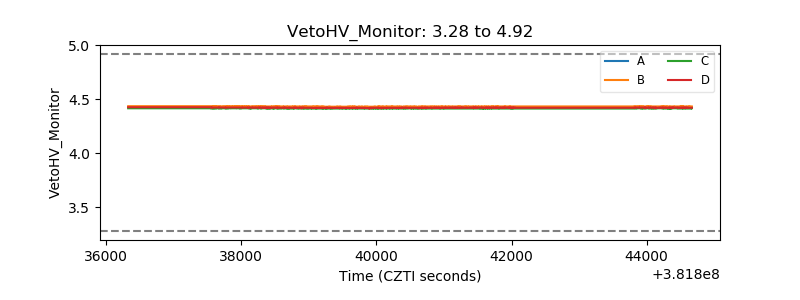 |
| Veto LLD | 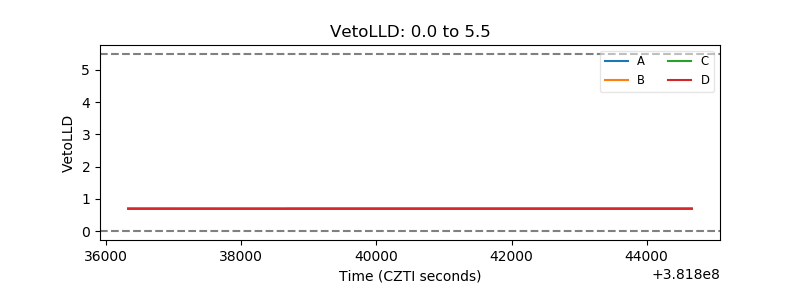 |
| Alpha Counter | 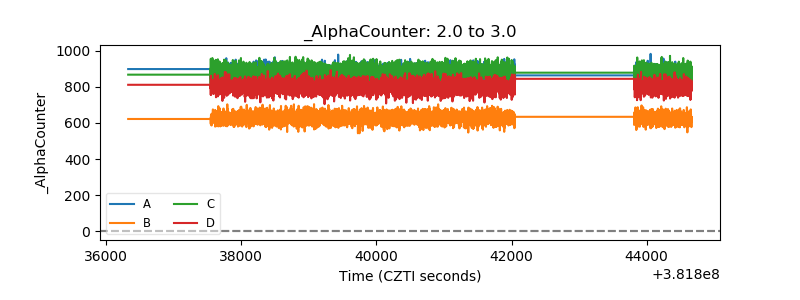 |
| _CPM_Rate | 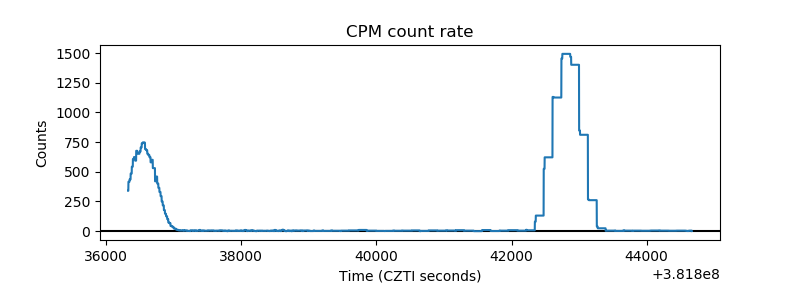 |
| CZT Counter | 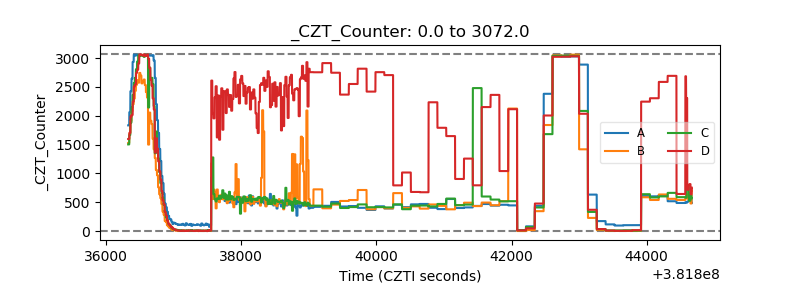 |
| +2.5 Volts monitor | 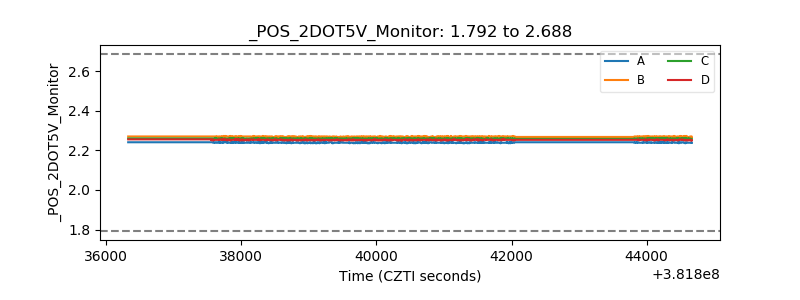 |
| +5 Volts monitor | 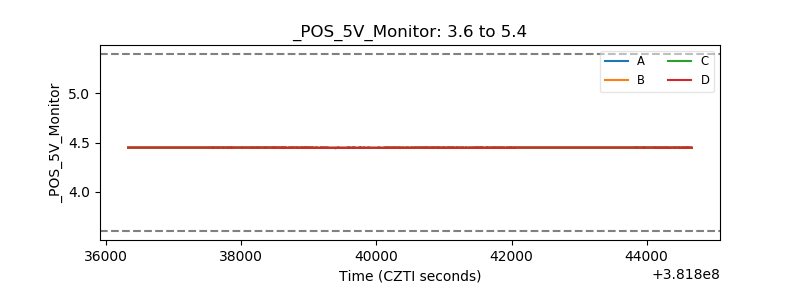 |
| _ROLL_ROT | 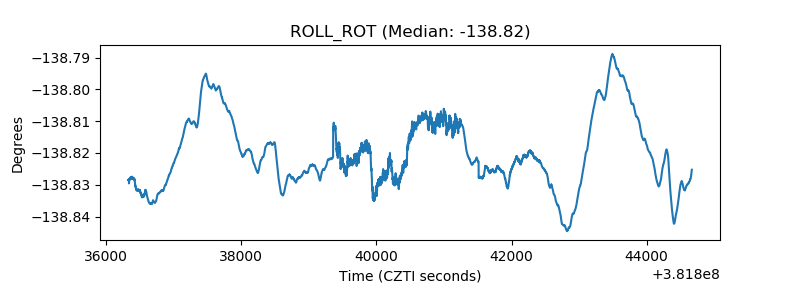 |
| _Roll_DEC | 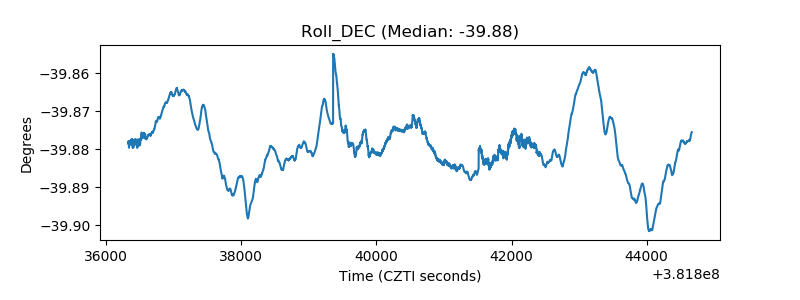 |
| _Roll_RA | 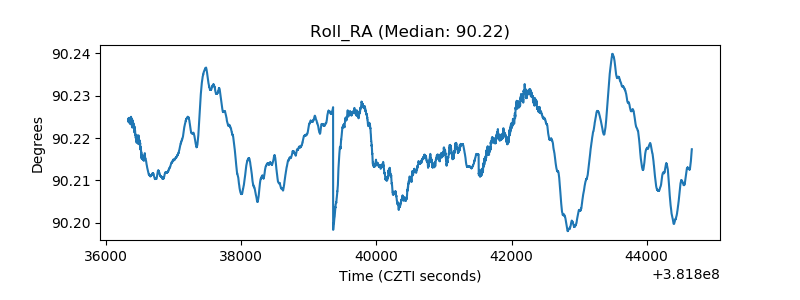 |
| Veto Counter | 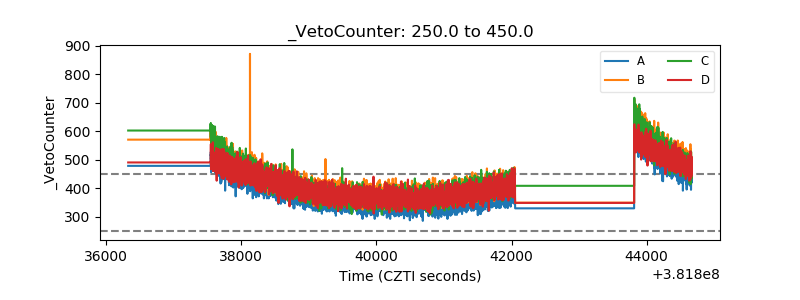 |