| Param | Original file | Final file |
|---|---|---|
| Filename | modeM0/AS1A05_085T01_9000004910_34383cztM0_level2.evt | modeM0/AS1A05_085T01_9000004910_34383cztM0_level2_quad_clean.evt |
| Size (bytes) | 762,194,880 | 64,615,680 |
| Size | 726.9 MB | 61.6 MB |
| Events in quadrant A | 2,650,843 | 438,134 |
| Events in quadrant B | 3,136,873 | 436,980 |
| Events in quadrant C | 6,487,770 | 378,853 |
| Events in quadrant D | 10,413,719 | 293,122 |
| Mode SS | |||
|---|---|---|---|
| Quadrant | BADHDUFLAG | Total packets | Discarded packets |
| A | 0 | 118 | 0 |
| B | 0 | 118 | 0 |
| C | 0 | 118 | 0 |
| D | 0 | 118 | 0 |
| Mode M9 | |||
|---|---|---|---|
| Quadrant | BADHDUFLAG | Total packets | Discarded packets |
| A | 0 | 25 | 0 |
| B | 0 | 25 | 0 |
| C | 0 | 25 | 0 |
| D | 0 | 26 | 0 |
| Mode M0 | |||
|---|---|---|---|
| Quadrant | BADHDUFLAG | Total packets | Discarded packets |
| A | 0 | 11799 | 3 |
| B | 0 | 13134 | 2 |
| C | 0 | 23294 | 2 |
| D | 0 | 34996 | 2 |
| Quadrant | Total seconds | Saturated seconds | Saturation percentage |
|---|---|---|---|
| A | 5841 | 7 | 0.119842% |
| B | 5841 | 116 | 1.985961% |
| C | 5841 | 994 | 17.017634% |
| D | 5841 | 2707 | 46.344804% |
Noise dominated data is calculated using 1-second bins in cleaned event files. If a bin has >2000 counts, and if more than 50% of those come from <1% of pixels, then it is considered to be noise-dominated and hence unusable.
| Quadrant | # 1 sec bins | Bins with >0 counts | Bins with >2000 counts | High rate bins dominated by noise | Noise dominated (total time) | Noise dominated (detector-on time) | Marked lightcurve |
|---|---|---|---|---|---|---|---|
| A | 7275 | 5842 | 0 | 0 | 0.00% | 0.00% | 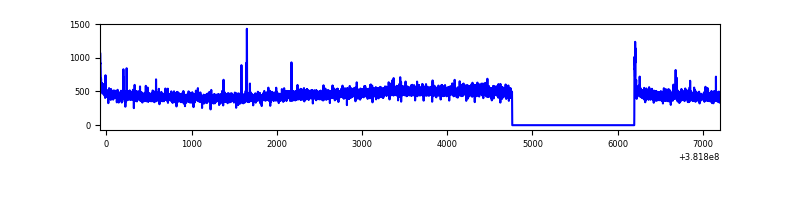 |
| B | 7275 | 5842 | 81 | 81 | 1.11% | 1.39% | 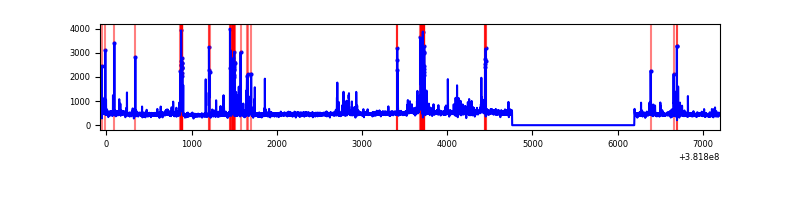 |
| C | 7275 | 5842 | 913 | 913 | 12.55% | 15.63% | 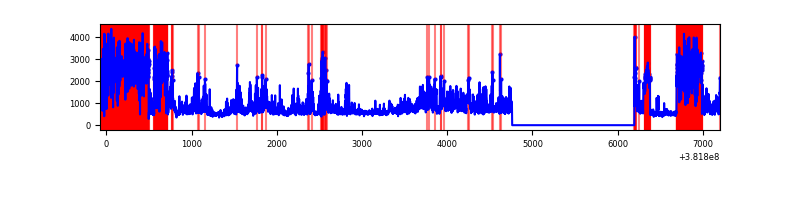 |
| D | 7275 | 5842 | 2590 | 2590 | 35.60% | 44.33% | 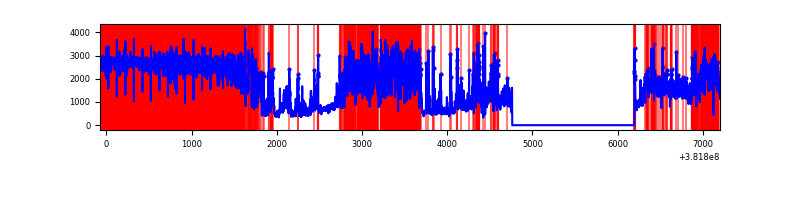 |
Top three noisy pixels from each quadrant. If the there are fewer than three noisy pixels in the level2.evt file, extra rows are filled as -1
| Pixel properties | Quadrant properties | ||||||
|---|---|---|---|---|---|---|---|
| Quadrant | DetID | PixID | Counts | Sigma | Mean | Median | Sigma |
| A | 10 | 83 | 33152 | 241.34 | 669 | 656 | 134.6 |
| A | 13 | 6 | 14334 | 101.58 | 669 | 656 | 134.6 |
| A | 9 | 143 | 13982 | 98.97 | 669 | 656 | 134.6 |
| B | 5 | 172 | 382318 | 2969.54 | 664 | 648 | 128.5 |
| B | 0 | 190 | 61062 | 470.04 | 664 | 648 | 128.5 |
| B | 5 | 255 | 24491 | 185.51 | 664 | 648 | 128.5 |
| C | 4 | 254 | 3534018 | 25291.53 | 604 | 608 | 139.7 |
| C | 15 | 214 | 225713 | 1611.26 | 604 | 608 | 139.7 |
| C | 0 | 10 | 164146 | 1170.58 | 604 | 608 | 139.7 |
| D | 7 | 223 | 4377766 | 34015.53 | 526 | 511 | 128.7 |
| D | 2 | 249 | 2401721 | 18659.74 | 526 | 511 | 128.7 |
| D | 8 | 195 | 1256657 | 9761.48 | 526 | 511 | 128.7 |
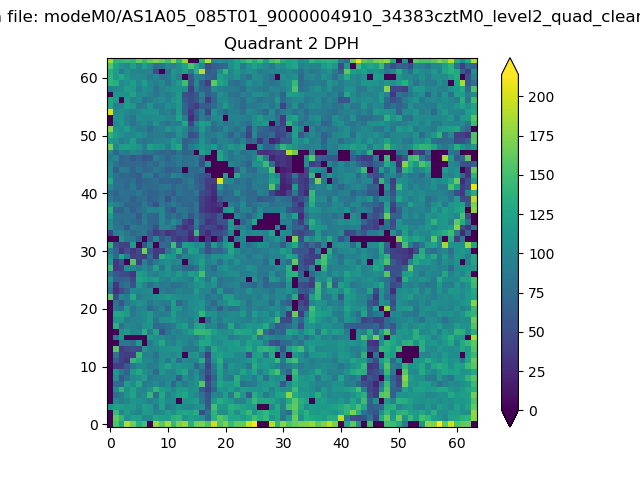
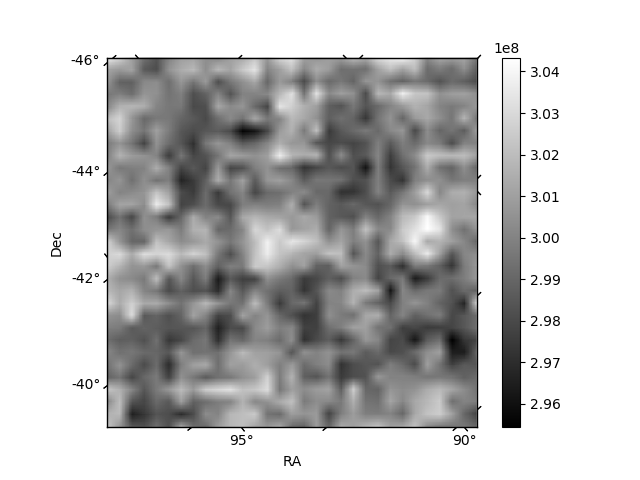
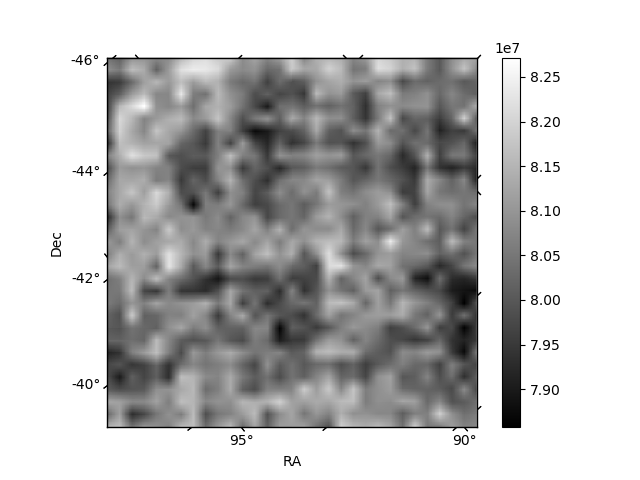
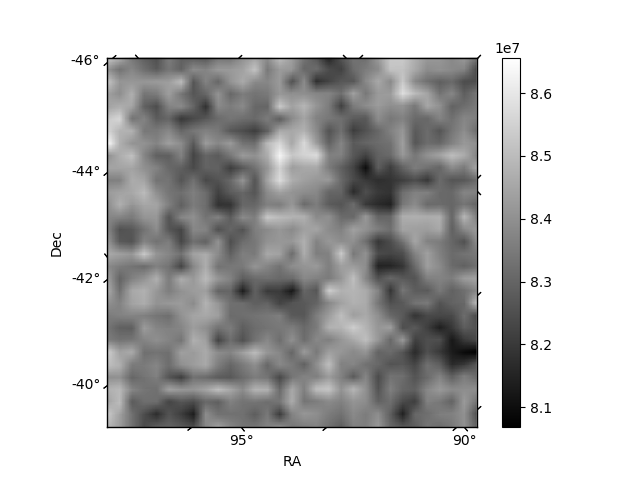
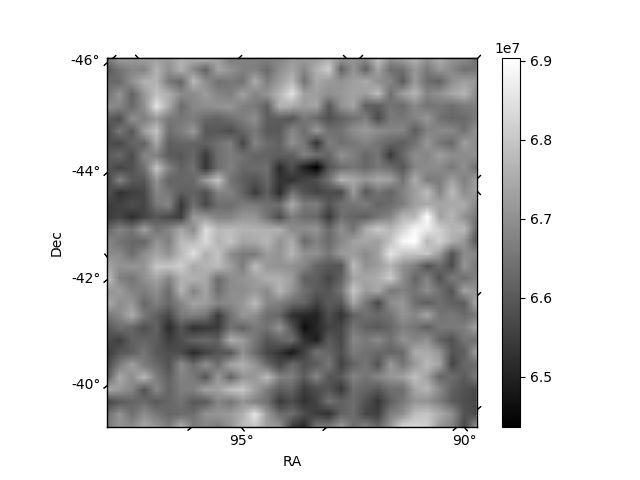
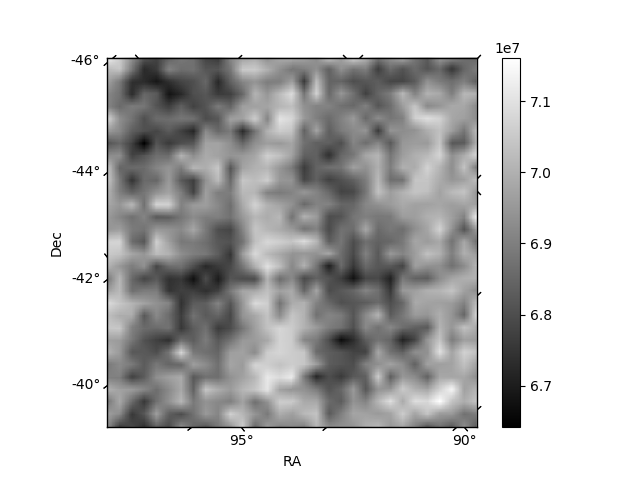
Histogram calculated using DETX and DETY for each event in the final _common_clean file
| Quadrant A | 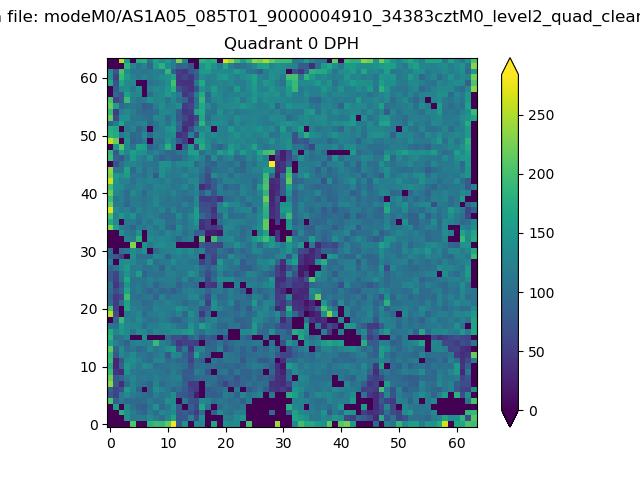 |
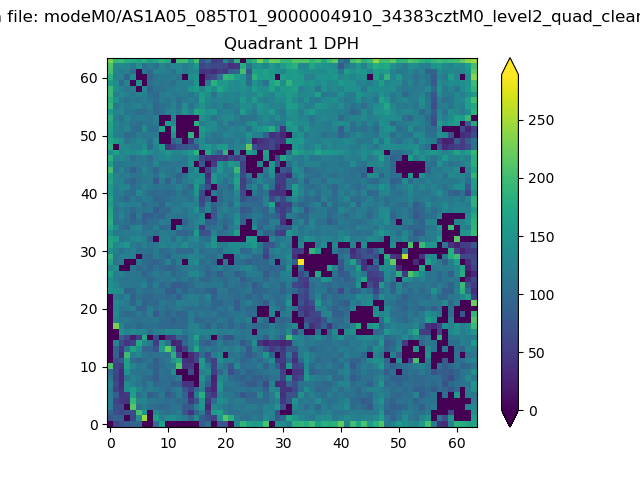 |
Quadrant B |
|---|---|---|---|
| Quadrant D | 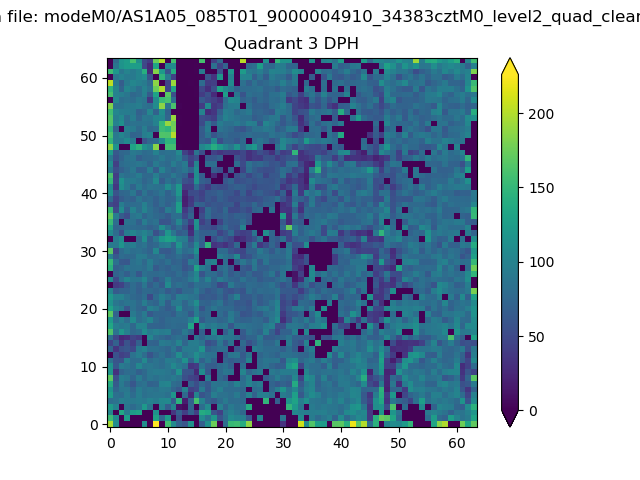 |
 |
Quadrant C |
| Plot type | Count rate plots | Images |
|---|---|---|
| Comparison with Poisson distribution Blue bars denote a histogram of data divided into 1 sec bins. Red curve is a Poisson curve with rate = median count rate of data. |
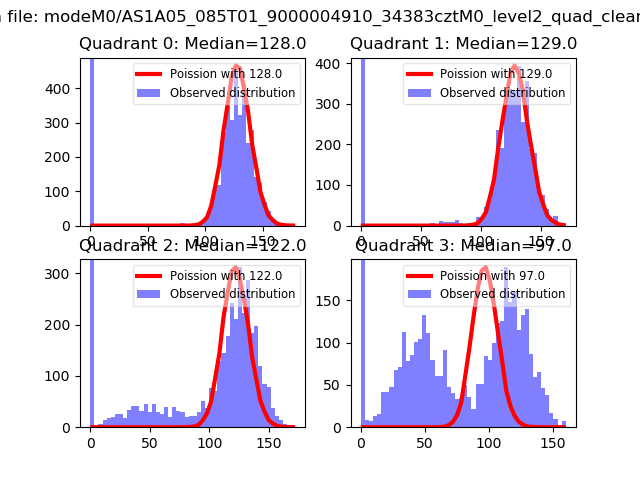 |
 |
| Quadrant-wise count rates Data is divided into 100 sec bins |
 |
|
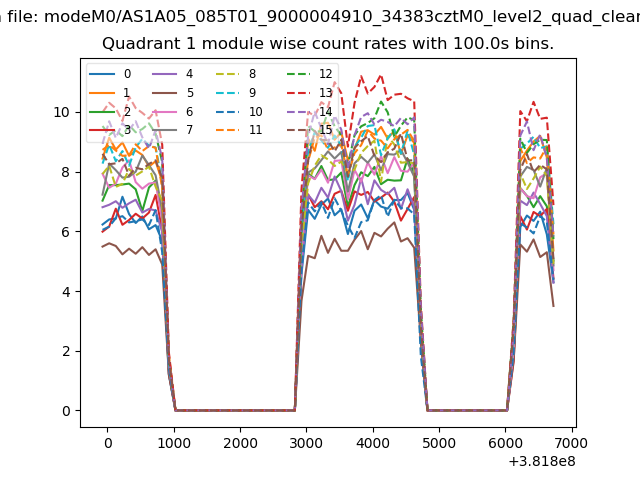
| Module-wise count rates for Quadrant A Data is divided into 100 sec bins |
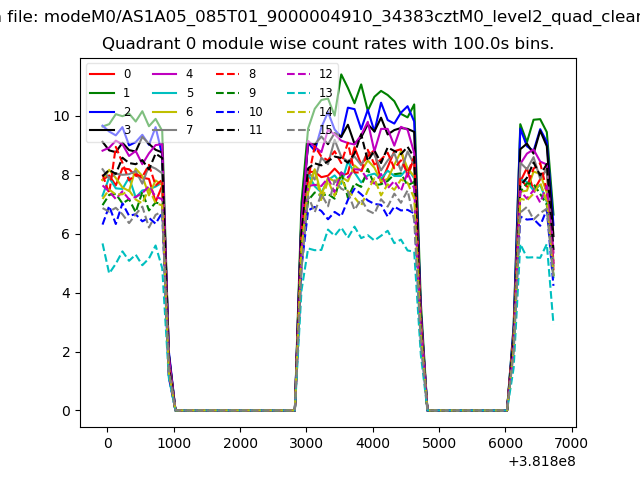 |
 |
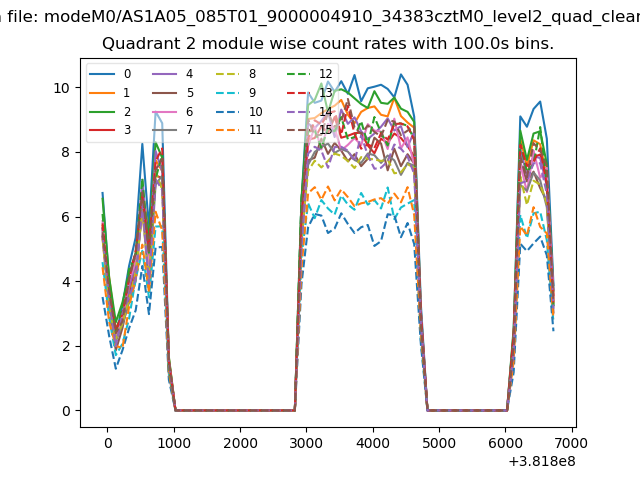
| Module-wise count rates for Quadrant B Data is divided into 100 sec bins |
 |
 |
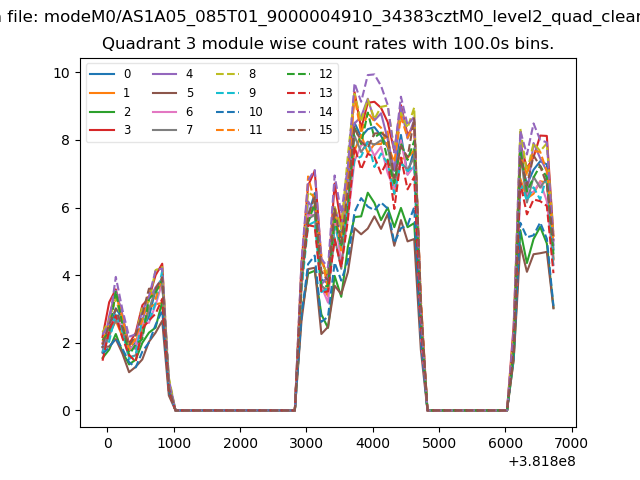
| Module-wise count rates for Quadrant C Data is divided into 100 sec bins |
 |
 |
| Module-wise count rates for Quadrant D Data is divided into 100 sec bins |
 |
 |
| Parameter | Plot |
|---|---|
| CZT HV Monitor | 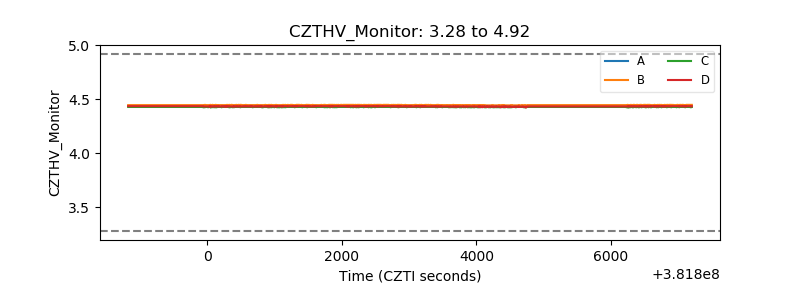 |
| D_VDD | 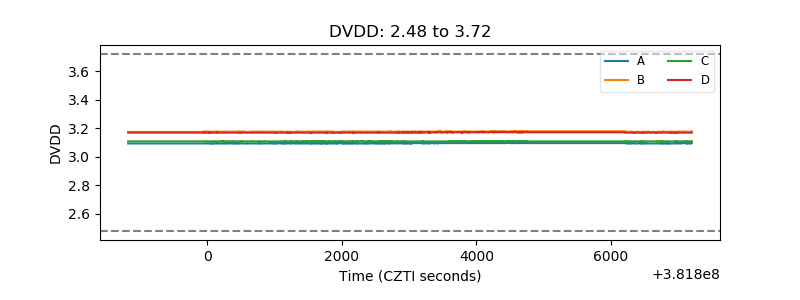 |
| Temperature 1 | 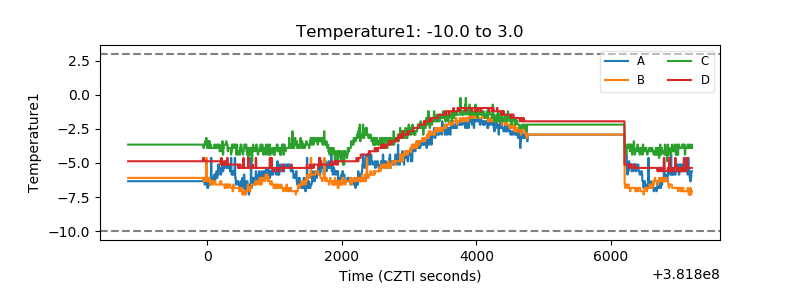 |
| Veto HV Monitor | 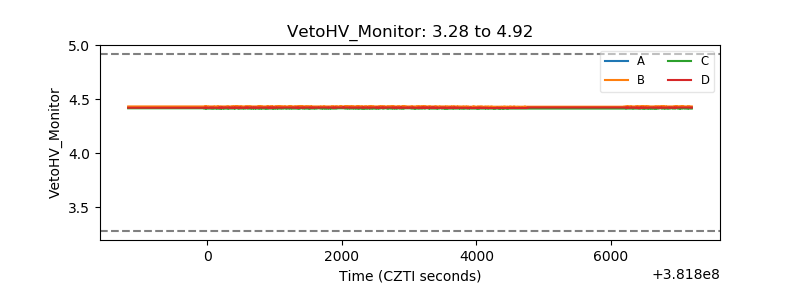 |
| Veto LLD |  |
| Alpha Counter | 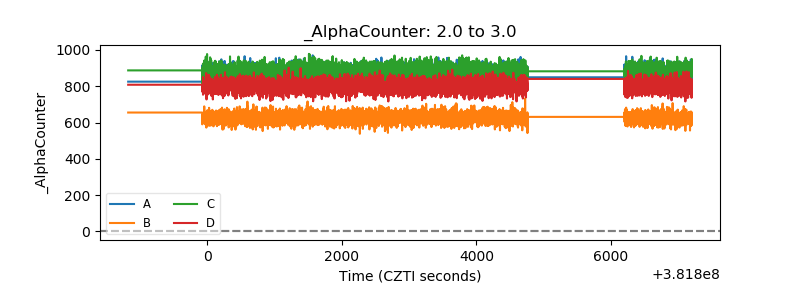 |
| _CPM_Rate | 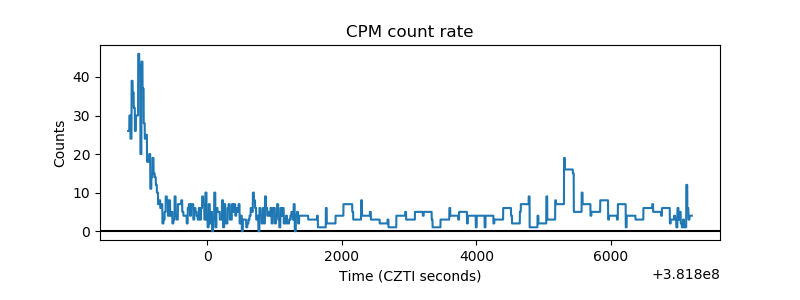 |
| CZT Counter | 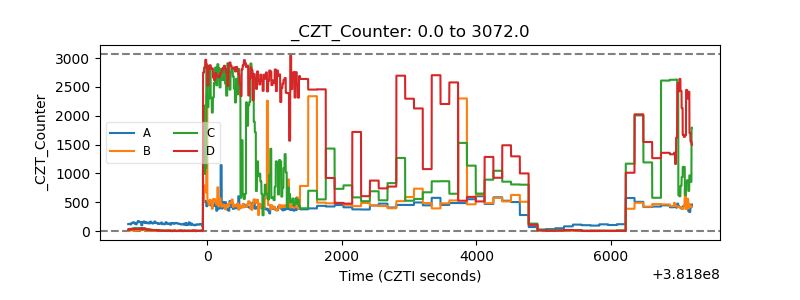 |
| +2.5 Volts monitor | 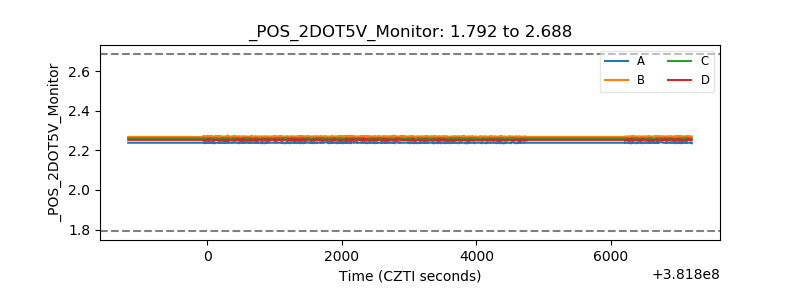 |
| +5 Volts monitor | 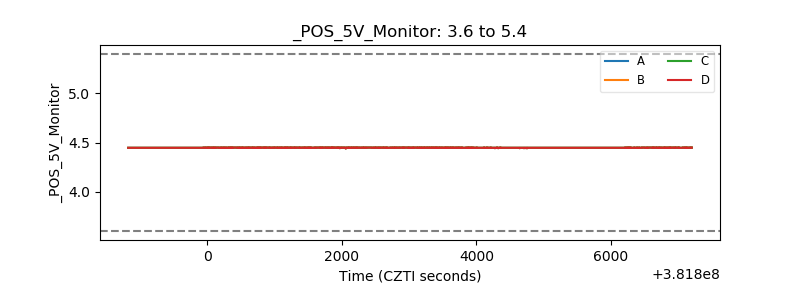 |
| _ROLL_ROT | 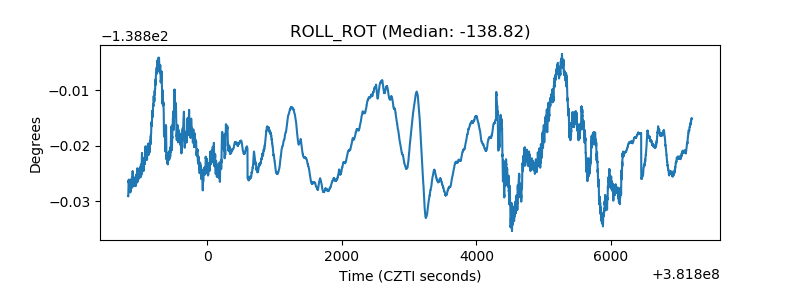 |
| _Roll_DEC | 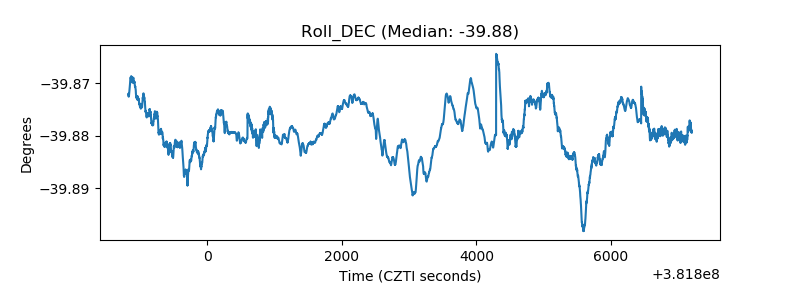 |
| _Roll_RA | 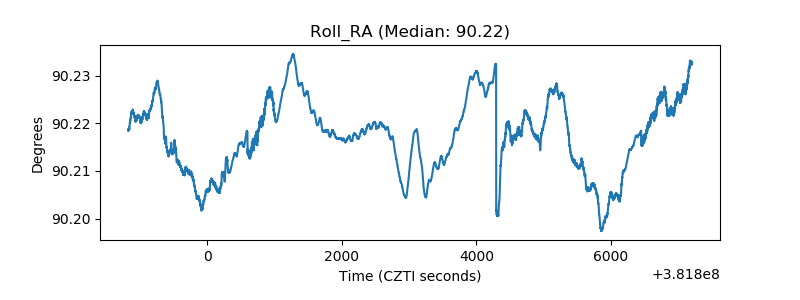 |
| Veto Counter | 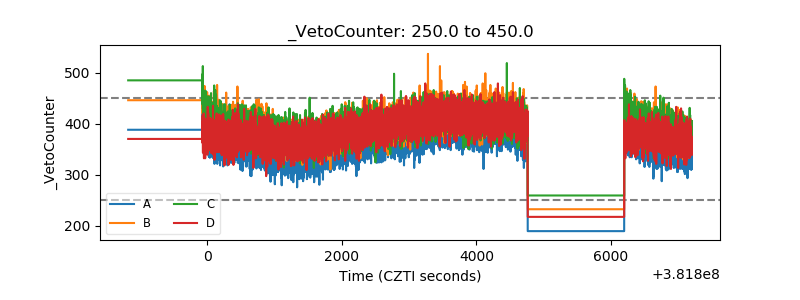 |