| Param | Original file | Final file |
|---|---|---|
| Filename | modeM0/AS1A05_085T01_9000004910_34382cztM0_level2.evt | modeM0/AS1A05_085T01_9000004910_34382cztM0_level2_quad_clean.evt |
| Size (bytes) | 817,067,520 | 62,524,800 |
| Size | 779.2 MB | 59.6 MB |
| Events in quadrant A | 2,523,812 | 452,193 |
| Events in quadrant B | 3,723,507 | 433,347 |
| Events in quadrant C | 9,035,956 | 336,406 |
| Events in quadrant D | 9,089,794 | 283,565 |
| Mode SS | |||
|---|---|---|---|
| Quadrant | BADHDUFLAG | Total packets | Discarded packets |
| A | 0 | 110 | 0 |
| B | 0 | 110 | 0 |
| C | 0 | 110 | 0 |
| D | 0 | 110 | 0 |
| Mode M9 | |||
|---|---|---|---|
| Quadrant | BADHDUFLAG | Total packets | Discarded packets |
| A | 0 | 32 | 0 |
| B | 0 | 32 | 0 |
| C | 0 | 32 | 0 |
| D | 0 | 33 | 0 |
| Mode M0 | |||
|---|---|---|---|
| Quadrant | BADHDUFLAG | Total packets | Discarded packets |
| A | 0 | 11214 | 3 |
| B | 0 | 14762 | 2 |
| C | 0 | 30686 | 2 |
| D | 0 | 30834 | 2 |
| Quadrant | Total seconds | Saturated seconds | Saturation percentage |
|---|---|---|---|
| A | 5523 | 7 | 0.126743% |
| B | 5523 | 390 | 7.061380% |
| C | 5523 | 2533 | 45.862756% |
| D | 5523 | 2593 | 46.949122% |
Noise dominated data is calculated using 1-second bins in cleaned event files. If a bin has >2000 counts, and if more than 50% of those come from <1% of pixels, then it is considered to be noise-dominated and hence unusable.
| Quadrant | # 1 sec bins | Bins with >0 counts | Bins with >2000 counts | High rate bins dominated by noise | Noise dominated (total time) | Noise dominated (detector-on time) | Marked lightcurve |
|---|---|---|---|---|---|---|---|
| A | 7256 | 5524 | 0 | 0 | 0.00% | 0.00% | 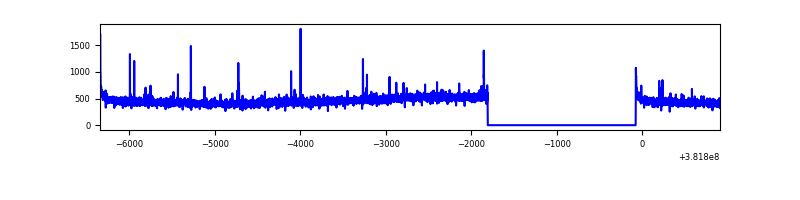 |
| B | 7256 | 5524 | 293 | 293 | 4.04% | 5.30% | 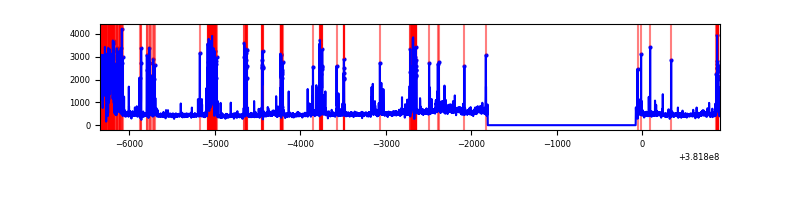 |
| C | 7256 | 5523 | 2355 | 2355 | 32.46% | 42.64% | 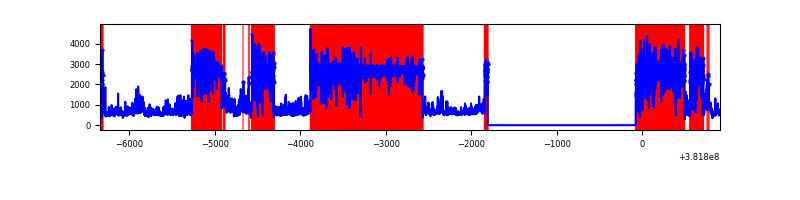 |
| D | 7256 | 5523 | 2425 | 2425 | 33.42% | 43.91% | 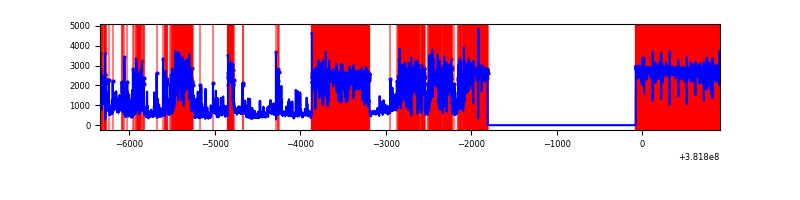 |
Top three noisy pixels from each quadrant. If the there are fewer than three noisy pixels in the level2.evt file, extra rows are filled as -1
| Pixel properties | Quadrant properties | ||||||
|---|---|---|---|---|---|---|---|
| Quadrant | DetID | PixID | Counts | Sigma | Mean | Median | Sigma |
| A | 10 | 83 | 32303 | 248.0 | 633 | 620 | 127.8 |
| A | 9 | 143 | 18051 | 136.44 | 633 | 620 | 127.8 |
| A | 13 | 6 | 16372 | 123.3 | 633 | 620 | 127.8 |
| B | 5 | 172 | 1109263 | 9424.43 | 614 | 599 | 117.6 |
| B | 0 | 190 | 110930 | 937.89 | 614 | 599 | 117.6 |
| B | 5 | 255 | 25637 | 212.84 | 614 | 599 | 117.6 |
| C | 4 | 254 | 6929832 | 65583.88 | 450 | 454 | 105.7 |
| C | 15 | 214 | 173341 | 1636.31 | 450 | 454 | 105.7 |
| C | 0 | 10 | 124438 | 1173.46 | 450 | 454 | 105.7 |
| D | 7 | 223 | 3902787 | 33117.2 | 482 | 469 | 117.8 |
| D | 2 | 249 | 2239806 | 19004.24 | 482 | 469 | 117.8 |
| D | 8 | 195 | 563438 | 4777.66 | 482 | 469 | 117.8 |
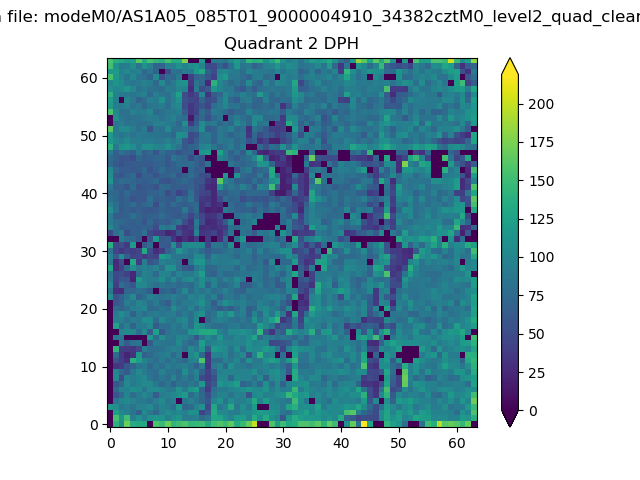
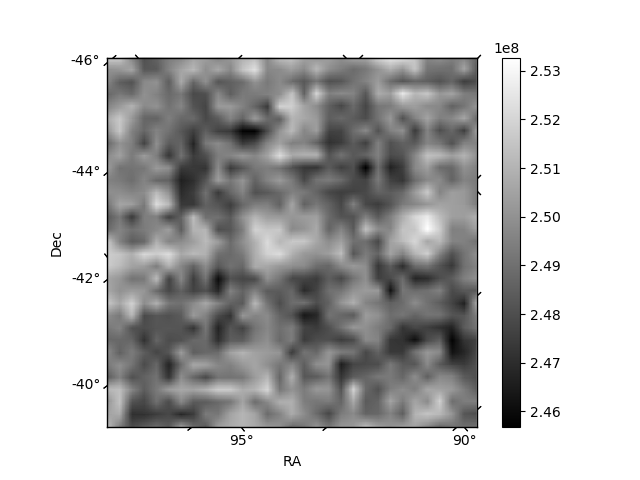
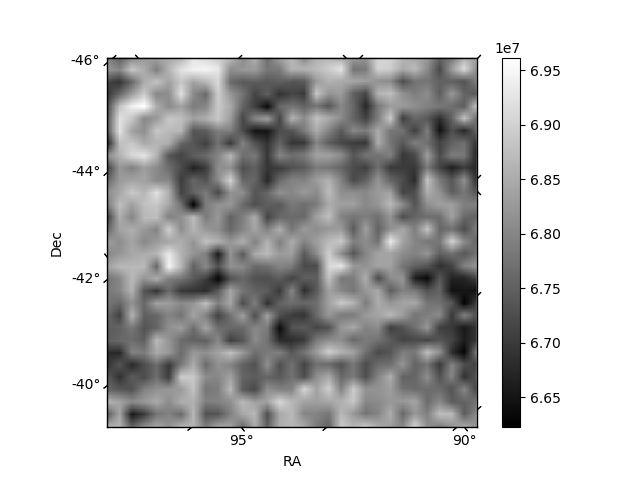
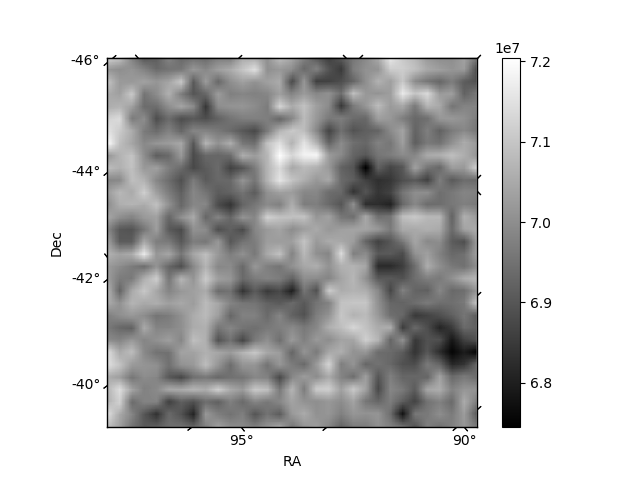
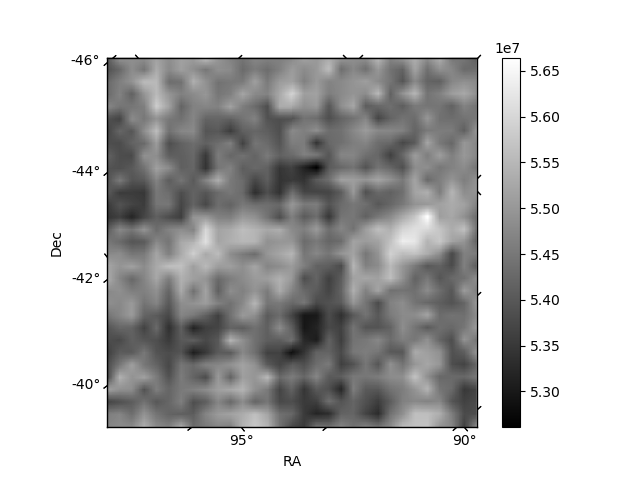
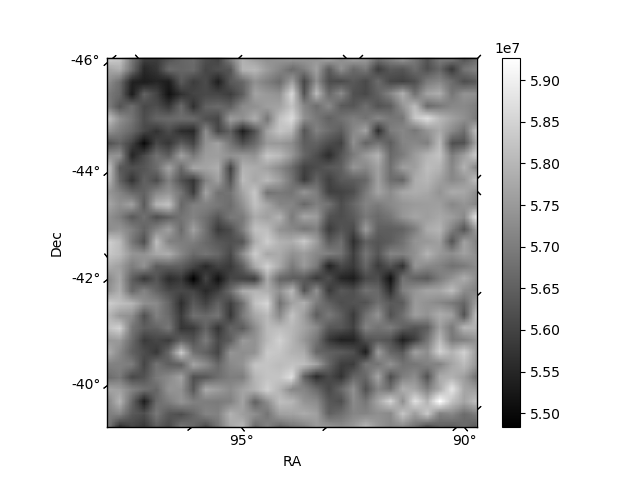
Histogram calculated using DETX and DETY for each event in the final _common_clean file
| Quadrant A | 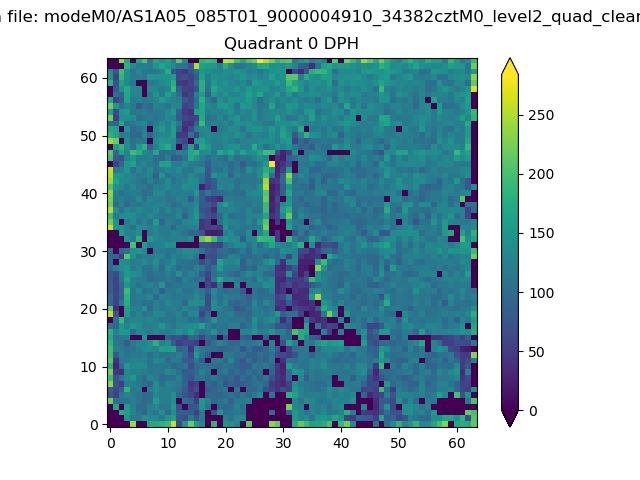 |
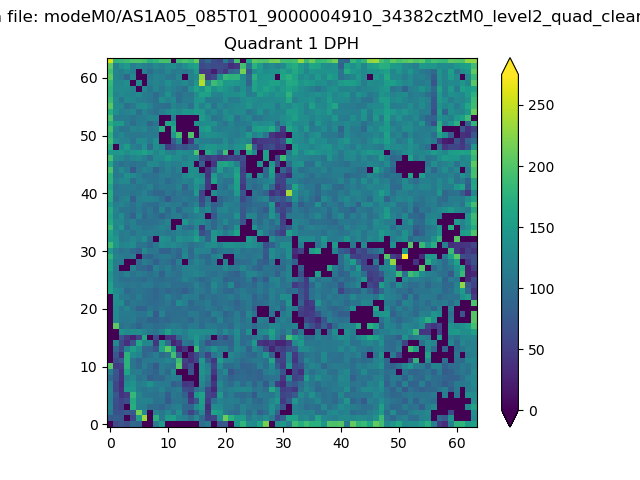 |
Quadrant B |
|---|---|---|---|
| Quadrant D | 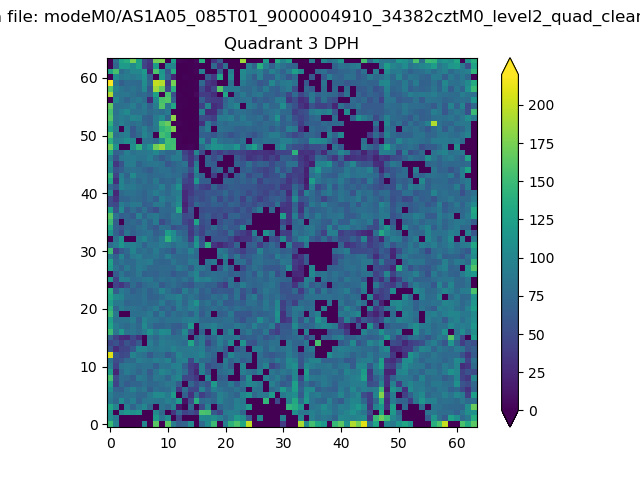 |
 |
Quadrant C |
| Plot type | Count rate plots | Images |
|---|---|---|
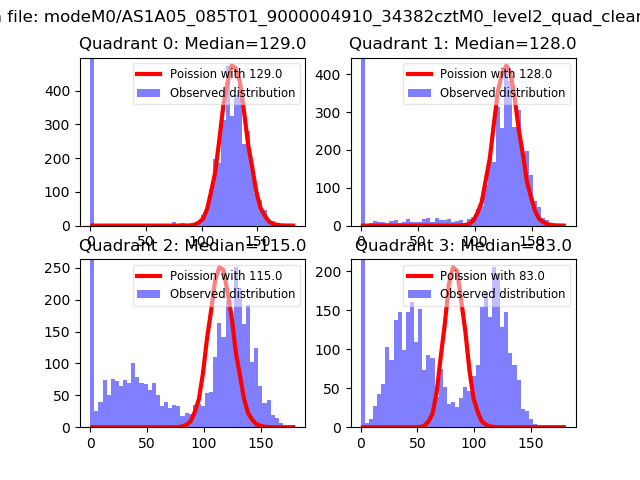
| Comparison with Poisson distribution Blue bars denote a histogram of data divided into 1 sec bins. Red curve is a Poisson curve with rate = median count rate of data. |
 |
 |
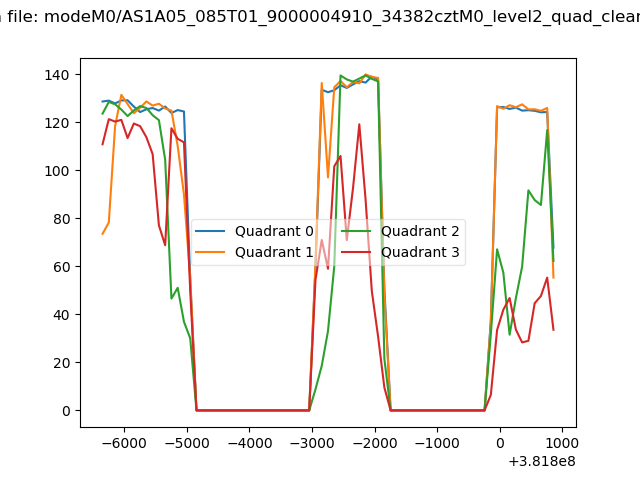
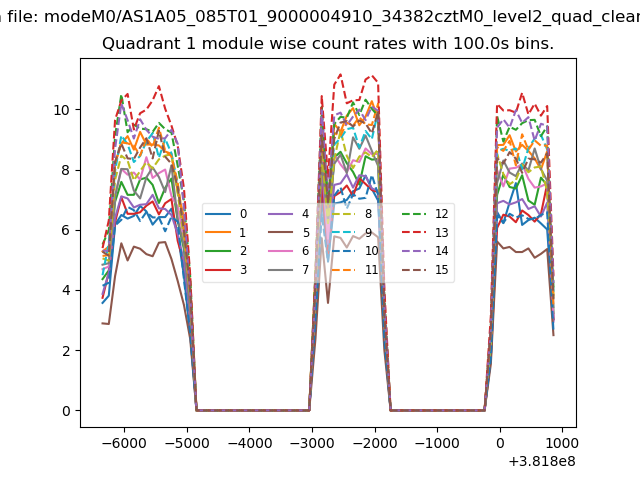
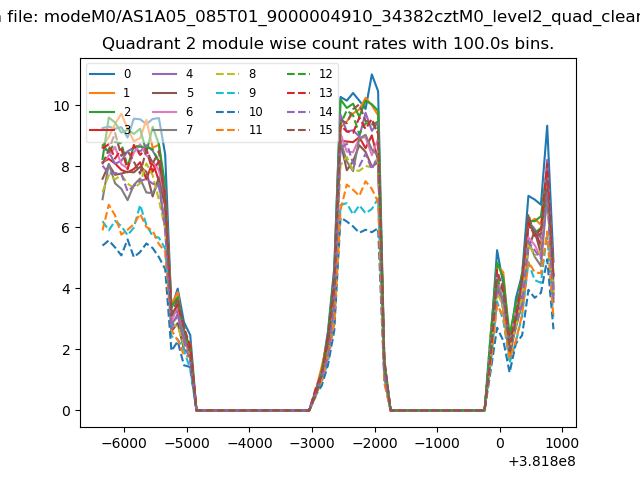
| Quadrant-wise count rates Data is divided into 100 sec bins |
 |
|
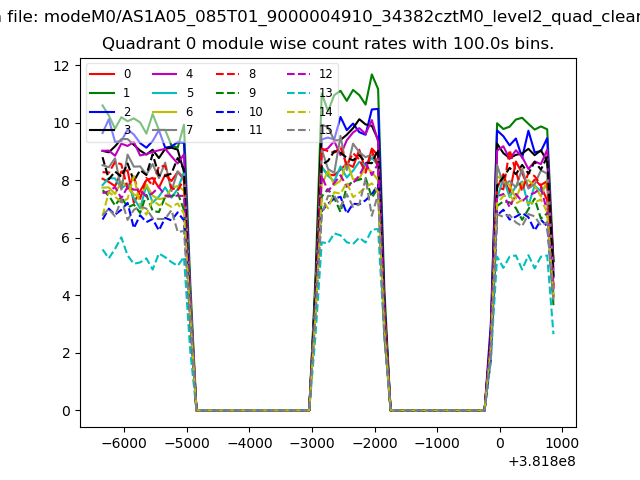
| Module-wise count rates for Quadrant A Data is divided into 100 sec bins |
 |
 |
| Module-wise count rates for Quadrant B Data is divided into 100 sec bins |
 |
 |
| Module-wise count rates for Quadrant C Data is divided into 100 sec bins |
 |
 |
| Module-wise count rates for Quadrant D Data is divided into 100 sec bins |
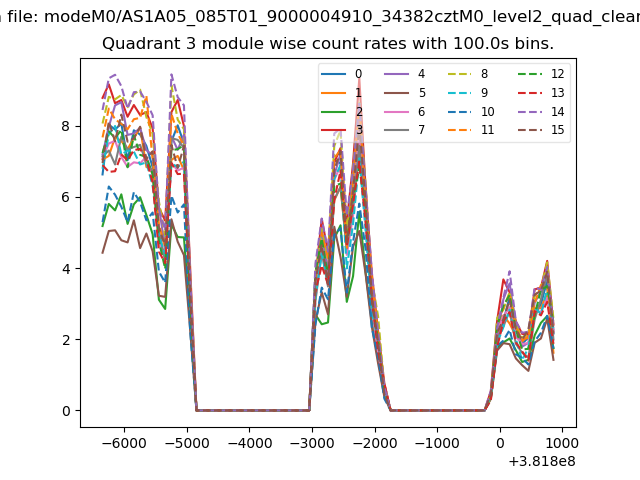 |
 |
| Parameter | Plot |
|---|---|
| CZT HV Monitor | 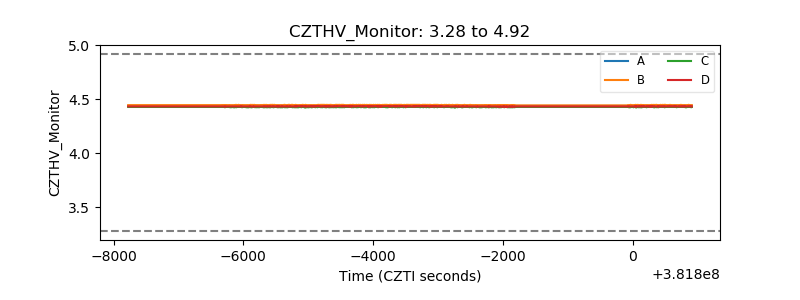 |
| D_VDD | 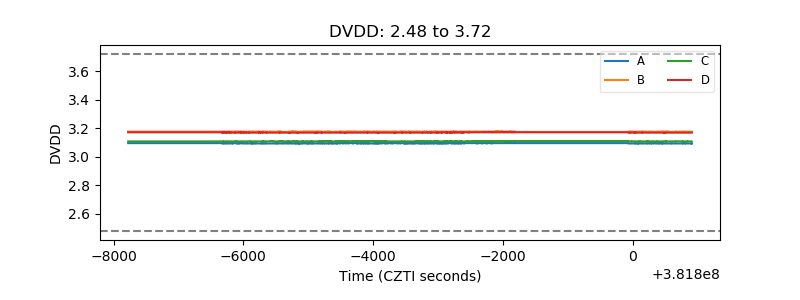 |
| Temperature 1 | 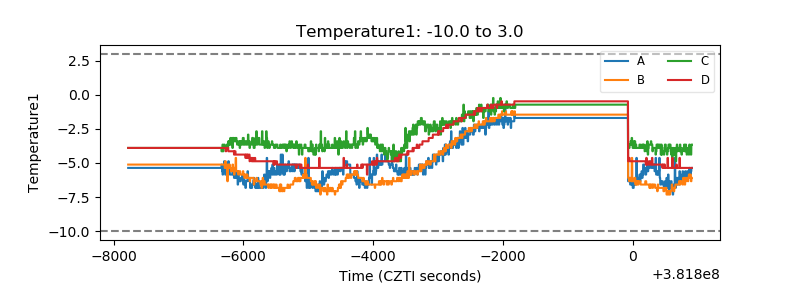 |
| Veto HV Monitor | 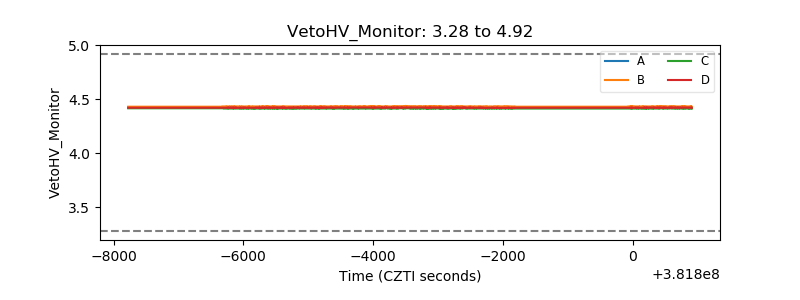 |
| Veto LLD | 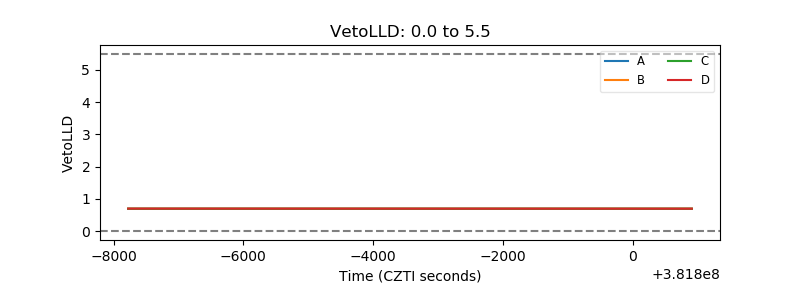 |
| Alpha Counter | 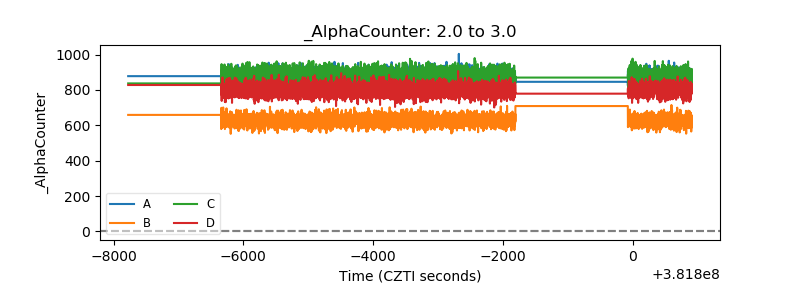 |
| _CPM_Rate | 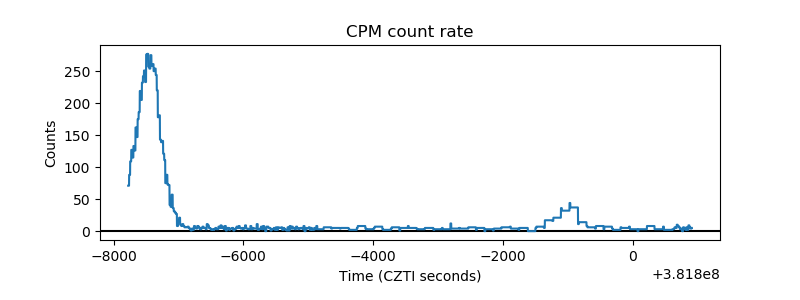 |
| CZT Counter | 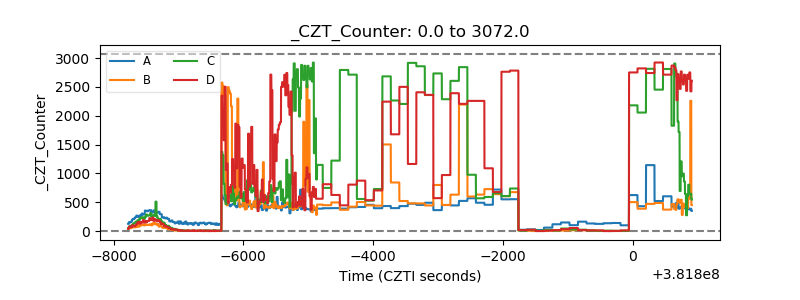 |
| +2.5 Volts monitor | 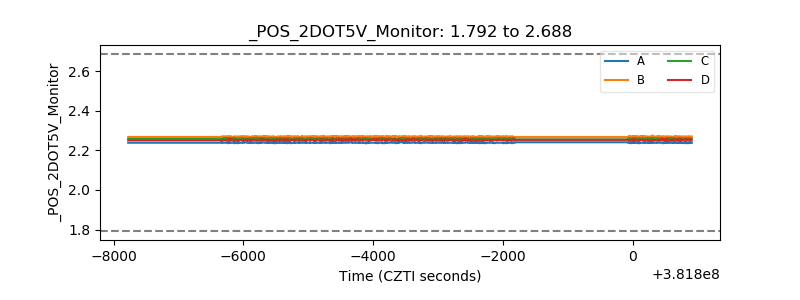 |
| +5 Volts monitor | 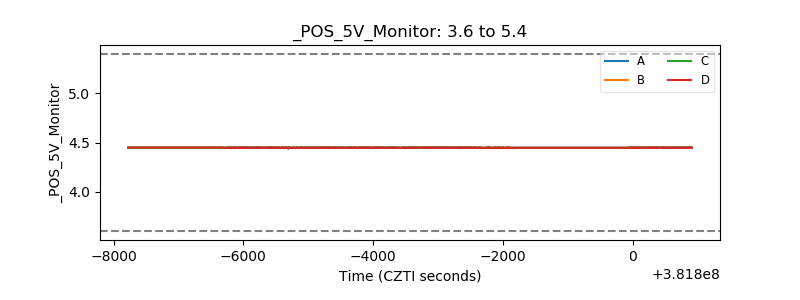 |
| _ROLL_ROT | 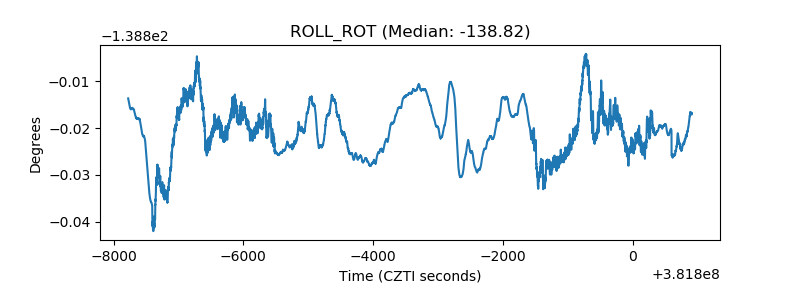 |
| _Roll_DEC | 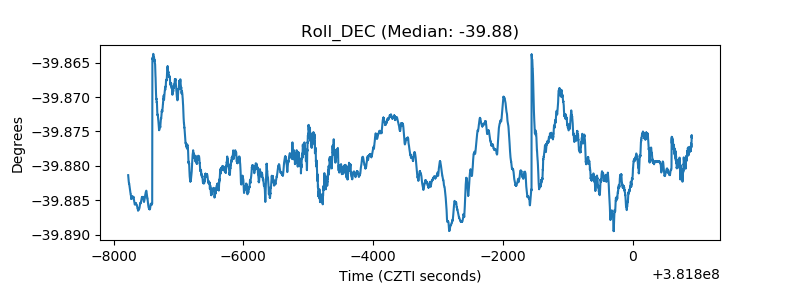 |
| _Roll_RA | 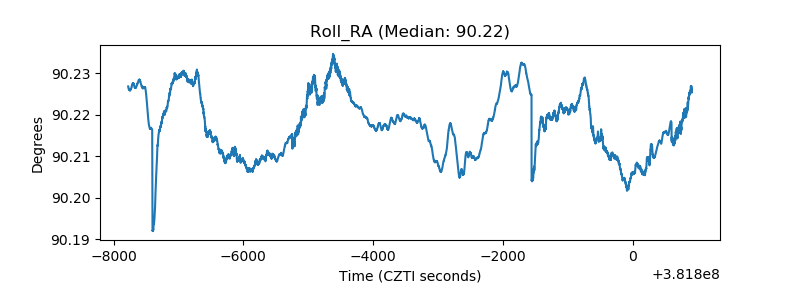 |
| Veto Counter | 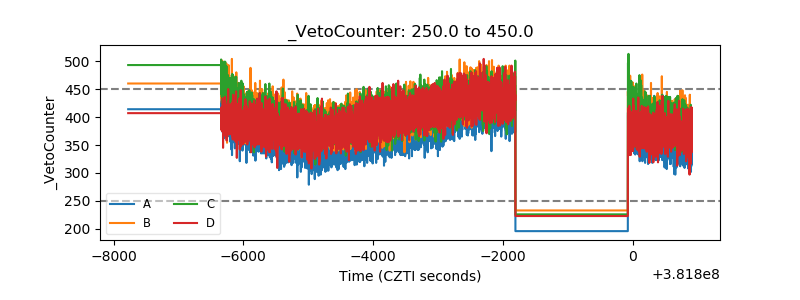 |