| Param | Original file | Final file |
|---|---|---|
| Filename | modeM0/AS1A11_047T01_9000004904_34347cztM0_level2.evt | modeM0/AS1A11_047T01_9000004904_34347cztM0_level2_quad_clean.evt |
| Size (bytes) | 484,522,560 | 93,752,640 |
| Size | 462.1 MB | 89.4 MB |
| Events in quadrant A | 2,619,721 | 639,086 |
| Events in quadrant B | 3,099,133 | 646,447 |
| Events in quadrant C | 3,108,696 | 628,216 |
| Events in quadrant D | 5,480,350 | 547,584 |
| Mode SS | |||
|---|---|---|---|
| Quadrant | BADHDUFLAG | Total packets | Discarded packets |
| A | 0 | 108 | 0 |
| B | 0 | 108 | 0 |
| C | 0 | 108 | 0 |
| D | 0 | 108 | 0 |
| Mode M0 | |||
|---|---|---|---|
| Quadrant | BADHDUFLAG | Total packets | Discarded packets |
| A | 0 | 11282 | 3 |
| B | 0 | 12662 | 2 |
| C | 0 | 12439 | 2 |
| D | 0 | 20118 | 2 |
| Mode M9 | |||
|---|---|---|---|
| Quadrant | BADHDUFLAG | Total packets | Discarded packets |
| A | 0 | 33 | 0 |
| B | 0 | 33 | 0 |
| C | 0 | 33 | 0 |
| D | 0 | 34 | 0 |
| Quadrant | Total seconds | Saturated seconds | Saturation percentage |
|---|---|---|---|
| A | 5404 | 9 | 0.166543% |
| B | 5404 | 111 | 2.054034% |
| C | 5404 | 114 | 2.109548% |
| D | 5404 | 567 | 10.492228% |
Noise dominated data is calculated using 1-second bins in cleaned event files. If a bin has >2000 counts, and if more than 50% of those come from <1% of pixels, then it is considered to be noise-dominated and hence unusable.
| Quadrant | # 1 sec bins | Bins with >0 counts | Bins with >2000 counts | High rate bins dominated by noise | Noise dominated (total time) | Noise dominated (detector-on time) | Marked lightcurve |
|---|---|---|---|---|---|---|---|
| A | 7227 | 5405 | 0 | 0 | 0.00% | 0.00% | 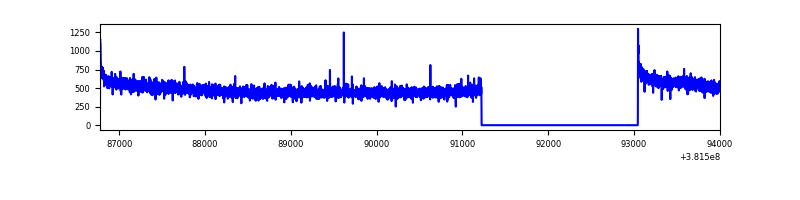 |
| B | 7227 | 5405 | 63 | 63 | 0.87% | 1.17% | 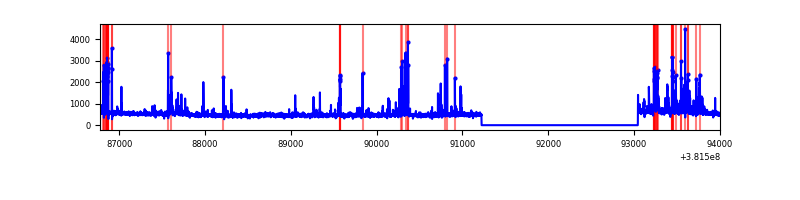 |
| C | 7227 | 5405 | 81 | 81 | 1.12% | 1.50% | 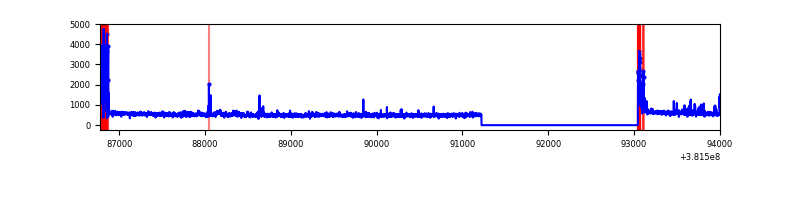 |
| D | 7226 | 5404 | 531 | 531 | 7.35% | 9.83% | 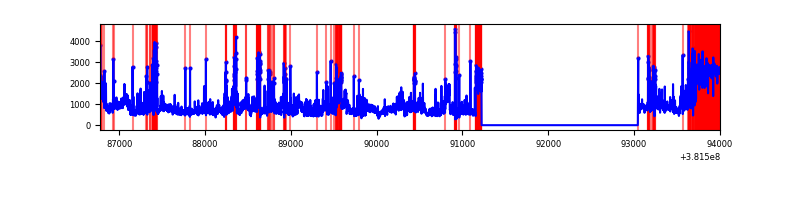 |
Top three noisy pixels from each quadrant. If the there are fewer than three noisy pixels in the level2.evt file, extra rows are filled as -1
| Pixel properties | Quadrant properties | ||||||
|---|---|---|---|---|---|---|---|
| Quadrant | DetID | PixID | Counts | Sigma | Mean | Median | Sigma |
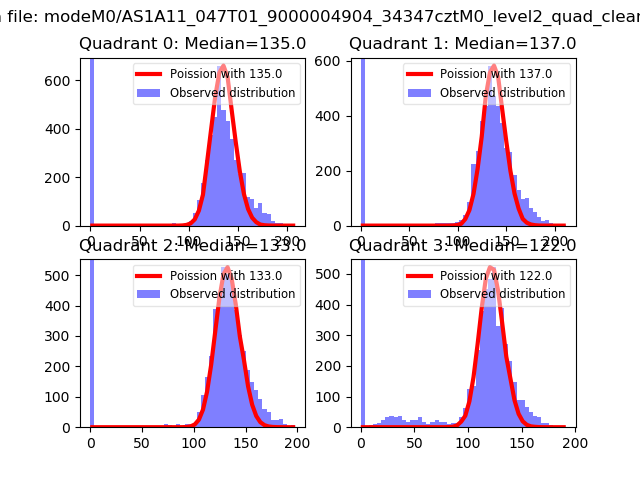
| A | 10 | 83 | 31108 | 227.89 | 667 | 656 | 133.6 |
| A | 13 | 6 | 10448 | 73.28 | 667 | 656 | 133.6 |
| A | 13 | 254 | 8500 | 58.7 | 667 | 656 | 133.6 |
| B | 5 | 172 | 419493 | 3361.66 | 655 | 639 | 124.6 |
| B | 4 | 251 | 33691 | 265.27 | 655 | 639 | 124.6 |
| B | 0 | 229 | 22037 | 171.74 | 655 | 639 | 124.6 |
| C | 0 | 10 | 287731 | 1957.1 | 639 | 645 | 146.7 |
| C | 15 | 214 | 224257 | 1524.39 | 639 | 645 | 146.7 |
| C | 14 | 67 | 44647 | 299.97 | 639 | 645 | 146.7 |
| D | 12 | 235 | 934940 | 6274.9 | 612 | 594 | 148.9 |
| D | 7 | 223 | 674184 | 4523.71 | 612 | 594 | 148.9 |
| D | 8 | 195 | 577549 | 3874.73 | 612 | 594 | 148.9 |
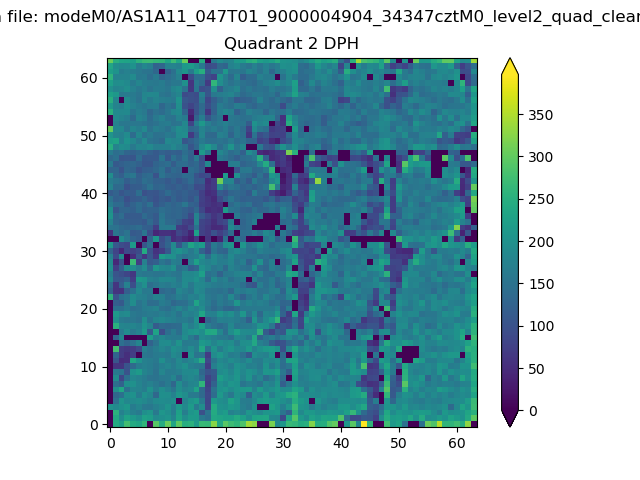
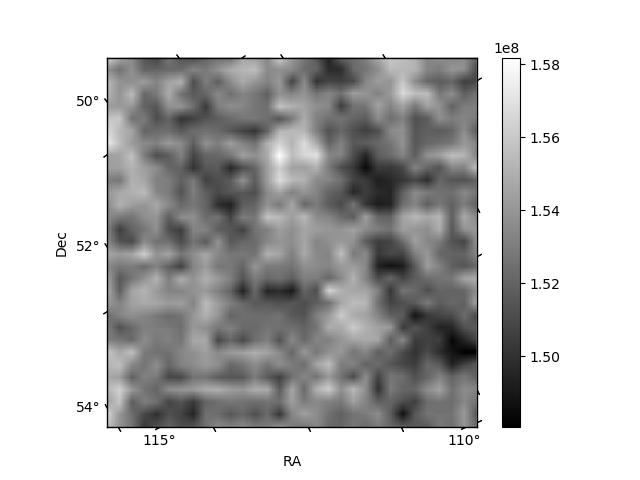
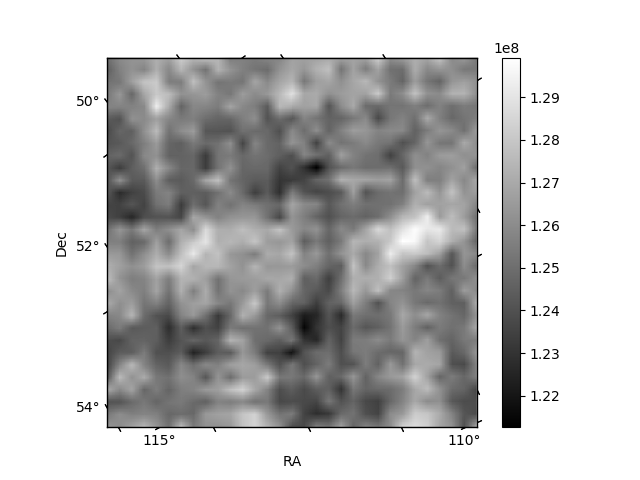
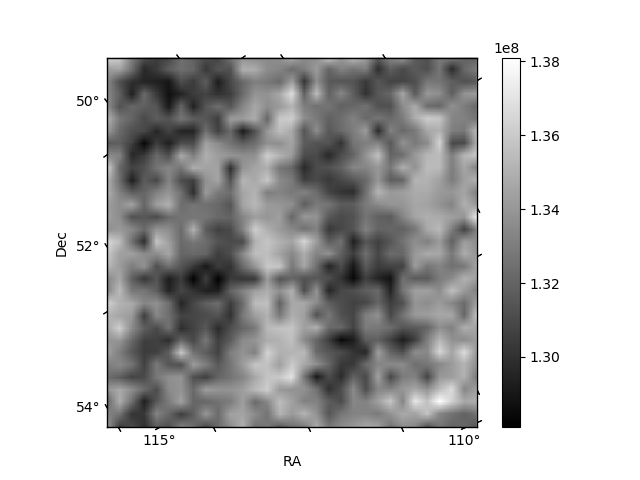
Histogram calculated using DETX and DETY for each event in the final _common_clean file
| Quadrant A | 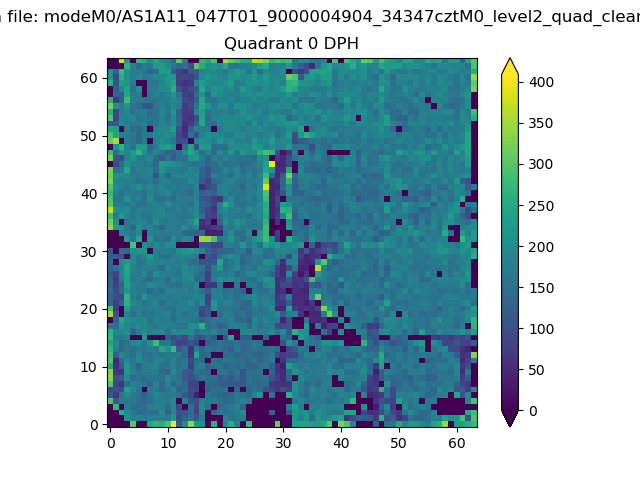 |
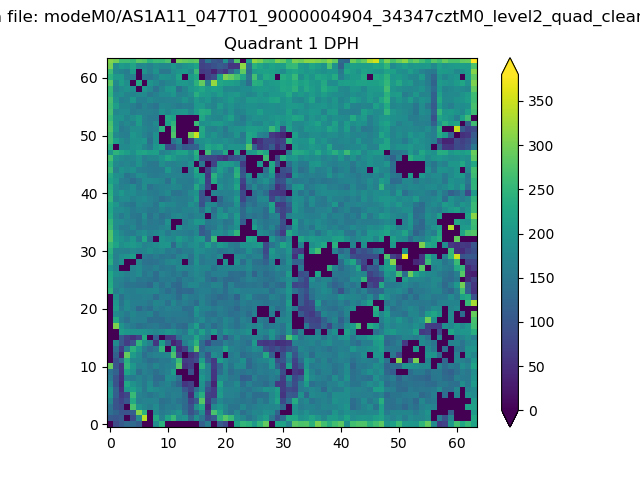 |
Quadrant B |
|---|---|---|---|
| Quadrant D | 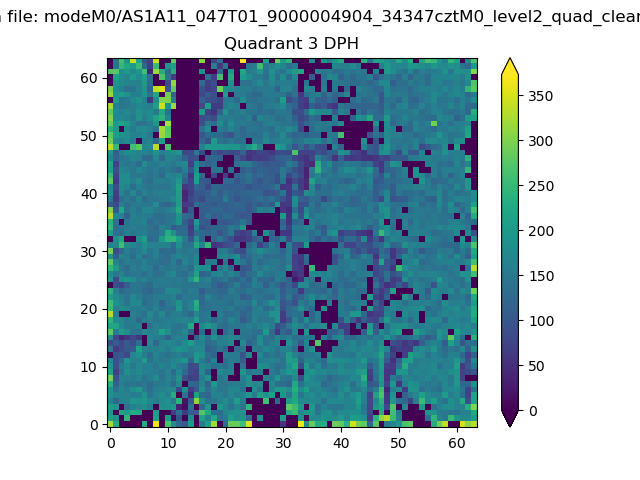 |
 |
Quadrant C |
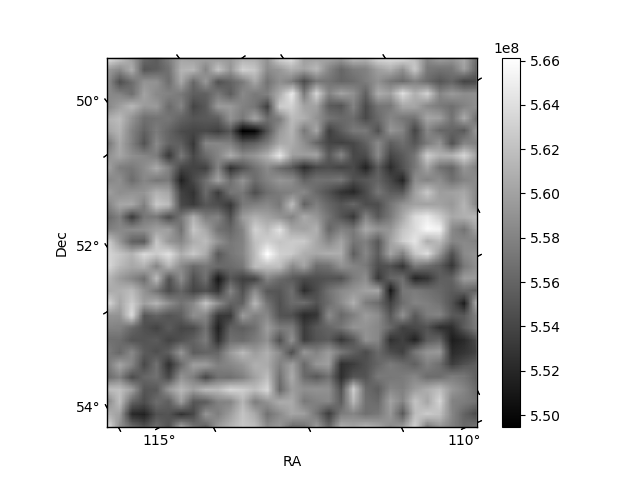
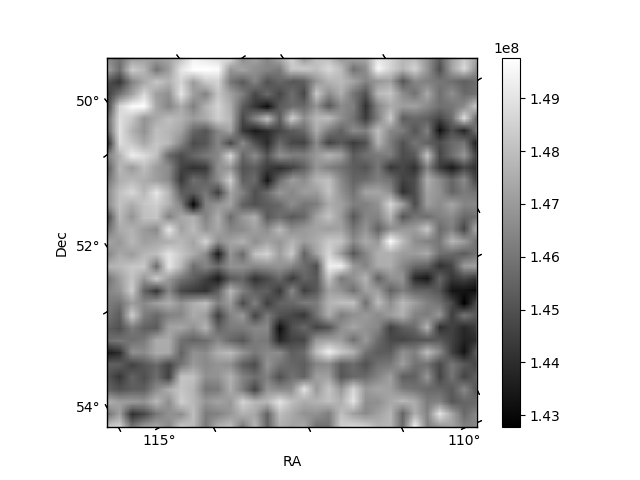
| Plot type | Count rate plots | Images |
|---|---|---|
| Comparison with Poisson distribution Blue bars denote a histogram of data divided into 1 sec bins. Red curve is a Poisson curve with rate = median count rate of data. |
 |
 |
| Quadrant-wise count rates Data is divided into 100 sec bins |
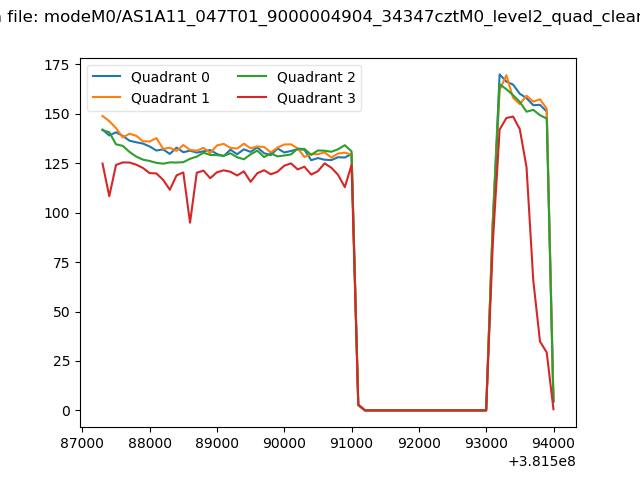 |
|
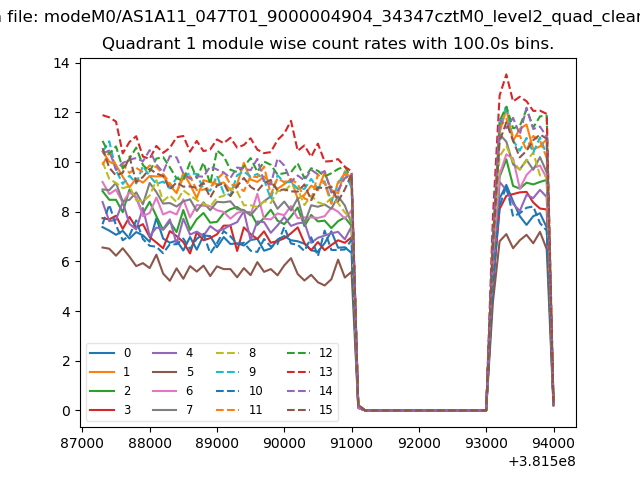
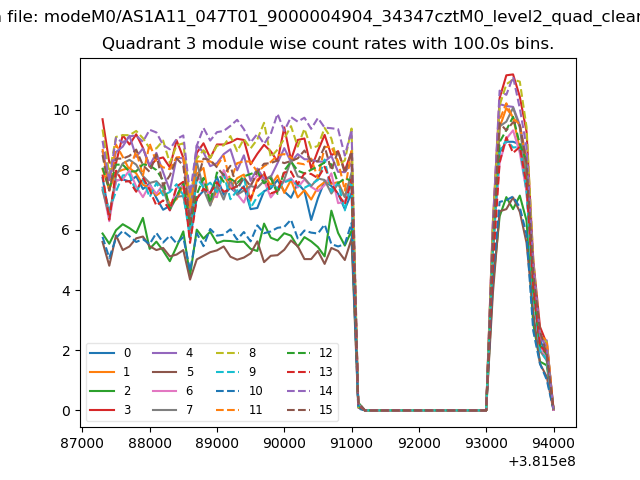
| Module-wise count rates for Quadrant A Data is divided into 100 sec bins |
 |
 |
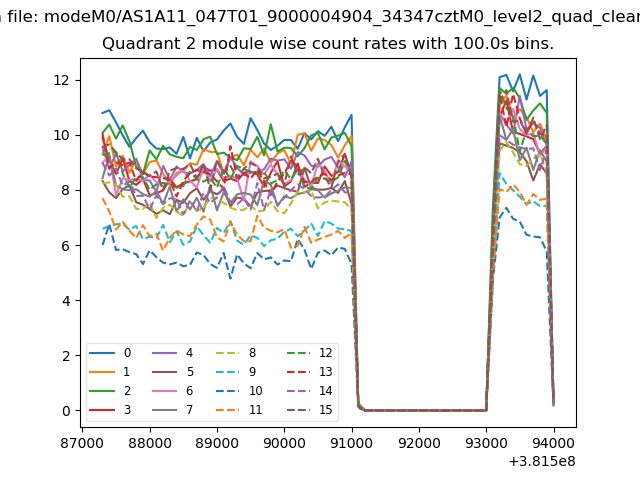
| Module-wise count rates for Quadrant B Data is divided into 100 sec bins |
 |
 |
| Module-wise count rates for Quadrant C Data is divided into 100 sec bins |
 |
 |
| Module-wise count rates for Quadrant D Data is divided into 100 sec bins |
 |
 |
| Parameter | Plot |
|---|---|
| CZT HV Monitor | 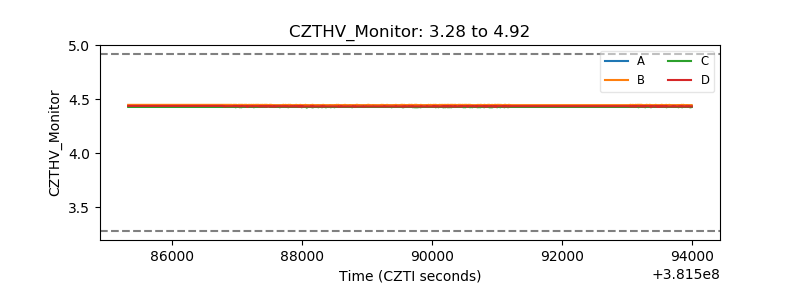 |
| D_VDD | 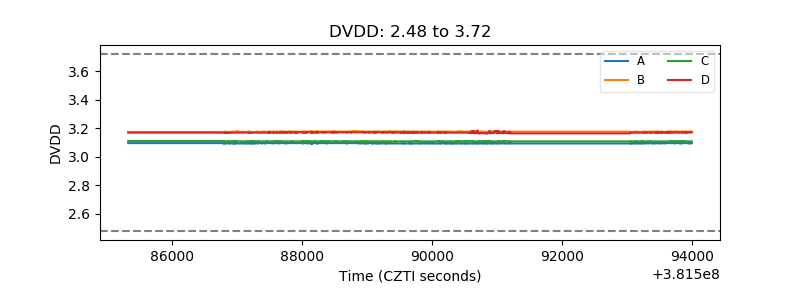 |
| Temperature 1 | 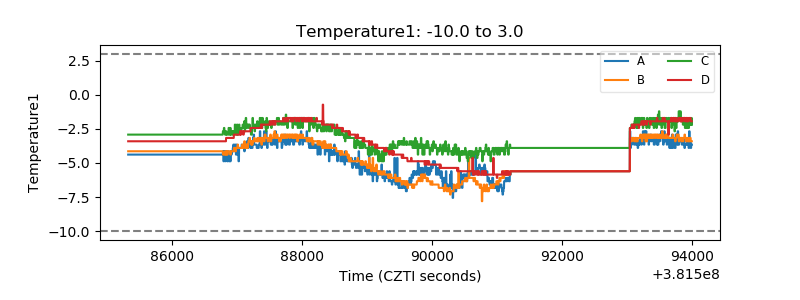 |
| Veto HV Monitor | 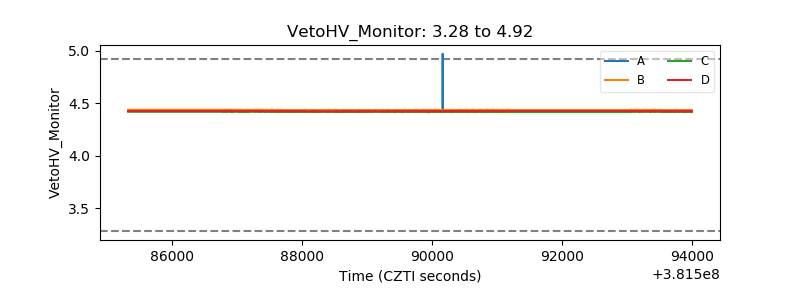 |
| Veto LLD | 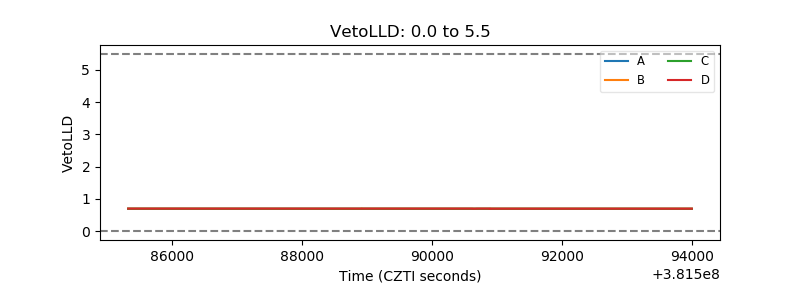 |
| Alpha Counter | 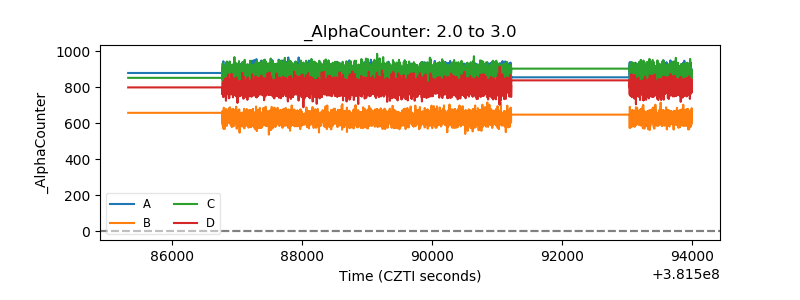 |
| _CPM_Rate | 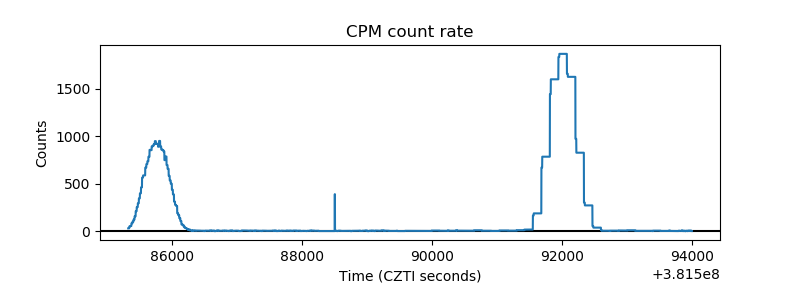 |
| CZT Counter | 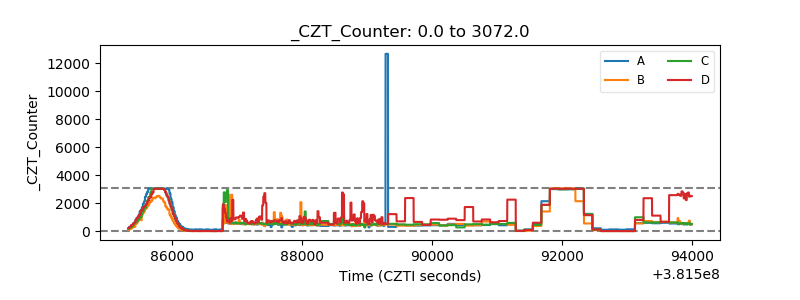 |
| +2.5 Volts monitor | 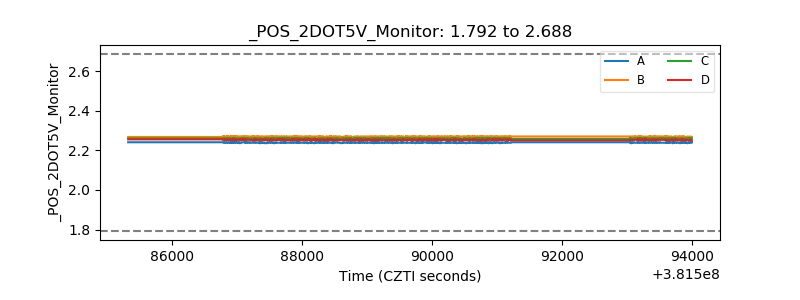 |
| +5 Volts monitor | 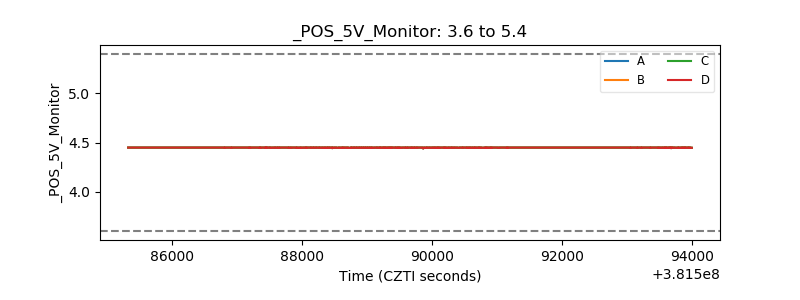 |
| _ROLL_ROT | 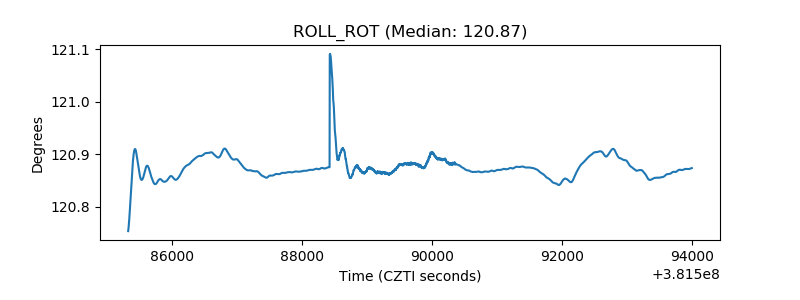 |
| _Roll_DEC | 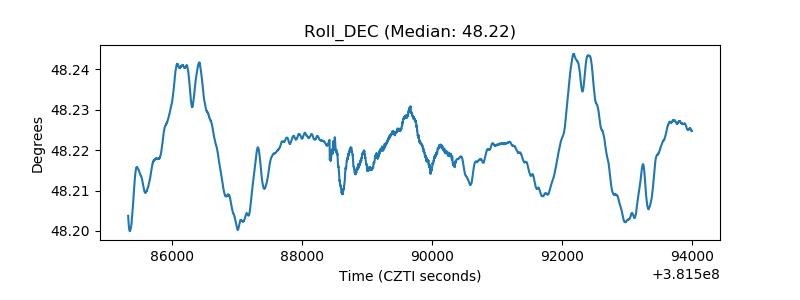 |
| _Roll_RA | 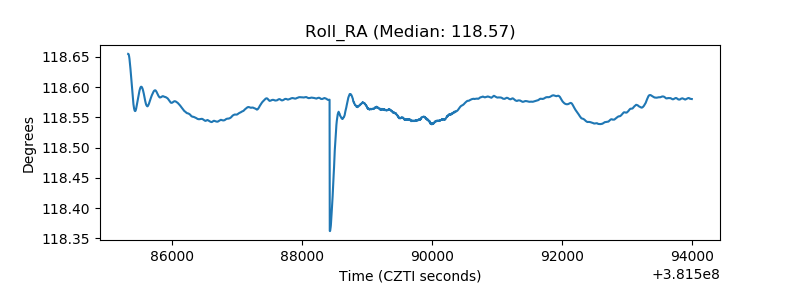 |
| Veto Counter | 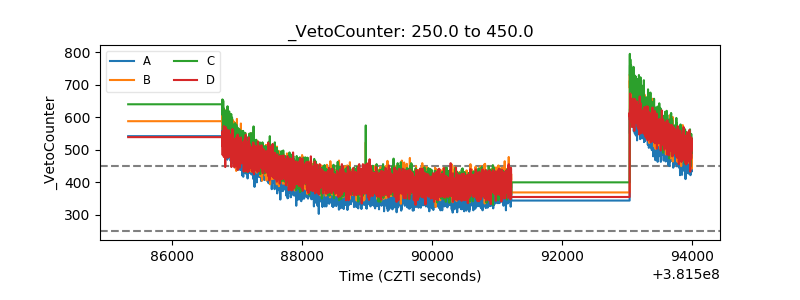 |