| Param | Original file | Final file |
|---|---|---|
| Filename | modeM0/AS1A11_047T01_9000004904_34345cztM0_level2.evt | modeM0/AS1A11_047T01_9000004904_34345cztM0_level2_quad_clean.evt |
| Size (bytes) | 129,358,080 | 19,033,920 |
| Size | 123.4 MB | 18.2 MB |
| Events in quadrant A | 730,988 | 119,285 |
| Events in quadrant B | 915,021 | 120,917 |
| Events in quadrant C | 932,770 | 119,325 |
| Events in quadrant D | 1,239,621 | 110,301 |
| Mode SS | |||
|---|---|---|---|
| Quadrant | BADHDUFLAG | Total packets | Discarded packets |
| A | 0 | 30 | 0 |
| B | 0 | 30 | 0 |
| C | 0 | 30 | 0 |
| D | 0 | 30 | 0 |
| Mode M0 | |||
|---|---|---|---|
| Quadrant | BADHDUFLAG | Total packets | Discarded packets |
| A | 0 | 3008 | 2 |
| B | 0 | 3554 | 1 |
| C | 0 | 3554 | 1 |
| D | 0 | 4658 | 1 |
| Mode M9 | |||
|---|---|---|---|
| Quadrant | BADHDUFLAG | Total packets | Discarded packets |
| A | 0 | 17 | 0 |
| B | 0 | 17 | 0 |
| C | 0 | 17 | 0 |
| D | 0 | 17 | 0 |
| Quadrant | Total seconds | Saturated seconds | Saturation percentage |
|---|---|---|---|
| A | 1426 | 2 | 0.140252% |
| B | 1426 | 59 | 4.137447% |
| C | 1426 | 79 | 5.539972% |
| D | 1426 | 67 | 4.698457% |
Noise dominated data is calculated using 1-second bins in cleaned event files. If a bin has >2000 counts, and if more than 50% of those come from <1% of pixels, then it is considered to be noise-dominated and hence unusable.
| Quadrant | # 1 sec bins | Bins with >0 counts | Bins with >2000 counts | High rate bins dominated by noise | Noise dominated (total time) | Noise dominated (detector-on time) | Marked lightcurve |
|---|---|---|---|---|---|---|---|
| A | 3099 | 1427 | 0 | 0 | 0.00% | 0.00% | 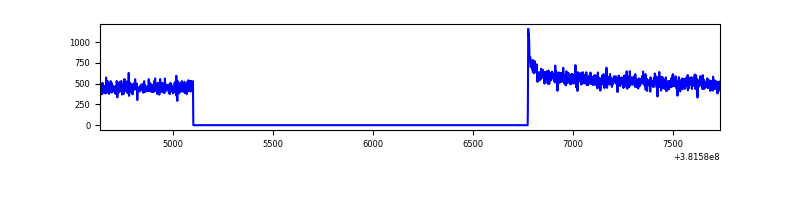 |
| B | 3099 | 1427 | 42 | 42 | 1.36% | 2.94% | 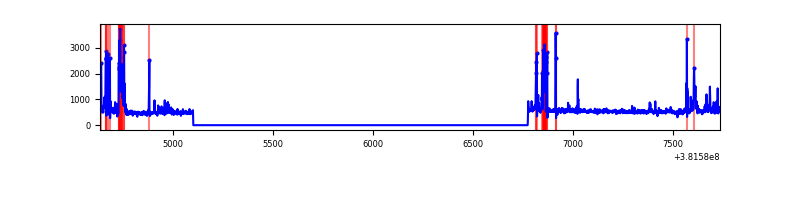 |
| C | 3099 | 1427 | 60 | 60 | 1.94% | 4.20% | 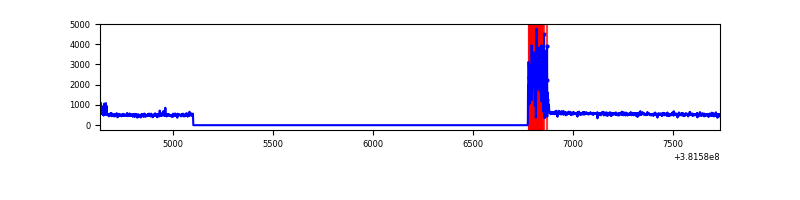 |
| D | 3099 | 1427 | 42 | 42 | 1.36% | 2.94% | 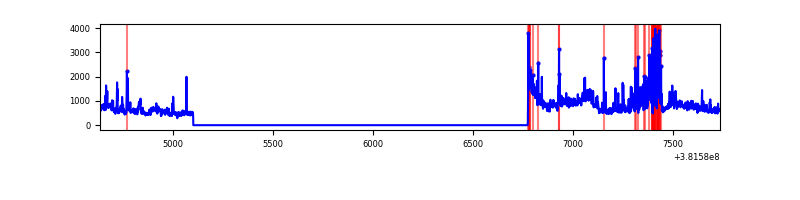 |
Top three noisy pixels from each quadrant. If the there are fewer than three noisy pixels in the level2.evt file, extra rows are filled as -1
| Pixel properties | Quadrant properties | ||||||
|---|---|---|---|---|---|---|---|
| Quadrant | DetID | PixID | Counts | Sigma | Mean | Median | Sigma |
| A | 10 | 83 | 14166 | 358.76 | 184 | 181 | 39.0 |
| A | 13 | 6 | 3643 | 88.81 | 184 | 181 | 39.0 |
| A | 13 | 254 | 2046 | 47.84 | 184 | 181 | 39.0 |
| B | 5 | 172 | 189623 | 5217.19 | 180 | 175 | 36.3 |
| B | 5 | 255 | 7766 | 209.05 | 180 | 175 | 36.3 |
| B | 4 | 251 | 5820 | 155.46 | 180 | 175 | 36.3 |
| C | 0 | 10 | 186768 | 4510.99 | 170 | 171 | 41.4 |
| C | 15 | 214 | 61076 | 1472.38 | 170 | 171 | 41.4 |
| C | 15 | 159 | 9580 | 227.46 | 170 | 171 | 41.4 |
| D | 12 | 235 | 369911 | 8256.99 | 174 | 169 | 44.8 |
| D | 8 | 195 | 91483 | 2039.2 | 174 | 169 | 44.8 |
| D | 2 | 250 | 49823 | 1108.86 | 174 | 169 | 44.8 |
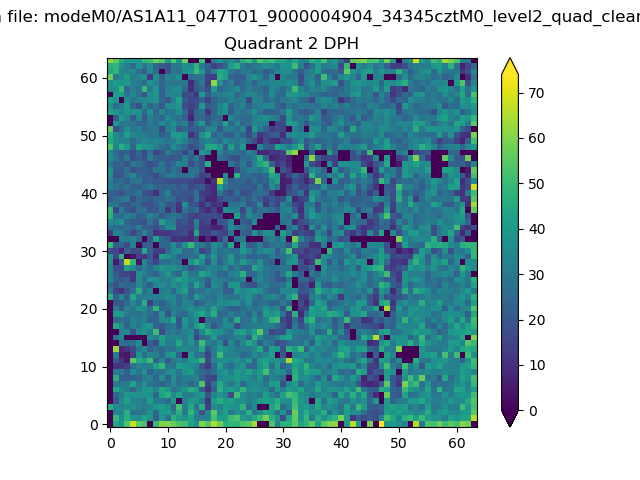
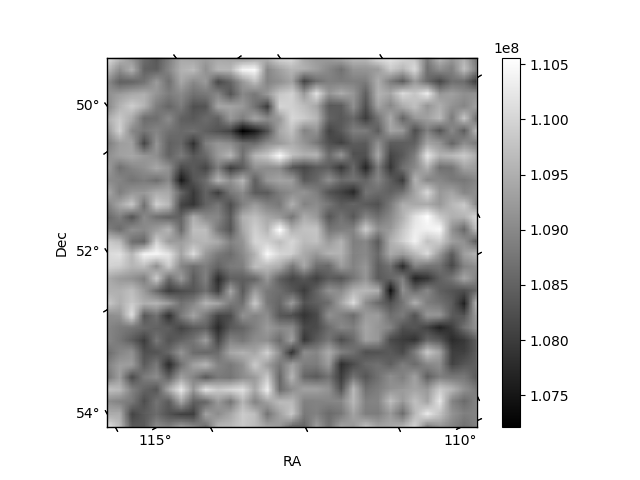
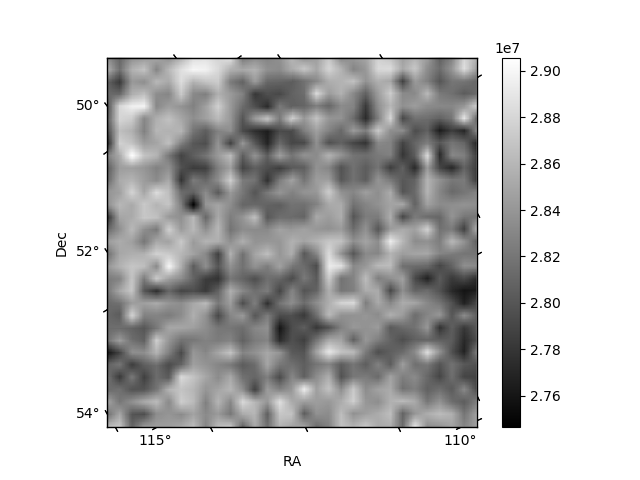
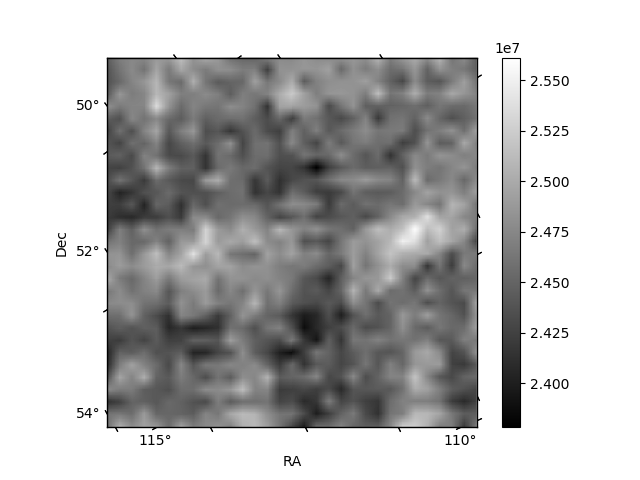
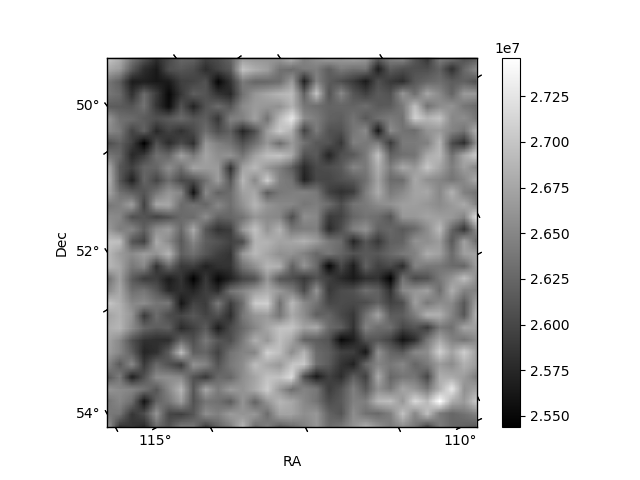
Histogram calculated using DETX and DETY for each event in the final _common_clean file
| Quadrant A | 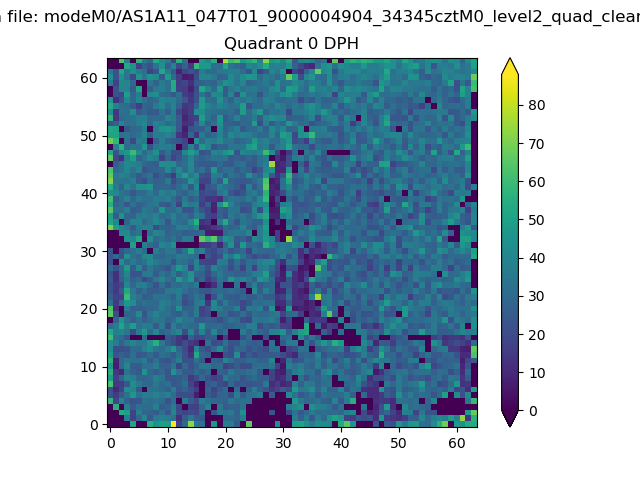 |
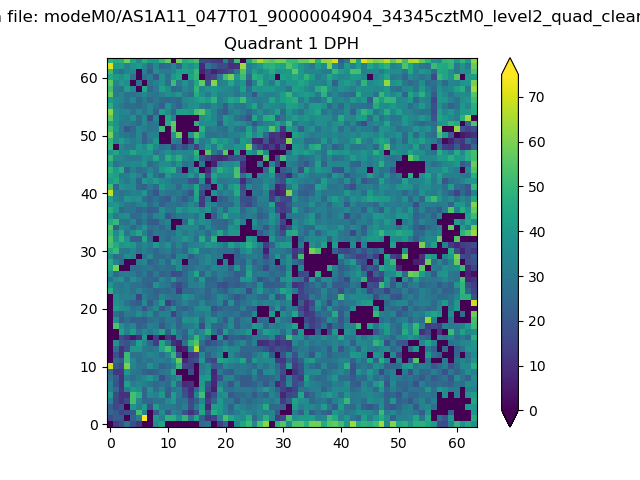 |
Quadrant B |
|---|---|---|---|
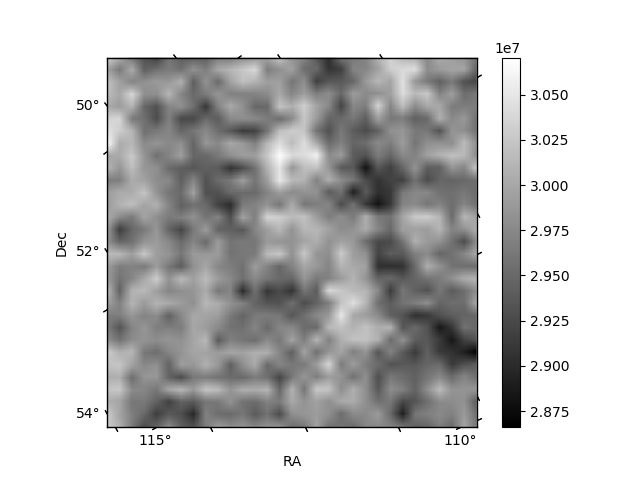
| Quadrant D | 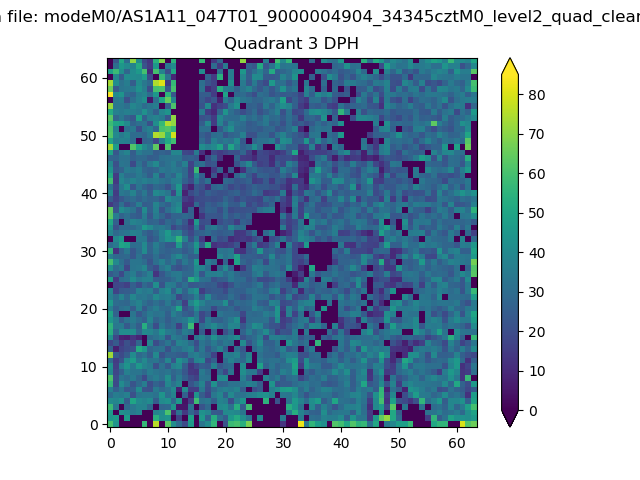 |
 |
Quadrant C |
| Plot type | Count rate plots | Images |
|---|---|---|
| Comparison with Poisson distribution Blue bars denote a histogram of data divided into 1 sec bins. Red curve is a Poisson curve with rate = median count rate of data. |
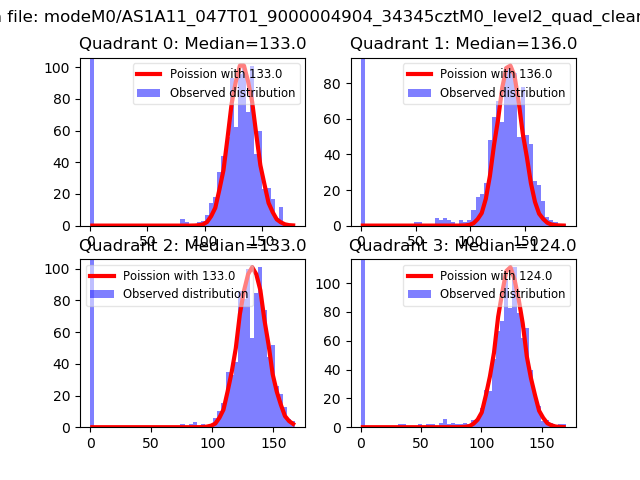 |
 |
| Quadrant-wise count rates Data is divided into 100 sec bins |
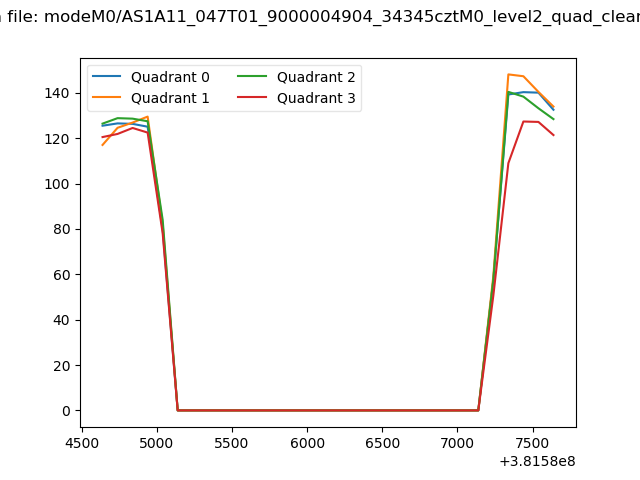 |
|
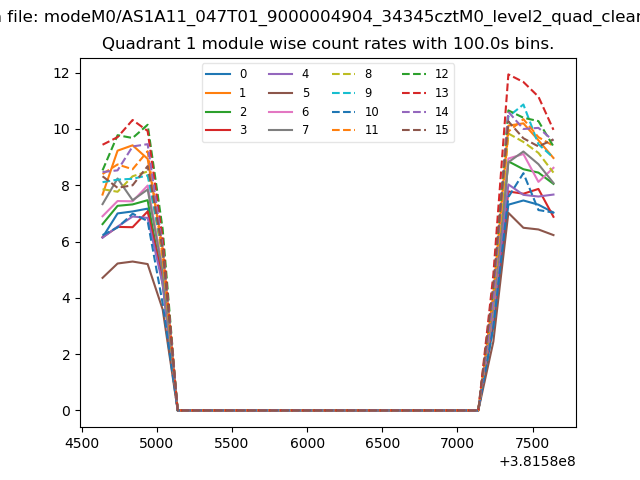
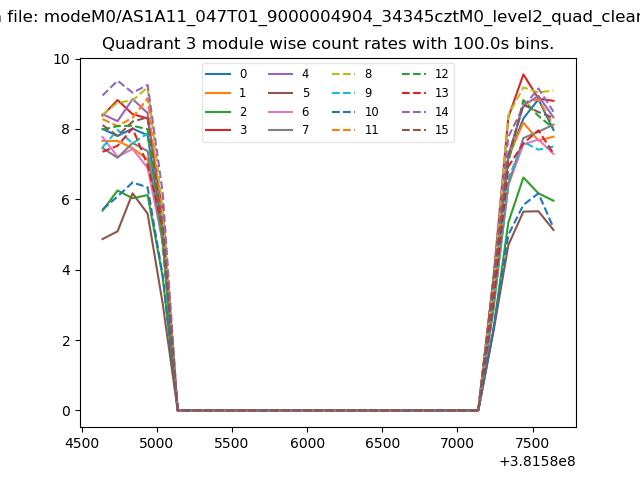
| Module-wise count rates for Quadrant A Data is divided into 100 sec bins |
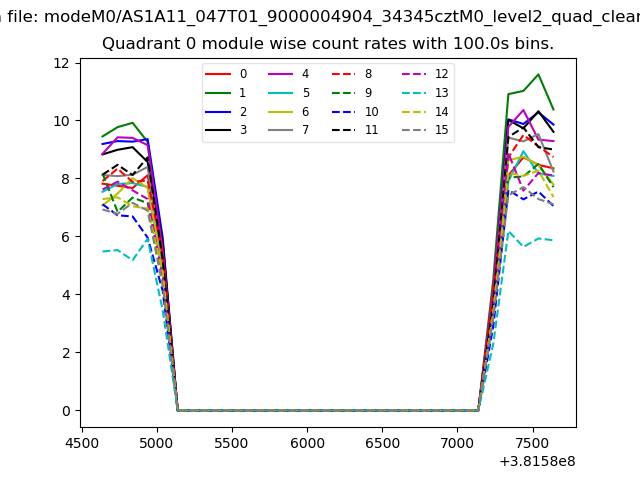 |
 |
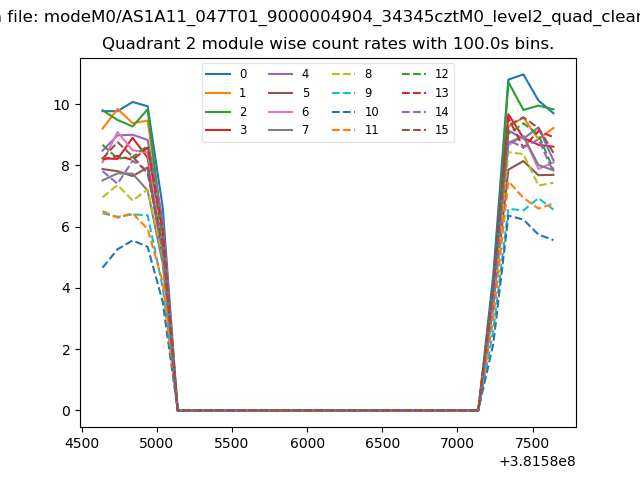
| Module-wise count rates for Quadrant B Data is divided into 100 sec bins |
 |
 |
| Module-wise count rates for Quadrant C Data is divided into 100 sec bins |
 |
 |
| Module-wise count rates for Quadrant D Data is divided into 100 sec bins |
 |
 |
| Parameter | Plot |
|---|---|
| CZT HV Monitor | 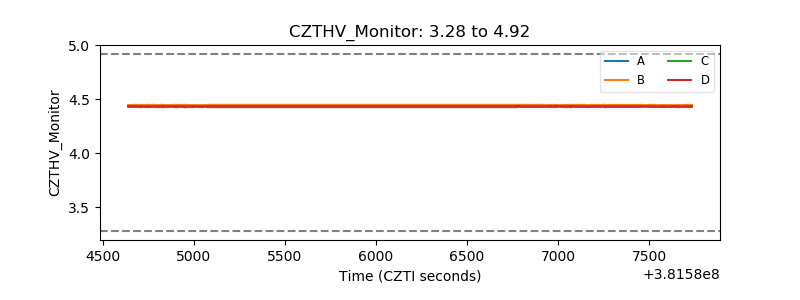 |
| D_VDD | 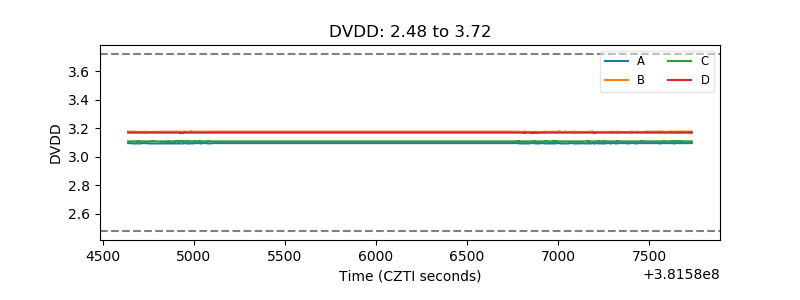 |
| Temperature 1 | 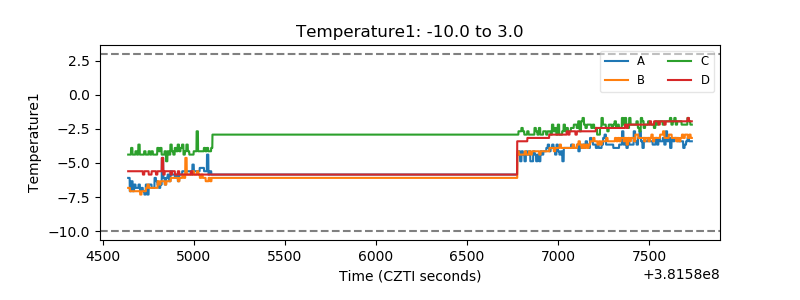 |
| Veto HV Monitor | 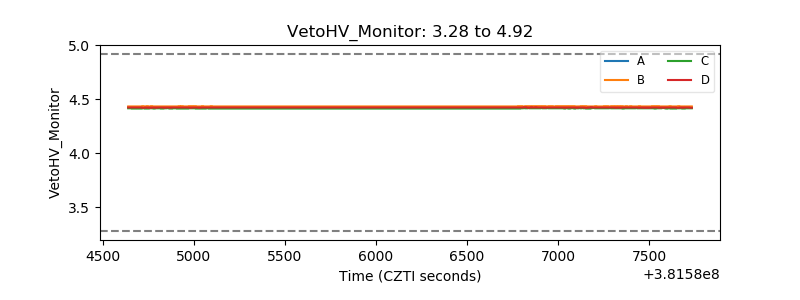 |
| Veto LLD | 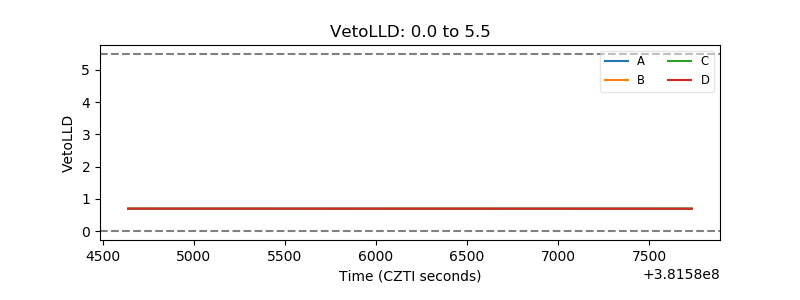 |
| Alpha Counter | 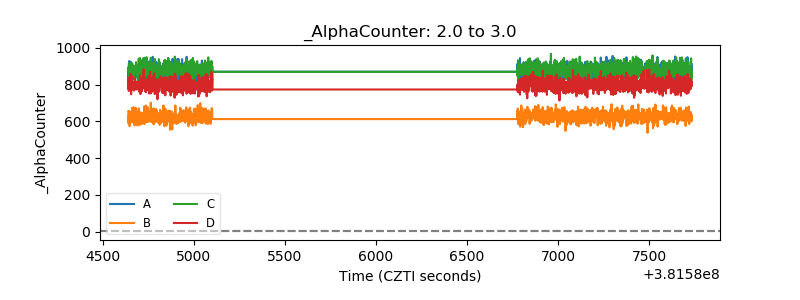 |
| _CPM_Rate | 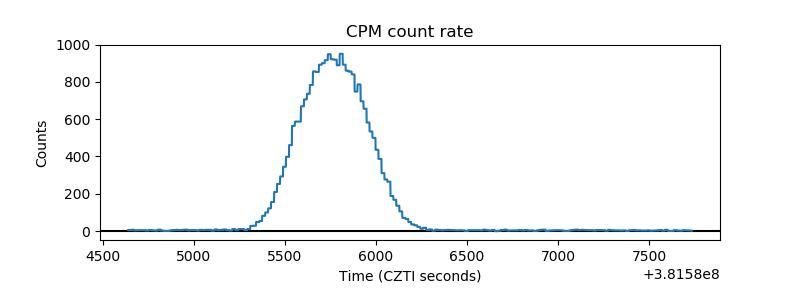 |
| CZT Counter | 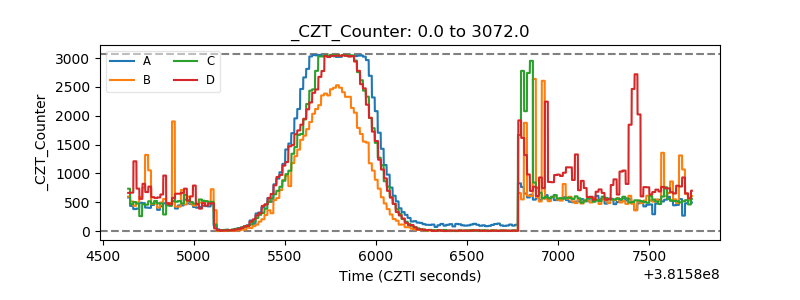 |
| +2.5 Volts monitor | 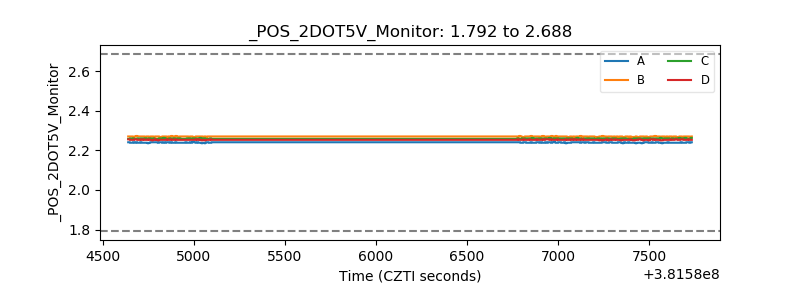 |
| +5 Volts monitor | 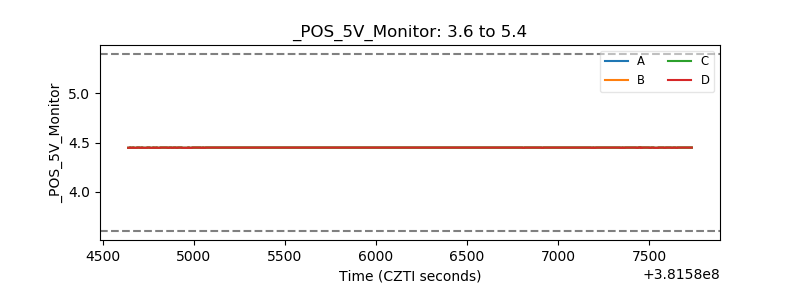 |
| _ROLL_ROT | 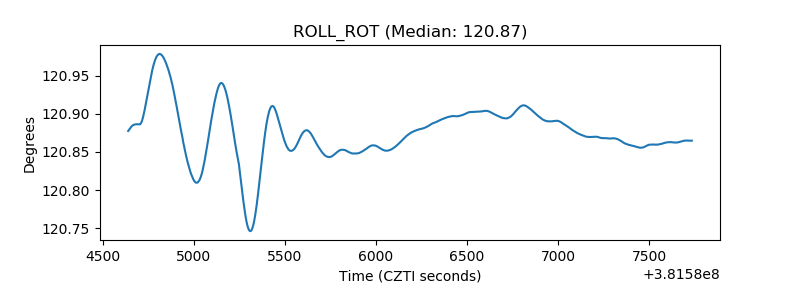 |
| _Roll_DEC | 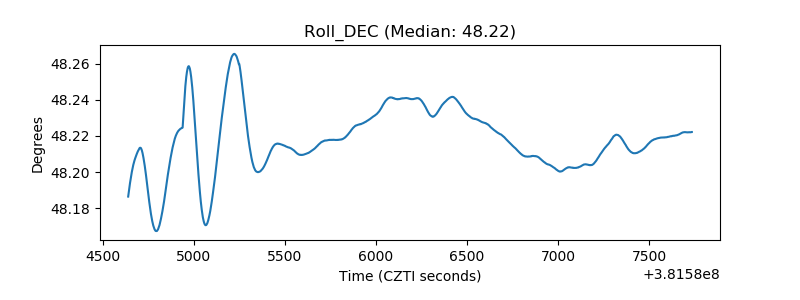 |
| _Roll_RA | 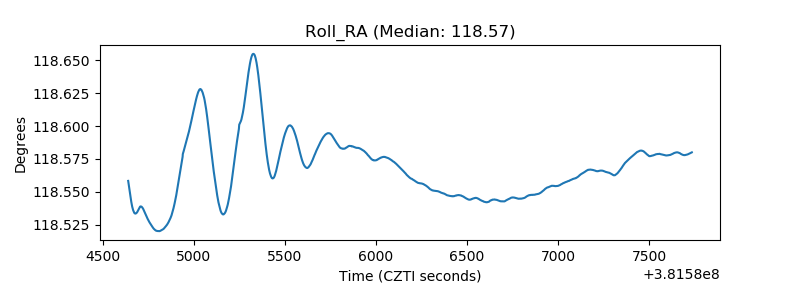 |
| Veto Counter | 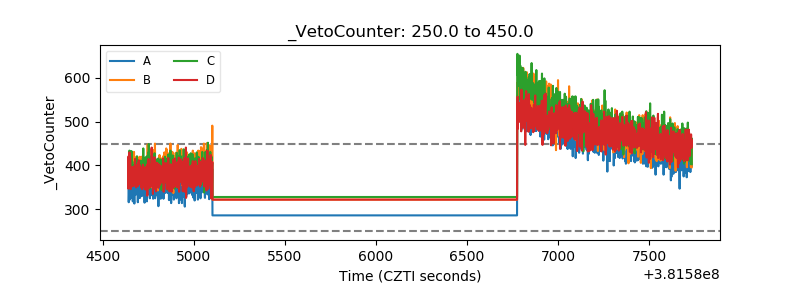 |