| Param | Original file | Final file |
|---|---|---|
| Filename | modeM0/AS1A05_019T01_9000004906_34372cztM0_level2.evt | modeM0/AS1A05_019T01_9000004906_34372cztM0_level2_quad_clean.evt |
| Size (bytes) | 664,488,000 | 61,050,240 |
| Size | 633.7 MB | 58.2 MB |
| Events in quadrant A | 2,343,048 | 409,847 |
| Events in quadrant B | 3,602,350 | 398,479 |
| Events in quadrant C | 5,482,217 | 388,259 |
| Events in quadrant D | 8,354,557 | 295,909 |
| Mode SS | |||
|---|---|---|---|
| Quadrant | BADHDUFLAG | Total packets | Discarded packets |
| A | 0 | 104 | 0 |
| B | 0 | 104 | 0 |
| C | 0 | 104 | 0 |
| D | 0 | 104 | 0 |
| Mode M0 | |||
|---|---|---|---|
| Quadrant | BADHDUFLAG | Total packets | Discarded packets |
| A | 0 | 10288 | 1 |
| B | 0 | 13975 | 1 |
| C | 0 | 19943 | 1 |
| D | 0 | 28394 | 1 |
| Mode M9 | |||
|---|---|---|---|
| Quadrant | BADHDUFLAG | Total packets | Discarded packets |
| A | 0 | 13 | 0 |
| B | 0 | 13 | 0 |
| C | 0 | 13 | 0 |
| D | 0 | 13 | 0 |
| Quadrant | Total seconds | Saturated seconds | Saturation percentage |
|---|---|---|---|
| A | 5062 | 18 | 0.355591% |
| B | 5062 | 254 | 5.017780% |
| C | 5062 | 444 | 8.771237% |
| D | 5062 | 2207 | 43.599368% |
Noise dominated data is calculated using 1-second bins in cleaned event files. If a bin has >2000 counts, and if more than 50% of those come from <1% of pixels, then it is considered to be noise-dominated and hence unusable.
| Quadrant | # 1 sec bins | Bins with >0 counts | Bins with >2000 counts | High rate bins dominated by noise | Noise dominated (total time) | Noise dominated (detector-on time) | Marked lightcurve |
|---|---|---|---|---|---|---|---|
| A | 6405 | 5063 | 5 | 5 | 0.08% | 0.10% |  |
| B | 6405 | 5063 | 182 | 182 | 2.84% | 3.59% |  |
| C | 6405 | 5063 | 395 | 395 | 6.17% | 7.80% |  |
| D | 6405 | 5062 | 1996 | 1996 | 31.16% | 39.43% |  |
Top three noisy pixels from each quadrant. If the there are fewer than three noisy pixels in the level2.evt file, extra rows are filled as -1
| Pixel properties | Quadrant properties | ||||||
|---|---|---|---|---|---|---|---|
| Quadrant | DetID | PixID | Counts | Sigma | Mean | Median | Sigma |
| A | 9 | 143 | 44272 | 363.77 | 589 | 577 | 120.1 |
| A | 10 | 83 | 19828 | 160.27 | 589 | 577 | 120.1 |
| A | 13 | 254 | 9574 | 74.9 | 589 | 577 | 120.1 |
| B | 5 | 31 | 609527 | 5469.16 | 577 | 562 | 111.3 |
| B | 5 | 172 | 404155 | 3624.7 | 577 | 562 | 111.3 |
| B | 4 | 251 | 76780 | 684.52 | 577 | 562 | 111.3 |
| C | 4 | 254 | 2896808 | 22129.15 | 560 | 564 | 130.9 |
| C | 15 | 214 | 207154 | 1578.48 | 560 | 564 | 130.9 |
| C | 14 | 67 | 129429 | 984.61 | 560 | 564 | 130.9 |
| D | 12 | 235 | 2428726 | 19238.0 | 467 | 458 | 126.2 |
| D | 7 | 223 | 2425189 | 19209.98 | 467 | 458 | 126.2 |
| D | 8 | 195 | 1389168 | 11002.08 | 467 | 458 | 126.2 |
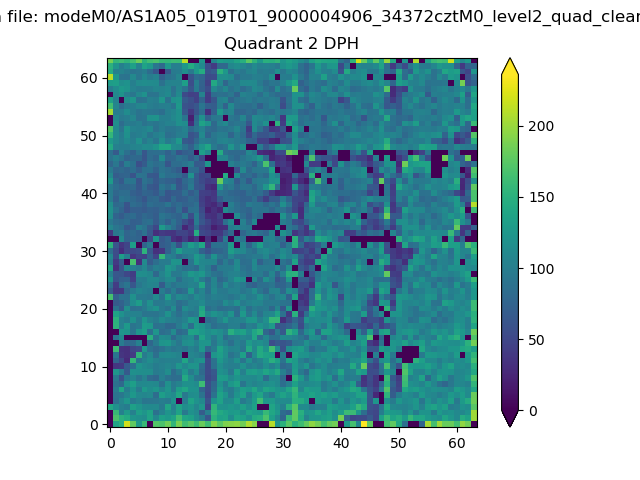
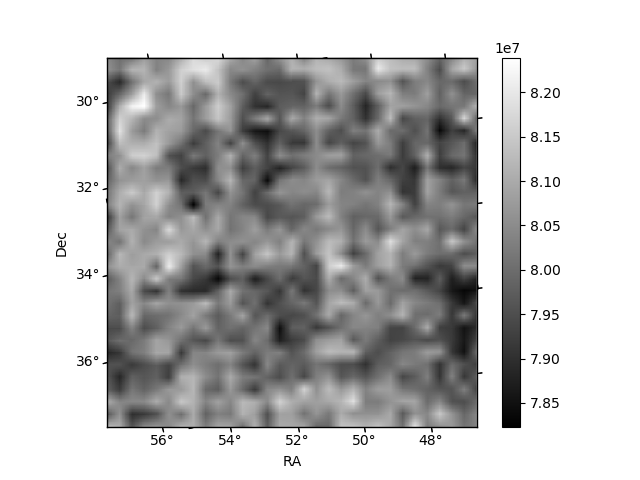
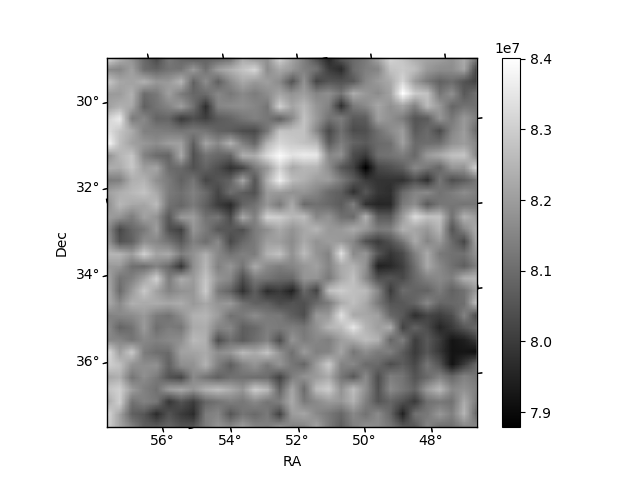
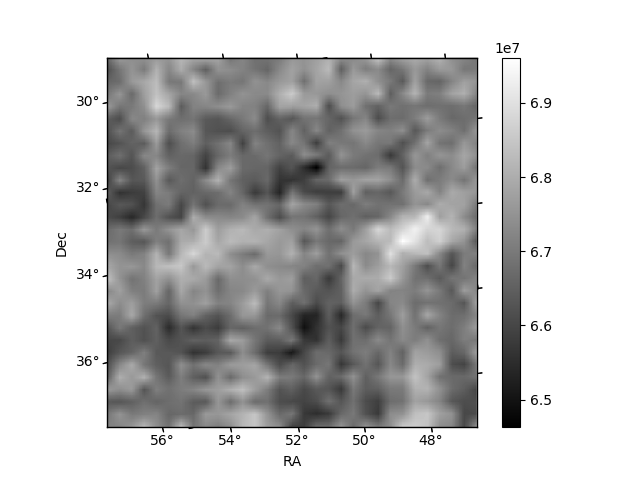
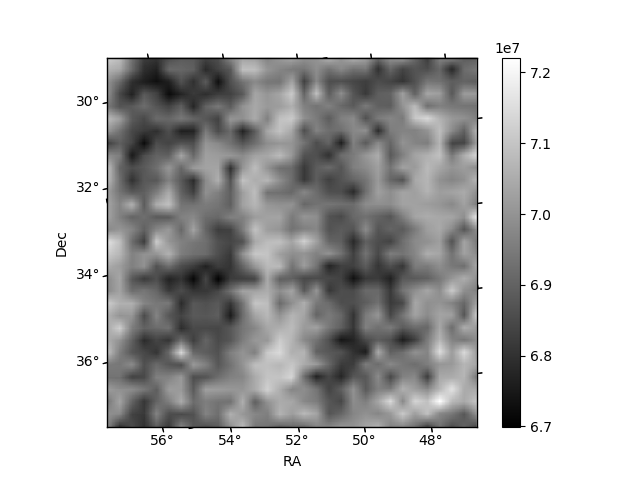
Histogram calculated using DETX and DETY for each event in the final _common_clean file
| Quadrant A | 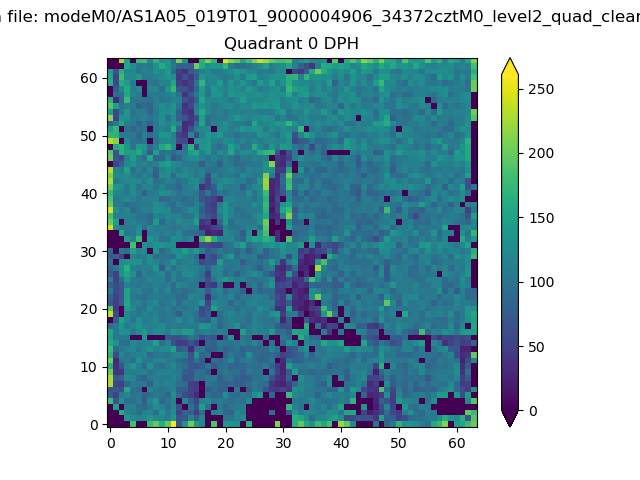 |
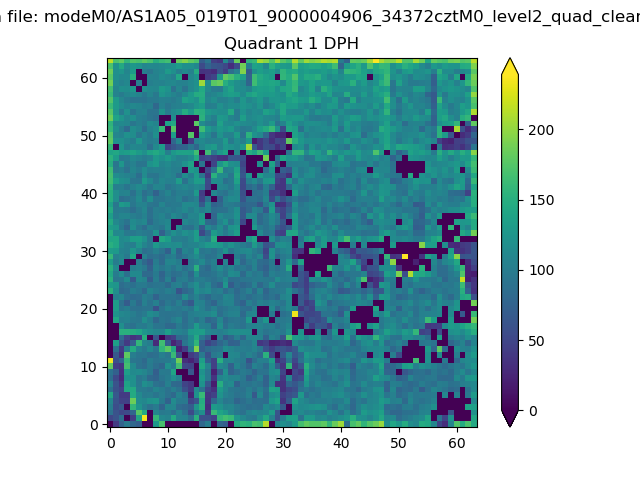 |
Quadrant B |
|---|---|---|---|
| Quadrant D | 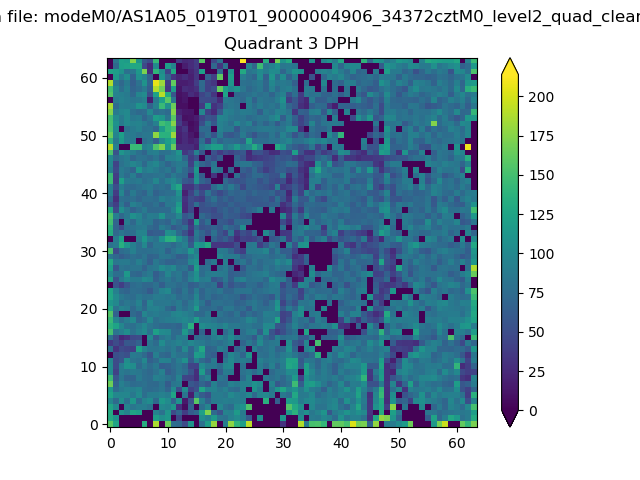 |
 |
Quadrant C |
| Plot type | Count rate plots | Images |
|---|---|---|
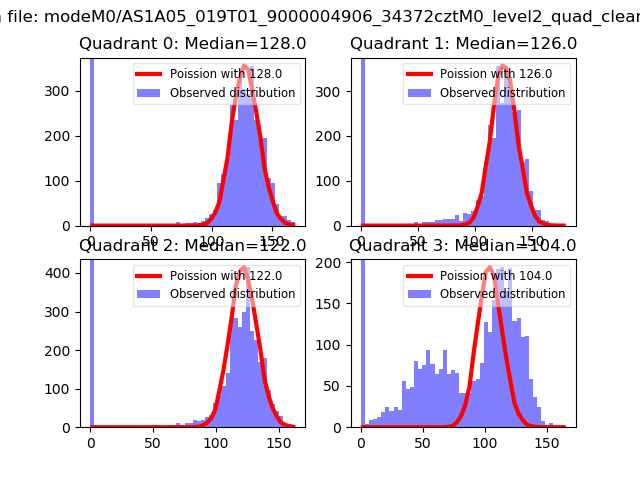
| Comparison with Poisson distribution Blue bars denote a histogram of data divided into 1 sec bins. Red curve is a Poisson curve with rate = median count rate of data. |
 |
 |
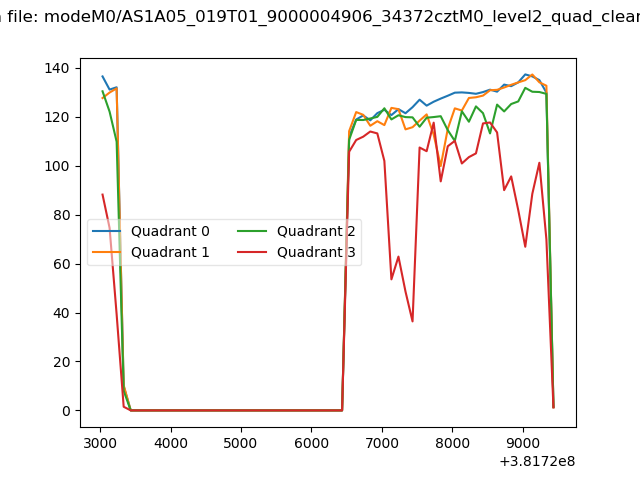
| Quadrant-wise count rates Data is divided into 100 sec bins |
 |
|
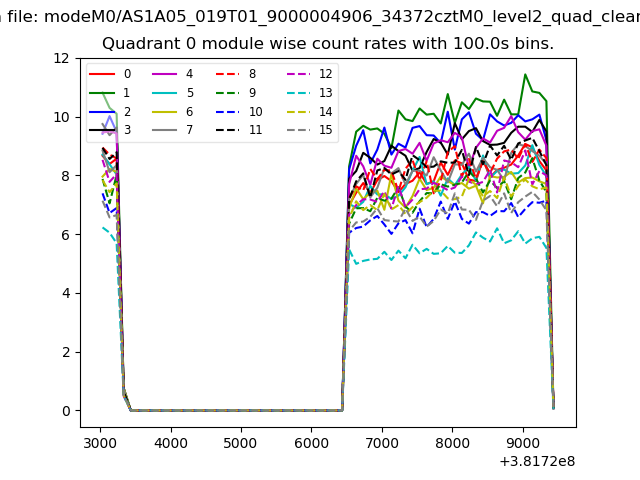
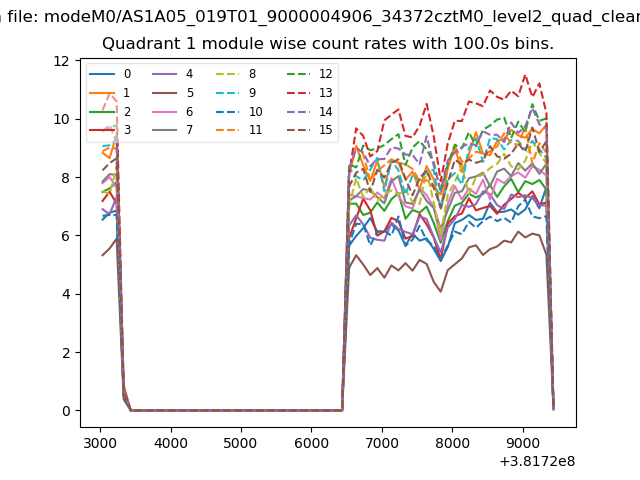
| Module-wise count rates for Quadrant A Data is divided into 100 sec bins |
 |
 |
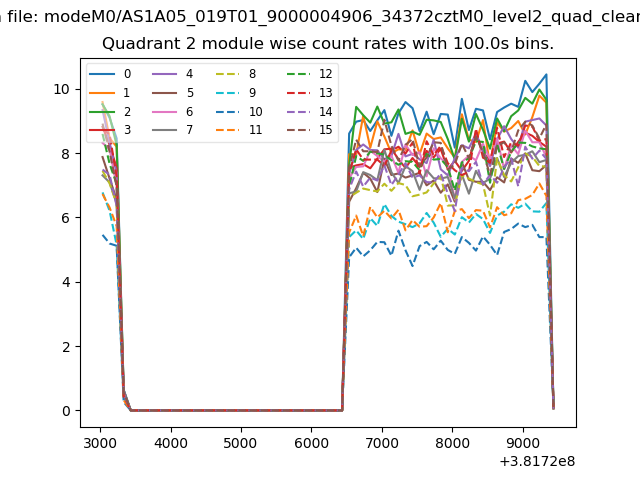
| Module-wise count rates for Quadrant B Data is divided into 100 sec bins |
 |
 |
| Module-wise count rates for Quadrant C Data is divided into 100 sec bins |
 |
 |
| Module-wise count rates for Quadrant D Data is divided into 100 sec bins |
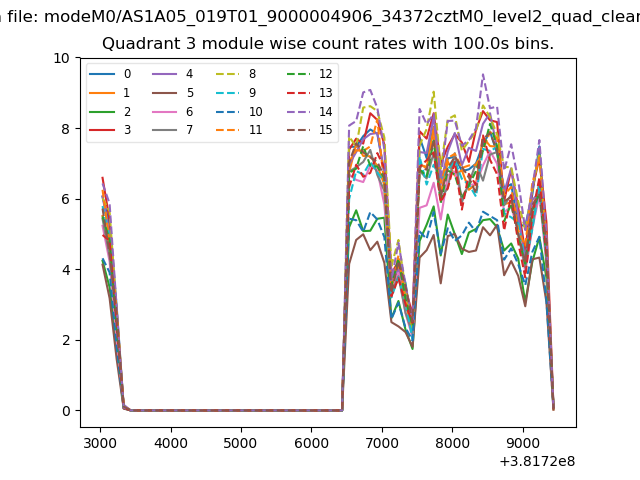 |
 |
| Parameter | Plot |
|---|---|
| CZT HV Monitor | 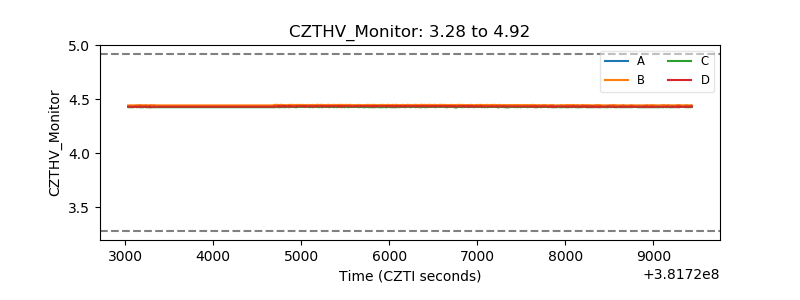 |
| D_VDD | 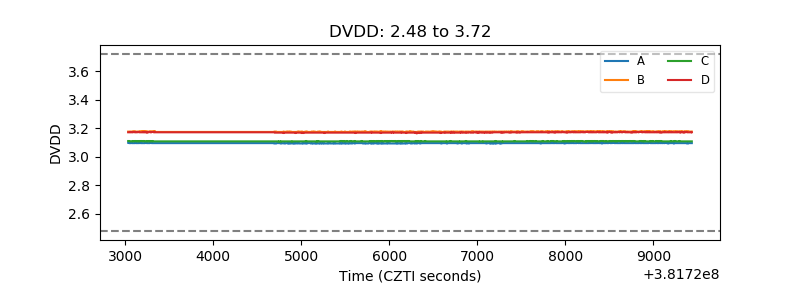 |
| Temperature 1 | 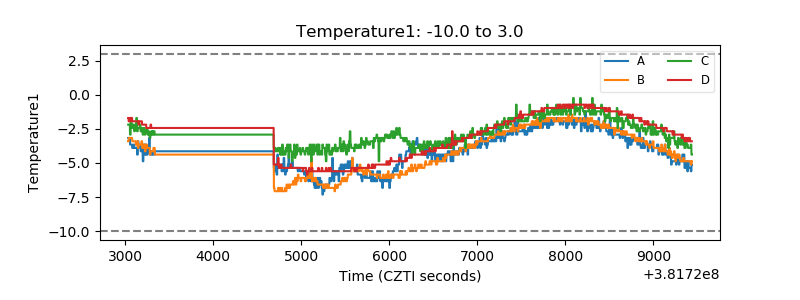 |
| Veto HV Monitor | 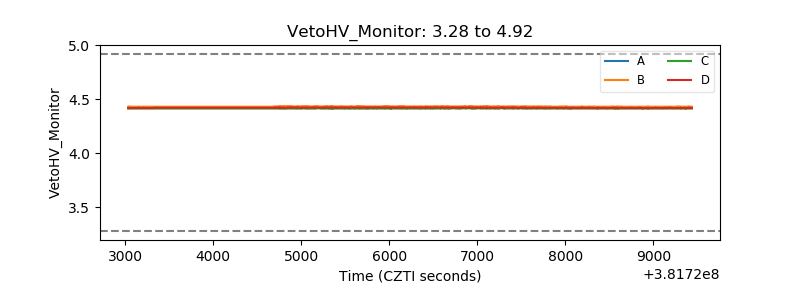 |
| Veto LLD | 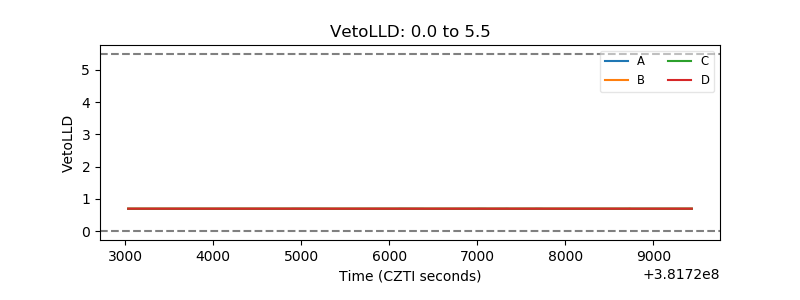 |
| Alpha Counter | 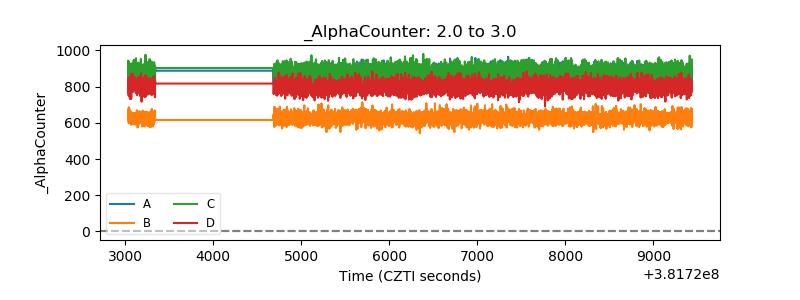 |
| _CPM_Rate | 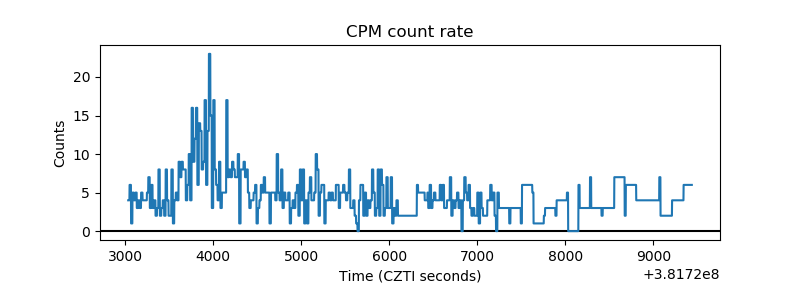 |
| CZT Counter | 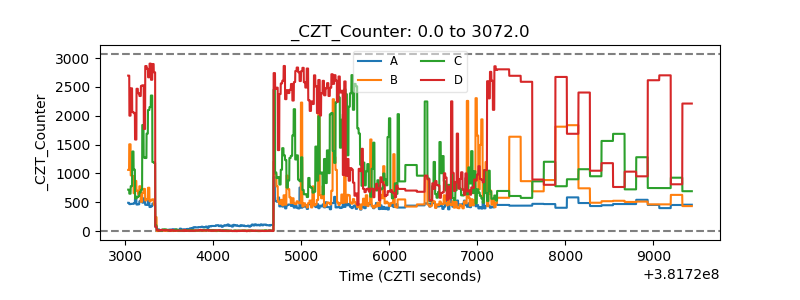 |
| +2.5 Volts monitor | 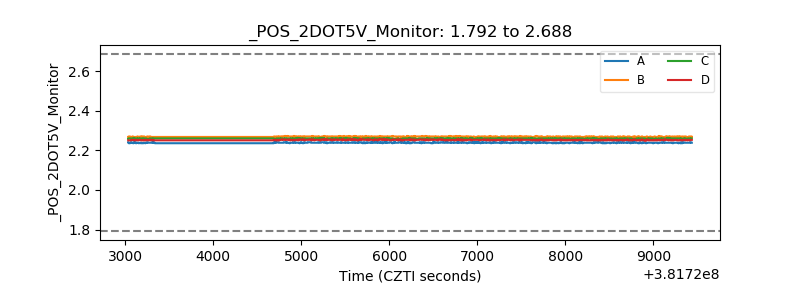 |
| +5 Volts monitor | 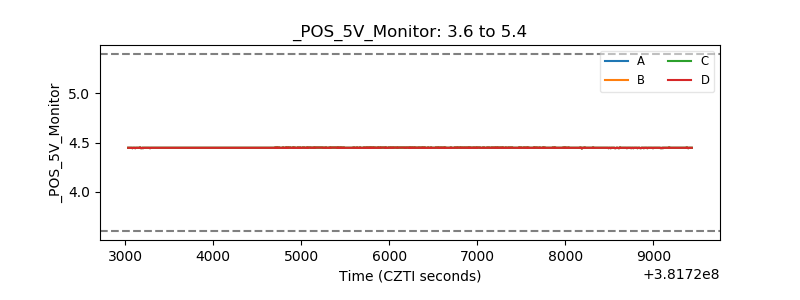 |
| _ROLL_ROT | 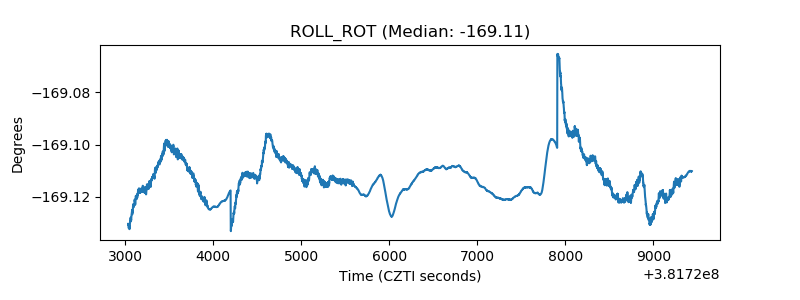 |
| _Roll_DEC | 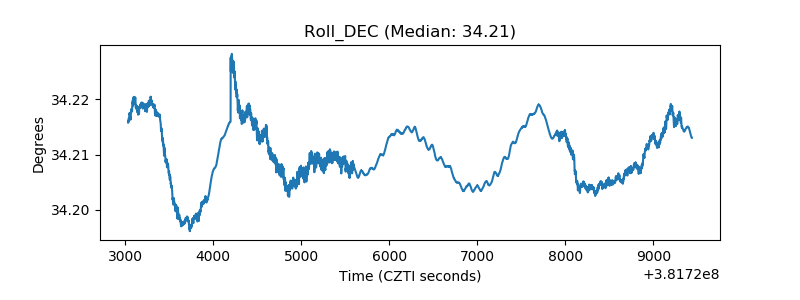 |
| _Roll_RA | 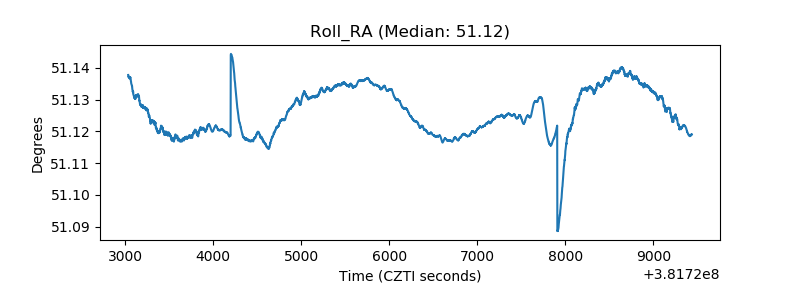 |
| Veto Counter | 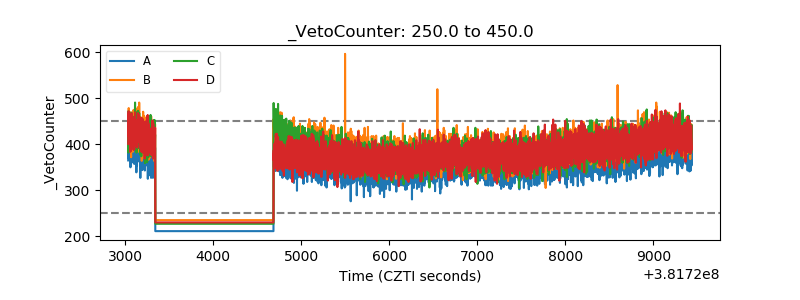 |