| Param | Original file | Final file |
|---|---|---|
| Filename | modeM0/AS1A05_019T01_9000004906_34361cztM0_level2.evt | modeM0/AS1A05_019T01_9000004906_34361cztM0_level2_quad_clean.evt |
| Size (bytes) | 714,061,440 | 81,069,120 |
| Size | 681.0 MB | 77.3 MB |
| Events in quadrant A | 2,576,945 | 592,966 |
| Events in quadrant B | 3,238,134 | 589,014 |
| Events in quadrant C | 5,057,540 | 529,374 |
| Events in quadrant D | 10,386,578 | 363,072 |
| Mode SS | |||
|---|---|---|---|
| Quadrant | BADHDUFLAG | Total packets | Discarded packets |
| A | 0 | 110 | 0 |
| B | 0 | 110 | 0 |
| C | 0 | 110 | 0 |
| D | 0 | 110 | 0 |
| Mode M0 | |||
|---|---|---|---|
| Quadrant | BADHDUFLAG | Total packets | Discarded packets |
| A | 0 | 11212 | 2 |
| B | 0 | 13065 | 1 |
| C | 0 | 18480 | 1 |
| D | 0 | 34432 | 1 |
| Mode M9 | |||
|---|---|---|---|
| Quadrant | BADHDUFLAG | Total packets | Discarded packets |
| A | 0 | 19 | 0 |
| B | 0 | 19 | 0 |
| C | 0 | 19 | 0 |
| D | 0 | 20 | 0 |
| Quadrant | Total seconds | Saturated seconds | Saturation percentage |
|---|---|---|---|
| A | 5418 | 7 | 0.129199% |
| B | 5418 | 82 | 1.513474% |
| C | 5418 | 1020 | 18.826135% |
| D | 5418 | 3325 | 61.369509% |
Noise dominated data is calculated using 1-second bins in cleaned event files. If a bin has >2000 counts, and if more than 50% of those come from <1% of pixels, then it is considered to be noise-dominated and hence unusable.
| Quadrant | # 1 sec bins | Bins with >0 counts | Bins with >2000 counts | High rate bins dominated by noise | Noise dominated (total time) | Noise dominated (detector-on time) | Marked lightcurve |
|---|---|---|---|---|---|---|---|
| A | 7150 | 5419 | 3 | 3 | 0.04% | 0.06% | 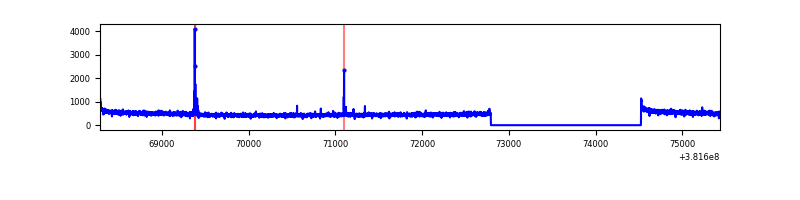 |
| B | 7150 | 5419 | 47 | 47 | 0.66% | 0.87% | 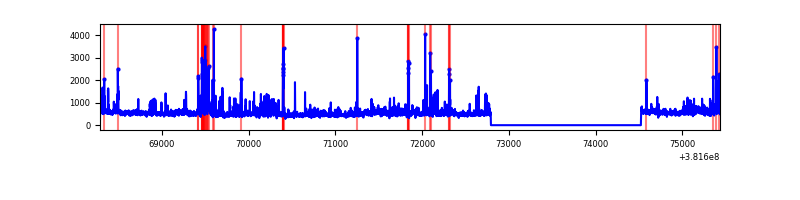 |
| C | 7150 | 5419 | 730 | 730 | 10.21% | 13.47% | 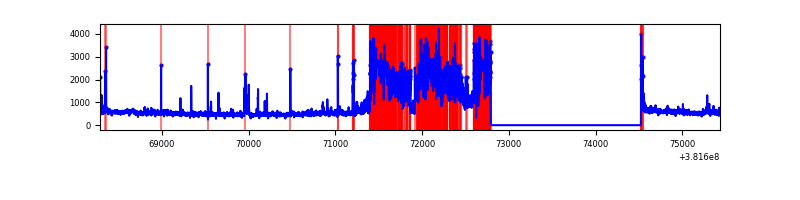 |
| D | 7150 | 5419 | 3194 | 3194 | 44.67% | 58.94% | 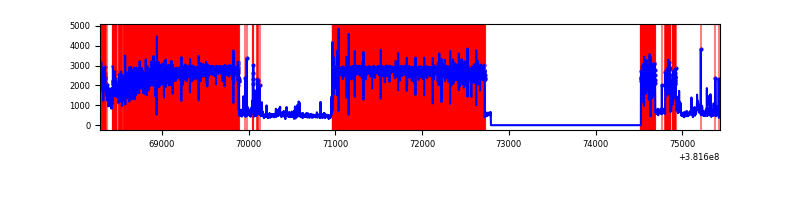 |
Top three noisy pixels from each quadrant. If the there are fewer than three noisy pixels in the level2.evt file, extra rows are filled as -1
| Pixel properties | Quadrant properties | ||||||
|---|---|---|---|---|---|---|---|
| Quadrant | DetID | PixID | Counts | Sigma | Mean | Median | Sigma |
| A | 10 | 83 | 32184 | 243.51 | 649 | 638 | 129.5 |
| A | 9 | 143 | 25659 | 193.14 | 649 | 638 | 129.5 |
| A | 13 | 6 | 15387 | 113.85 | 649 | 638 | 129.5 |
| B | 5 | 172 | 261018 | 2124.32 | 637 | 620 | 122.6 |
| B | 0 | 190 | 232097 | 1888.38 | 637 | 620 | 122.6 |
| B | 4 | 251 | 83678 | 677.58 | 637 | 620 | 122.6 |
| C | 4 | 254 | 2554226 | 20317.07 | 546 | 549 | 125.7 |
| C | 15 | 214 | 203737 | 1616.57 | 546 | 549 | 125.7 |
| C | 3 | 233 | 63661 | 502.12 | 546 | 549 | 125.7 |
| D | 7 | 223 | 7604749 | 71219.85 | 425 | 411 | 106.8 |
| D | 1 | 52 | 489000 | 4575.97 | 425 | 411 | 106.8 |
| D | 8 | 195 | 311069 | 2909.53 | 425 | 411 | 106.8 |
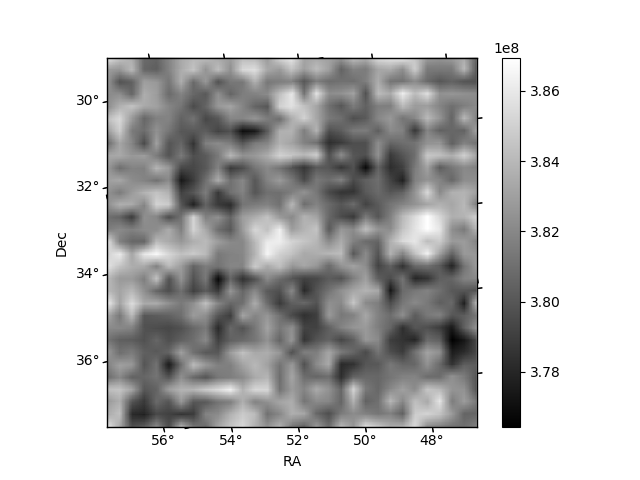
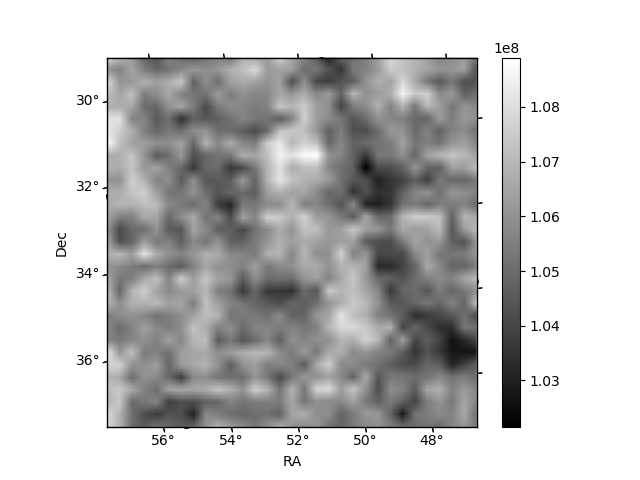
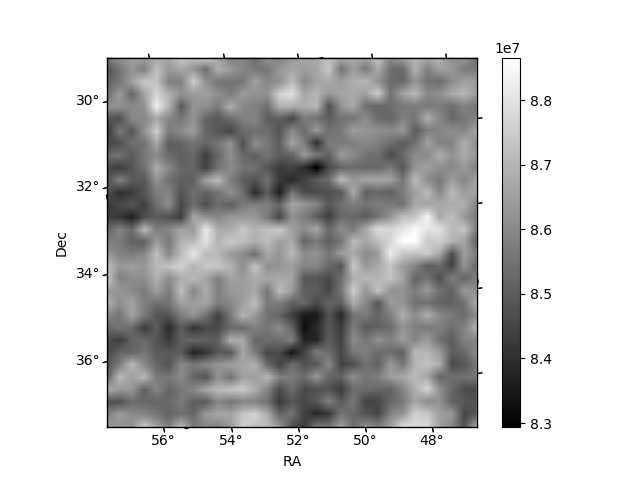
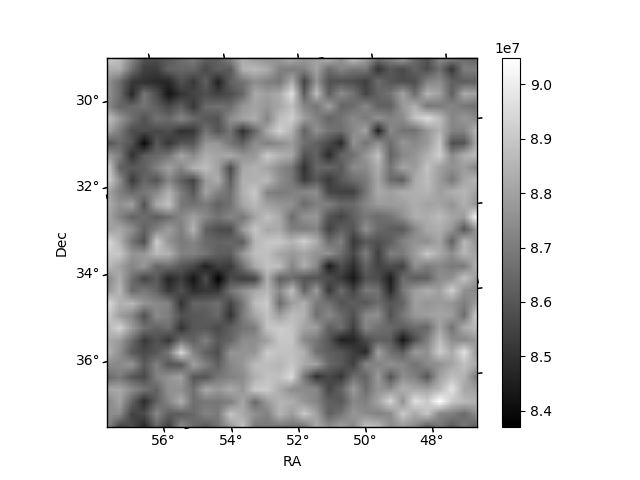
Histogram calculated using DETX and DETY for each event in the final _common_clean file
| Quadrant A | 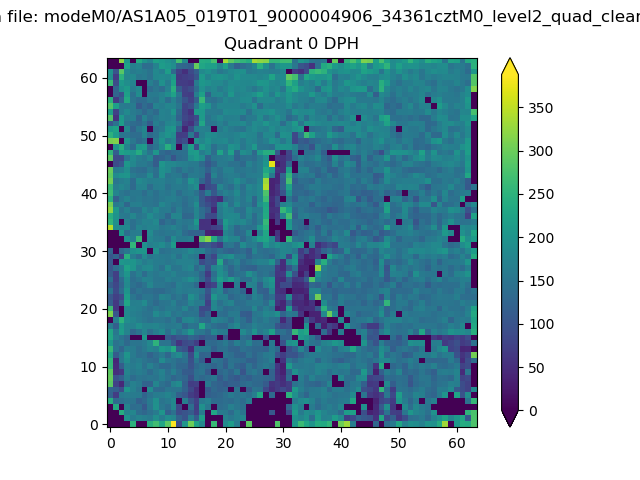 |
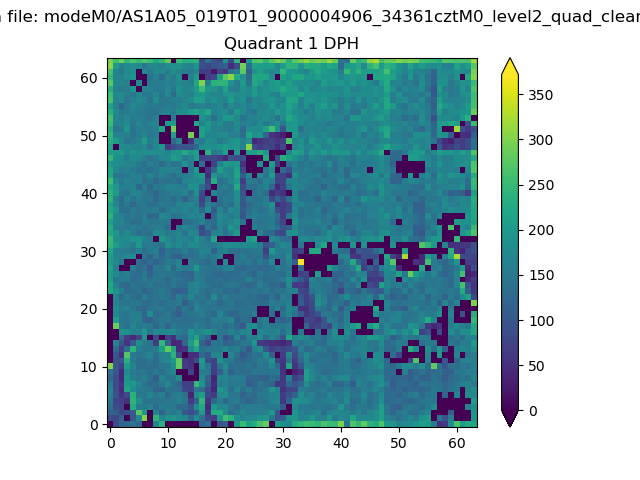 |
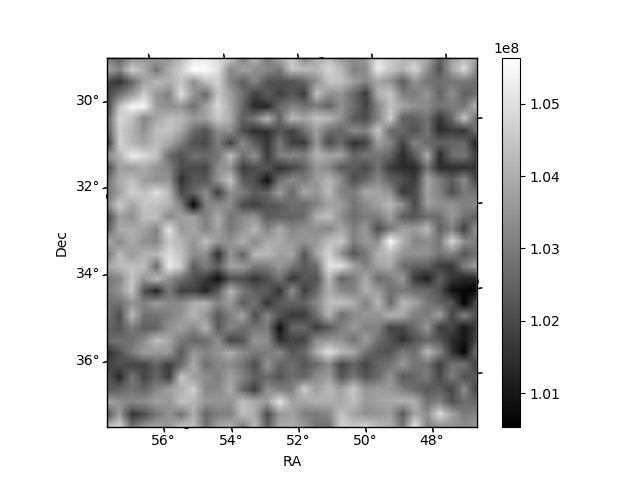
Quadrant B |
|---|---|---|---|
| Quadrant D | 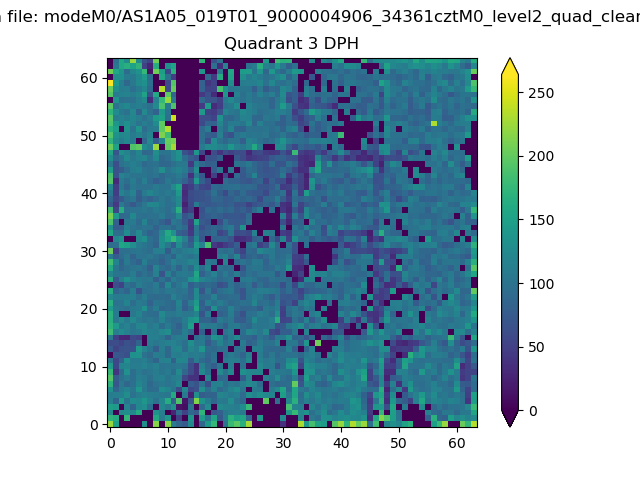 |
 |
Quadrant C |
| Plot type | Count rate plots | Images |
|---|---|---|
| Comparison with Poisson distribution Blue bars denote a histogram of data divided into 1 sec bins. Red curve is a Poisson curve with rate = median count rate of data. |
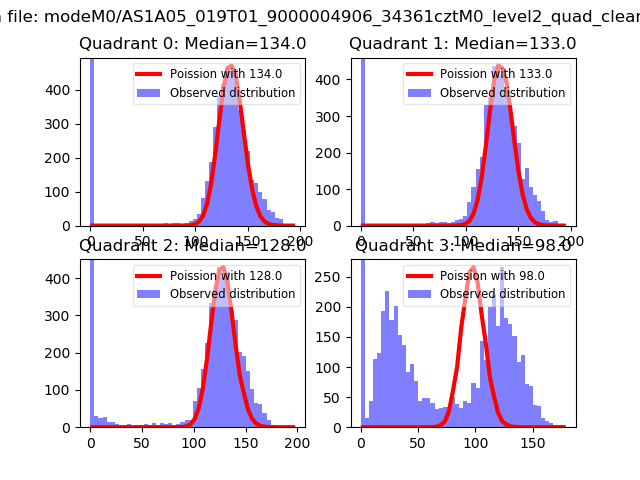 |
 |
| Quadrant-wise count rates Data is divided into 100 sec bins |
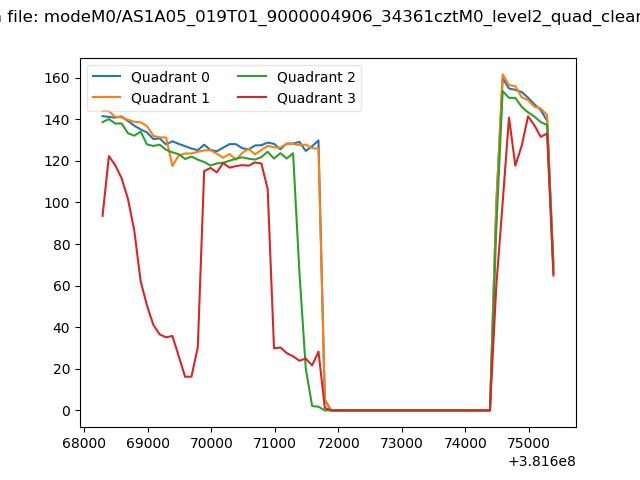 |
|
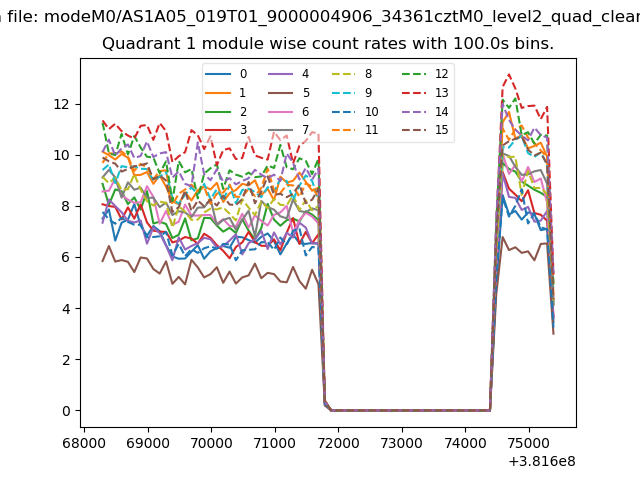
| Module-wise count rates for Quadrant A Data is divided into 100 sec bins |
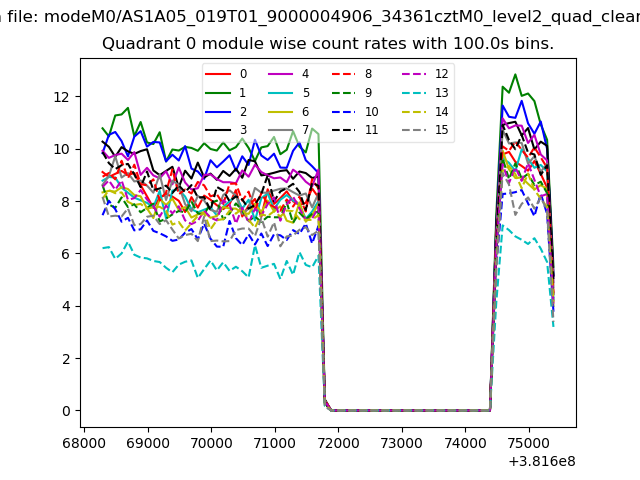 |
 |
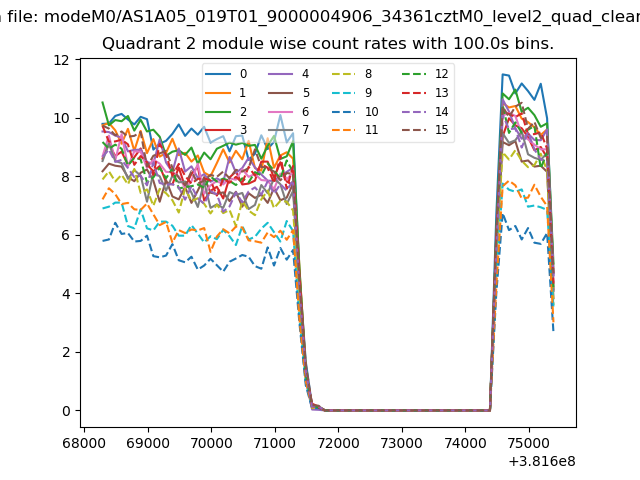
| Module-wise count rates for Quadrant B Data is divided into 100 sec bins |
 |
 |
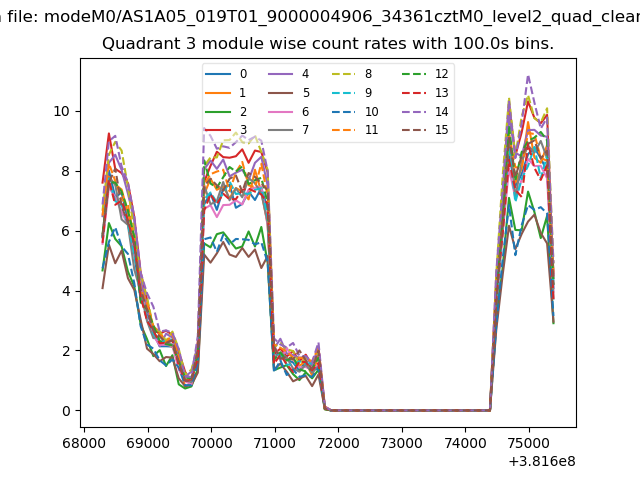
| Module-wise count rates for Quadrant C Data is divided into 100 sec bins |
 |
 |
| Module-wise count rates for Quadrant D Data is divided into 100 sec bins |
 |
 |
| Parameter | Plot |
|---|---|
| CZT HV Monitor | 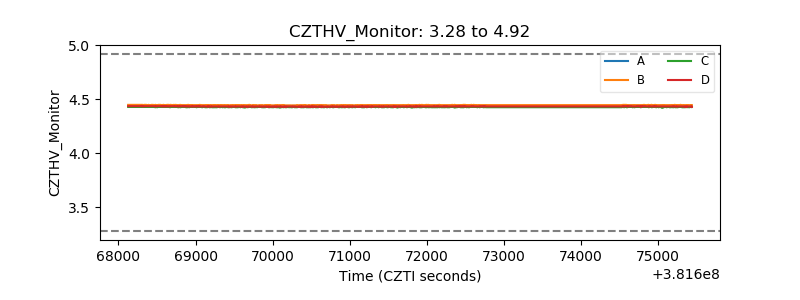 |
| D_VDD | 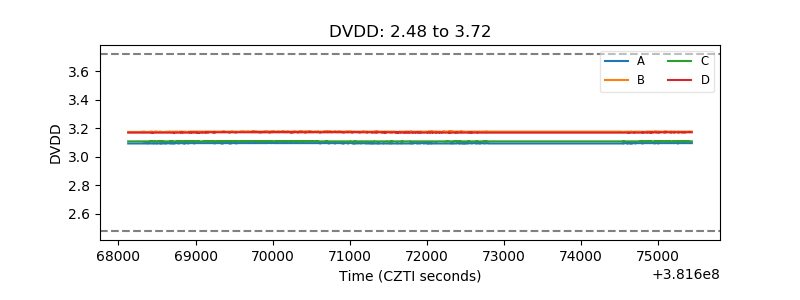 |
| Temperature 1 | 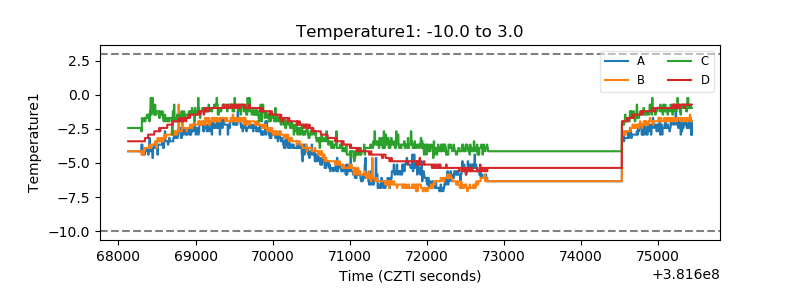 |
| Veto HV Monitor | 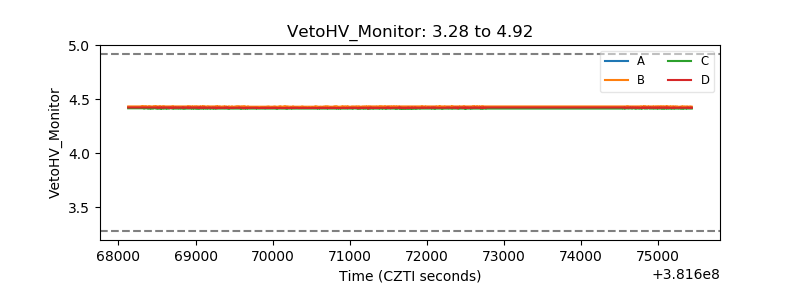 |
| Veto LLD | 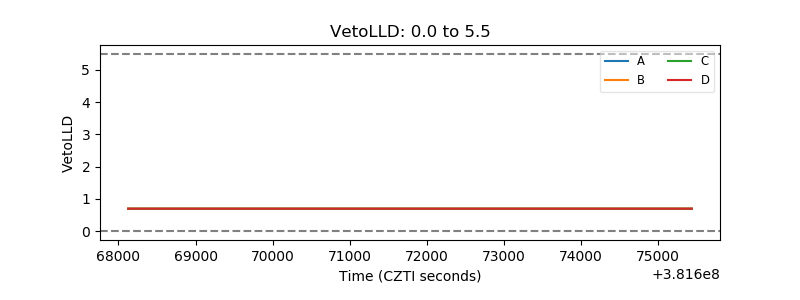 |
| Alpha Counter | 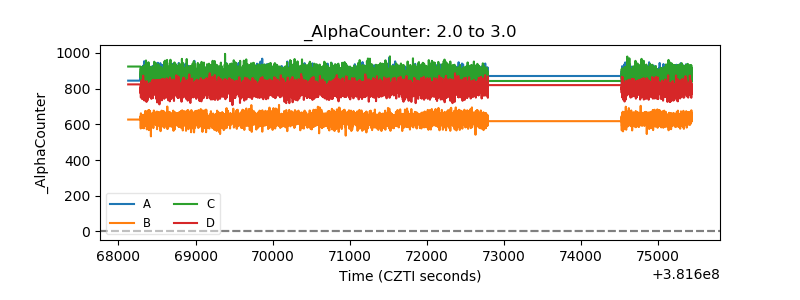 |
| _CPM_Rate | 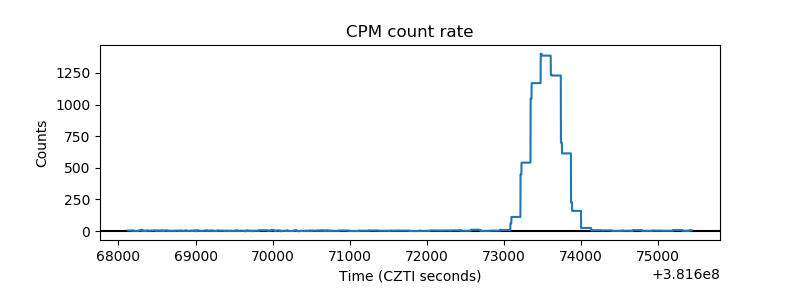 |
| CZT Counter | 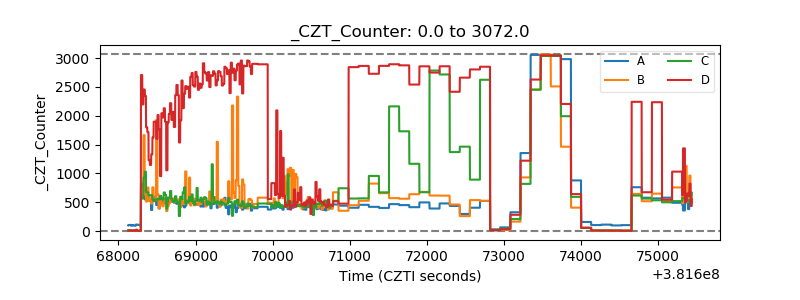 |
| +2.5 Volts monitor | 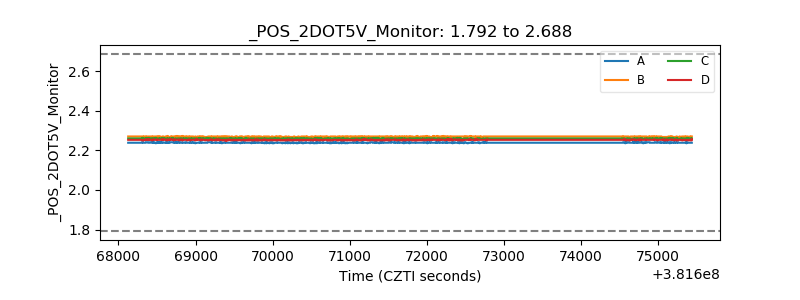 |
| +5 Volts monitor | 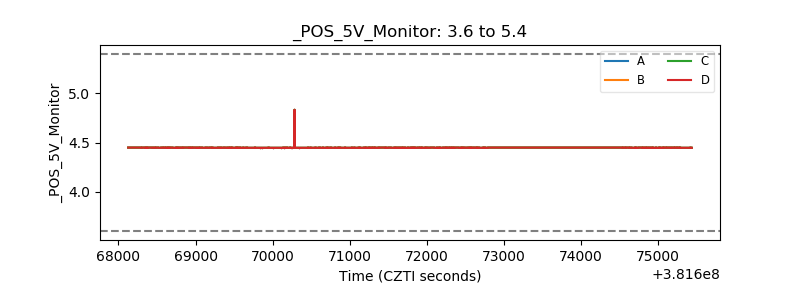 |
| _ROLL_ROT | 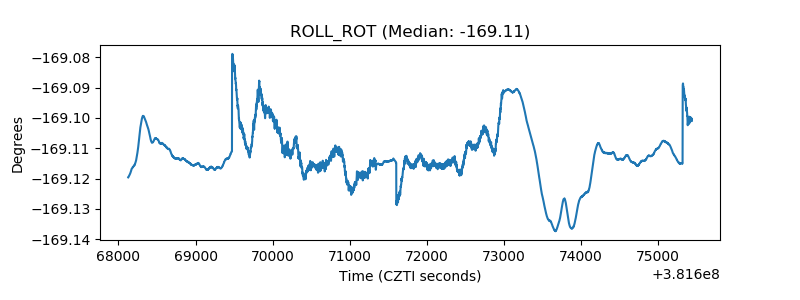 |
| _Roll_DEC | 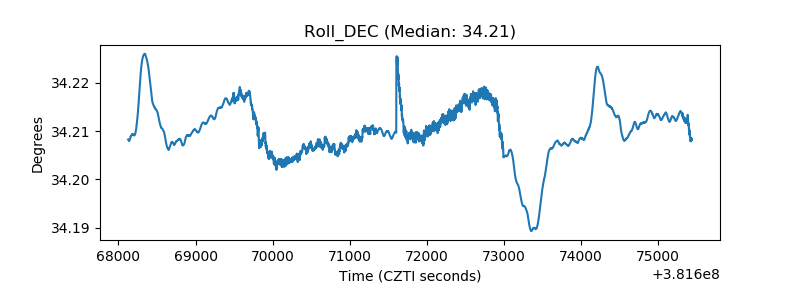 |
| _Roll_RA | 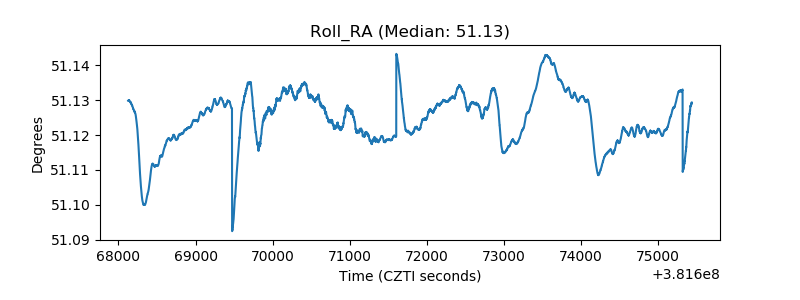 |
| Veto Counter | 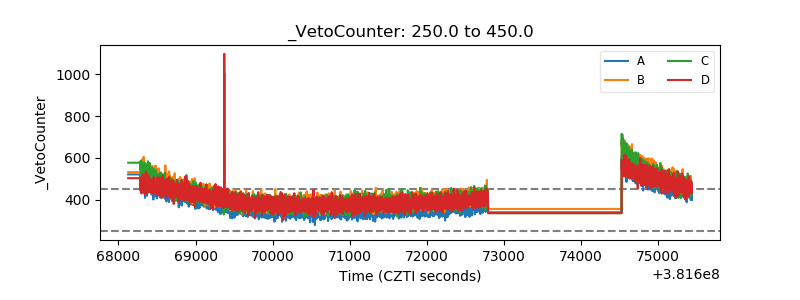 |