| Param | Original file | Final file |
|---|---|---|
| Filename | modeM0/AS1A05_019T01_9000004906_34354cztM0_level2.evt | modeM0/AS1A05_019T01_9000004906_34354cztM0_level2_quad_clean.evt |
| Size (bytes) | 777,807,360 | 61,649,280 |
| Size | 741.8 MB | 58.8 MB |
| Events in quadrant A | 2,861,921 | 389,045 |
| Events in quadrant B | 3,935,176 | 384,253 |
| Events in quadrant C | 3,574,865 | 383,726 |
| Events in quadrant D | 12,763,463 | 274,724 |
| Mode SS | |||
|---|---|---|---|
| Quadrant | BADHDUFLAG | Total packets | Discarded packets |
| A | 0 | 128 | 0 |
| B | 0 | 128 | 0 |
| C | 0 | 128 | 0 |
| D | 0 | 128 | 0 |
| Mode M0 | |||
|---|---|---|---|
| Quadrant | BADHDUFLAG | Total packets | Discarded packets |
| A | 0 | 12609 | 3 |
| B | 0 | 15816 | 2 |
| C | 0 | 14302 | 2 |
| D | 0 | 42080 | 2 |
| Mode M9 | |||
|---|---|---|---|
| Quadrant | BADHDUFLAG | Total packets | Discarded packets |
| A | 0 | 32 | 0 |
| B | 0 | 32 | 0 |
| C | 0 | 32 | 0 |
| D | 0 | 32 | 0 |
| Quadrant | Total seconds | Saturated seconds | Saturation percentage |
|---|---|---|---|
| A | 6223 | 10 | 0.160694% |
| B | 6223 | 254 | 4.081633% |
| C | 6223 | 71 | 1.140929% |
| D | 6223 | 3982 | 63.988430% |
Noise dominated data is calculated using 1-second bins in cleaned event files. If a bin has >2000 counts, and if more than 50% of those come from <1% of pixels, then it is considered to be noise-dominated and hence unusable.
| Quadrant | # 1 sec bins | Bins with >0 counts | Bins with >2000 counts | High rate bins dominated by noise | Noise dominated (total time) | Noise dominated (detector-on time) | Marked lightcurve |
|---|---|---|---|---|---|---|---|
| A | 9388 | 6225 | 2 | 2 | 0.02% | 0.03% | 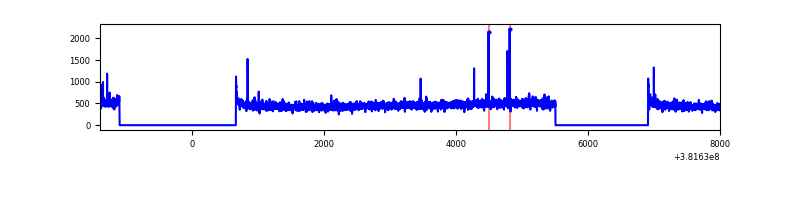 |
| B | 9388 | 6225 | 157 | 157 | 1.67% | 2.52% | 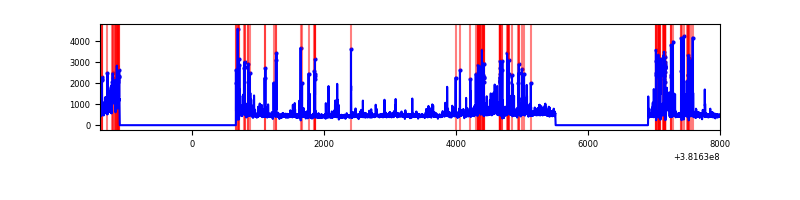 |
| C | 9388 | 6225 | 49 | 49 | 0.52% | 0.79% | 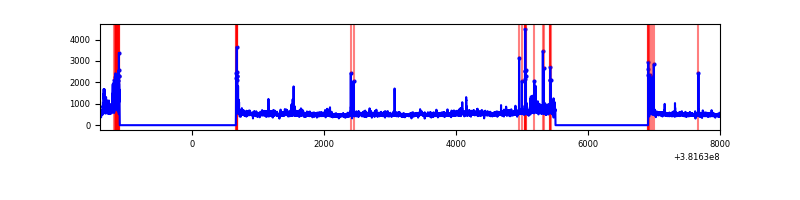 |
| D | 9387 | 6223 | 3748 | 3748 | 39.93% | 60.23% | 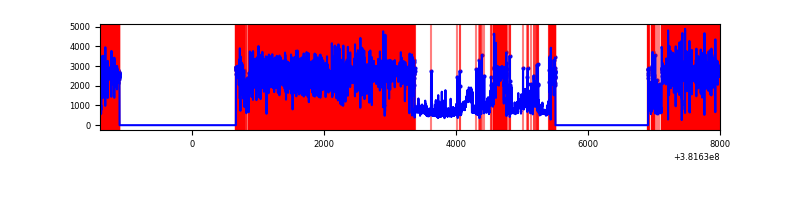 |
Top three noisy pixels from each quadrant. If the there are fewer than three noisy pixels in the level2.evt file, extra rows are filled as -1
| Pixel properties | Quadrant properties | ||||||
|---|---|---|---|---|---|---|---|
| Quadrant | DetID | PixID | Counts | Sigma | Mean | Median | Sigma |
| A | 10 | 83 | 32045 | 216.76 | 722 | 704 | 144.6 |
| A | 9 | 143 | 20529 | 137.11 | 722 | 704 | 144.6 |
| A | 13 | 6 | 16015 | 105.89 | 722 | 704 | 144.6 |
| B | 5 | 172 | 451017 | 3253.25 | 709 | 689 | 138.4 |
| B | 5 | 200 | 247551 | 1783.38 | 709 | 689 | 138.4 |
| B | 0 | 219 | 157442 | 1132.41 | 709 | 689 | 138.4 |
| C | 15 | 214 | 260392 | 1583.28 | 704 | 709 | 164.0 |
| C | 3 | 233 | 229189 | 1393.03 | 704 | 709 | 164.0 |
| C | 14 | 254 | 107858 | 653.28 | 704 | 709 | 164.0 |
| D | 7 | 223 | 8823487 | 77702.41 | 457 | 443 | 113.5 |
| D | 8 | 195 | 994747 | 8756.59 | 457 | 443 | 113.5 |
| D | 12 | 235 | 603740 | 5313.09 | 457 | 443 | 113.5 |
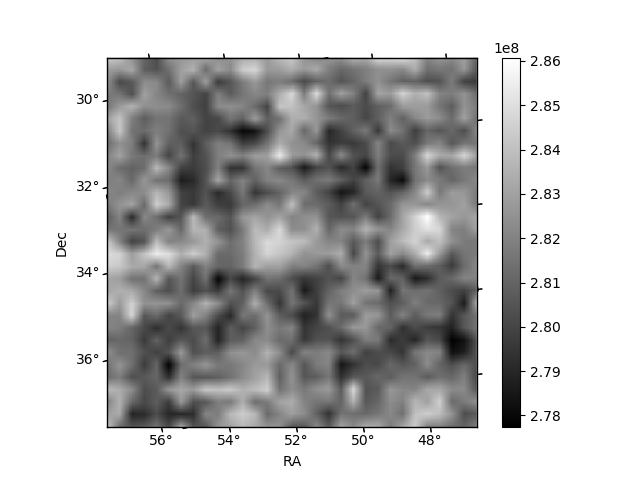
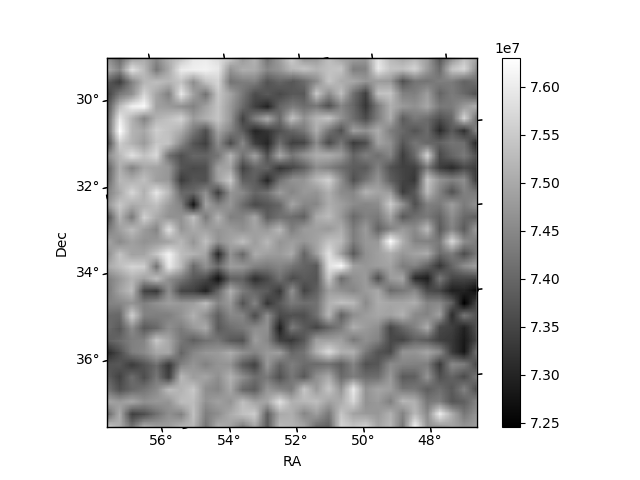
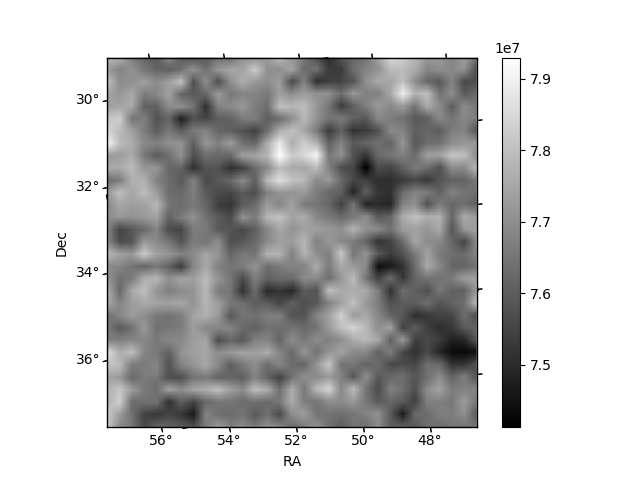
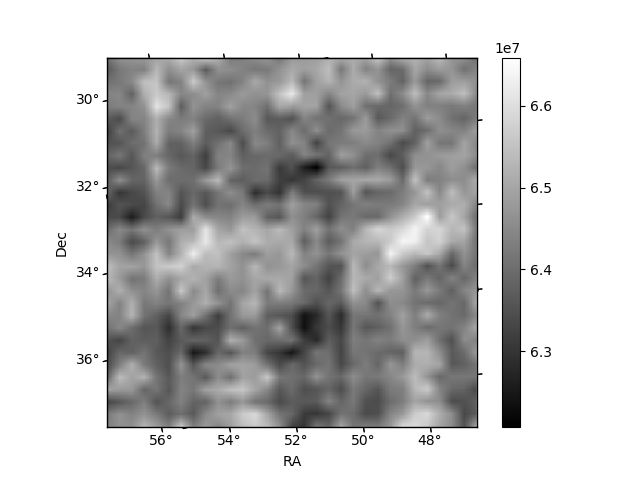
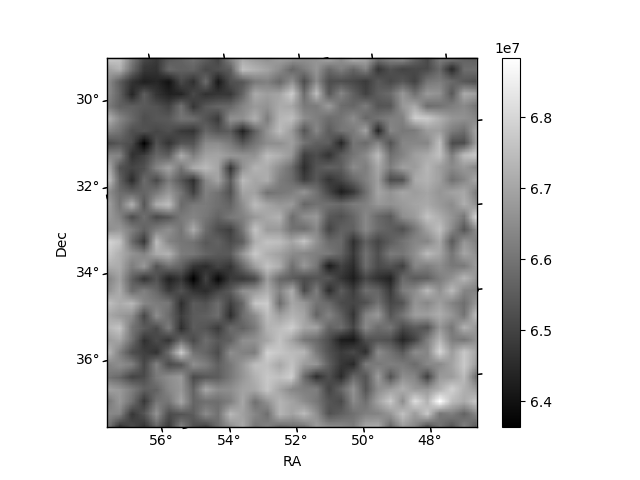
Histogram calculated using DETX and DETY for each event in the final _common_clean file
| Quadrant A | 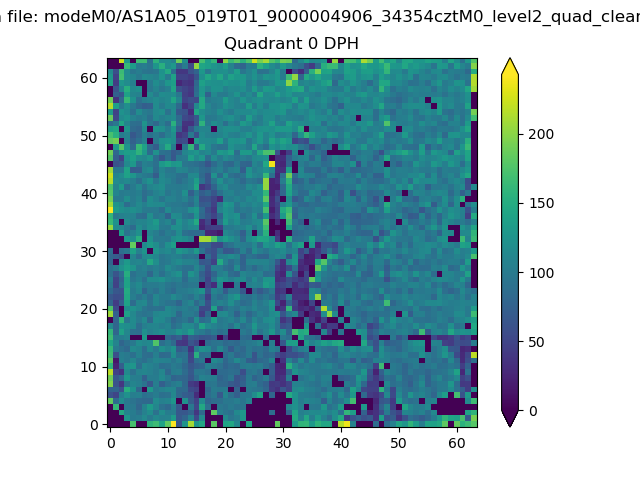 |
 |
Quadrant B |
|---|---|---|---|
| Quadrant D | 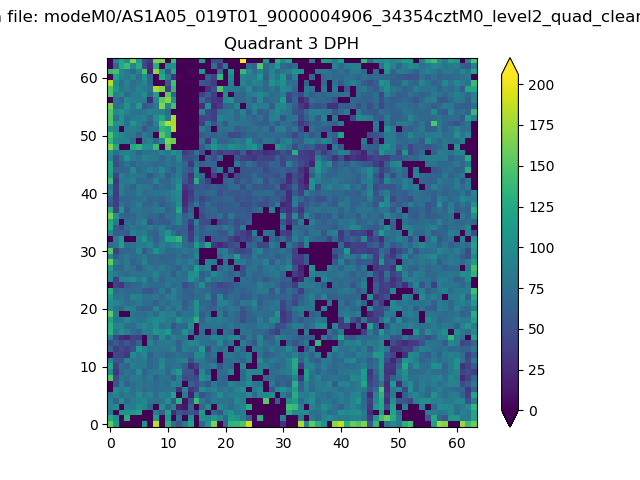 |
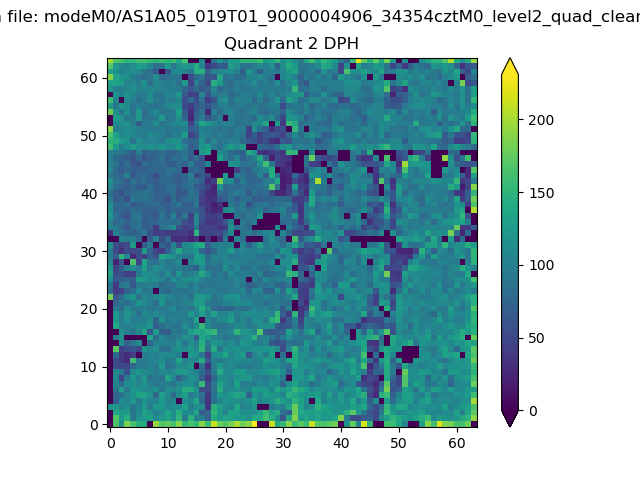 |
Quadrant C |
| Plot type | Count rate plots | Images |
|---|---|---|
| Comparison with Poisson distribution Blue bars denote a histogram of data divided into 1 sec bins. Red curve is a Poisson curve with rate = median count rate of data. |
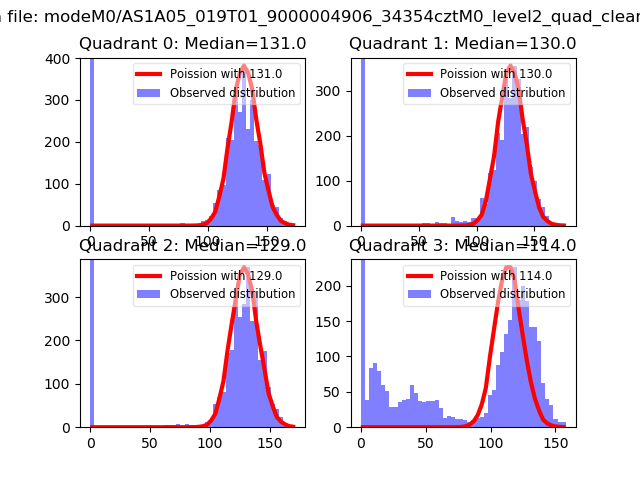 |
 |
| Quadrant-wise count rates Data is divided into 100 sec bins |
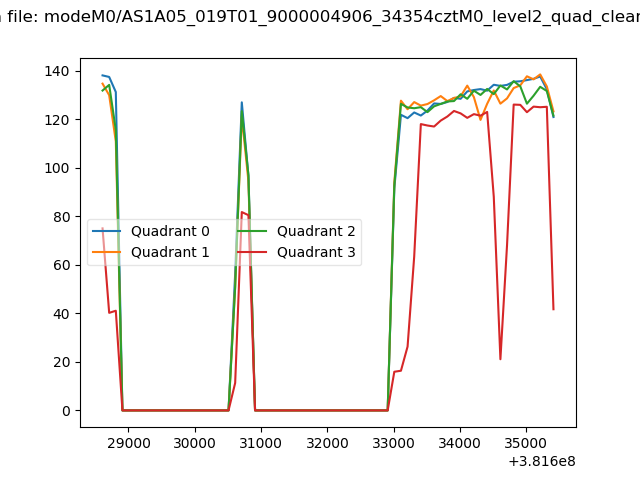 |
|
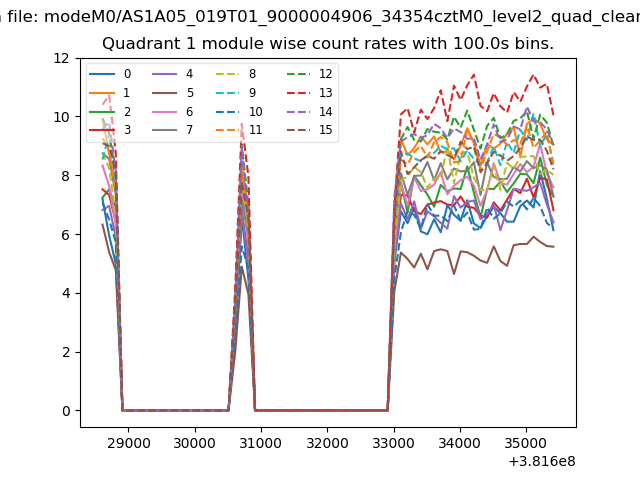
| Module-wise count rates for Quadrant A Data is divided into 100 sec bins |
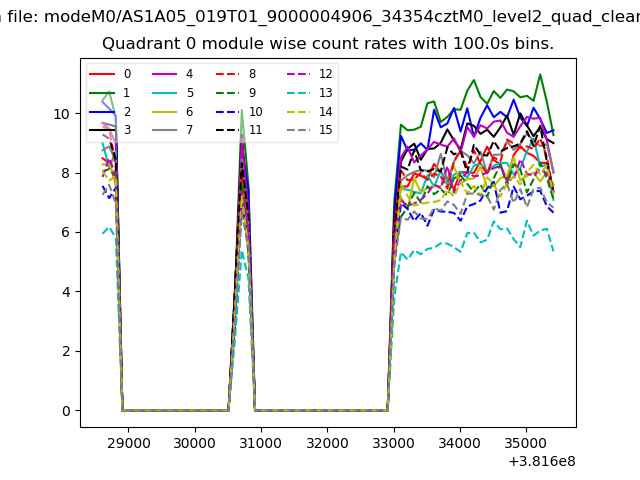 |
 |
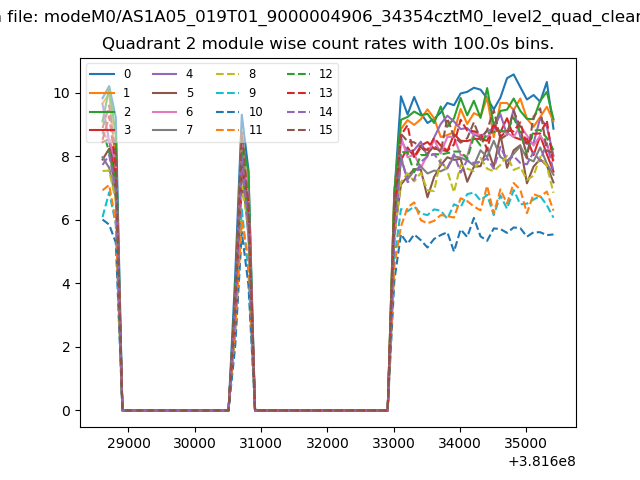
| Module-wise count rates for Quadrant B Data is divided into 100 sec bins |
 |
 |
| Module-wise count rates for Quadrant C Data is divided into 100 sec bins |
 |
 |
| Module-wise count rates for Quadrant D Data is divided into 100 sec bins |
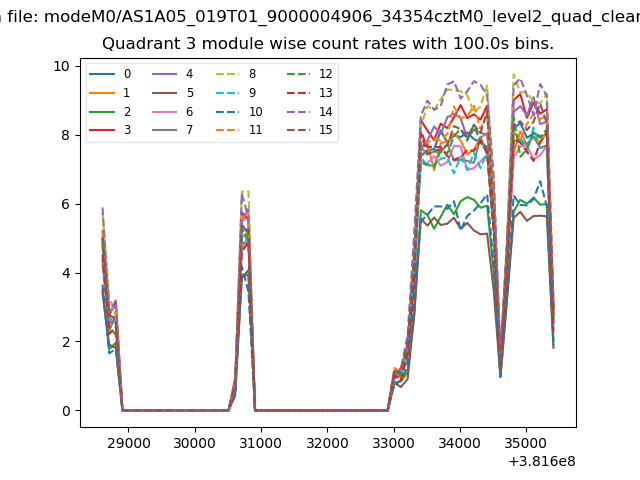 |
 |
| Parameter | Plot |
|---|---|
| CZT HV Monitor | 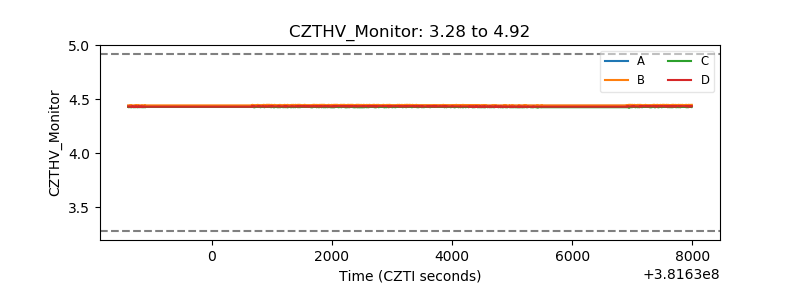 |
| D_VDD | 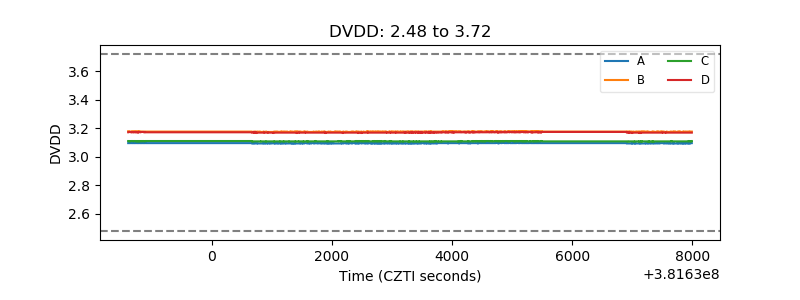 |
| Temperature 1 | 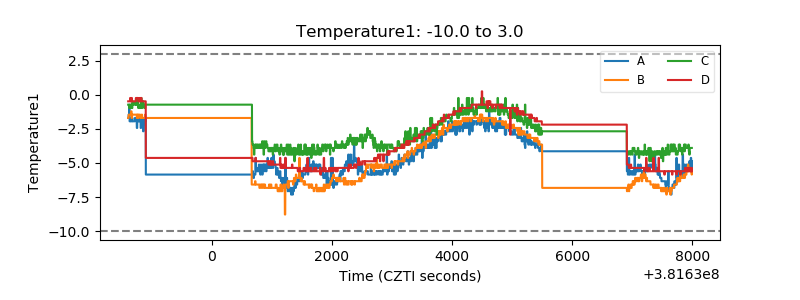 |
| Veto HV Monitor | 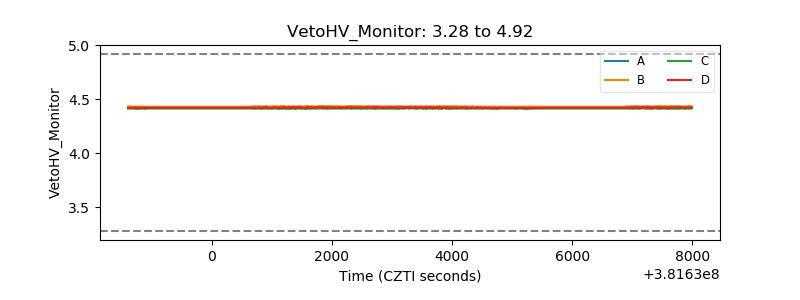 |
| Veto LLD | 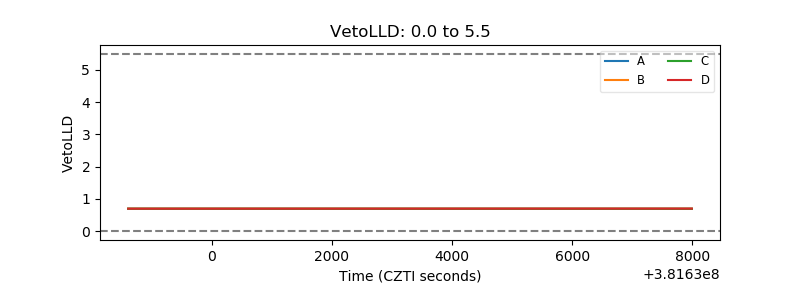 |
| Alpha Counter | 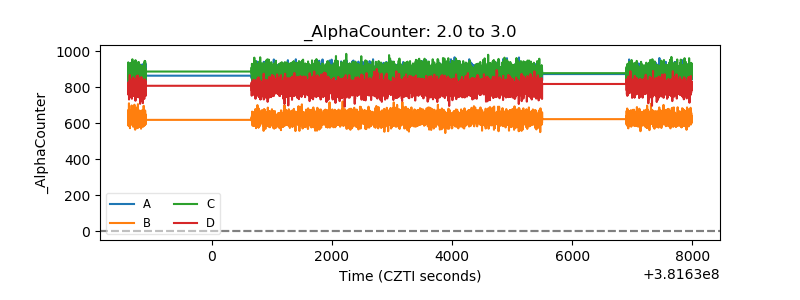 |
| _CPM_Rate | 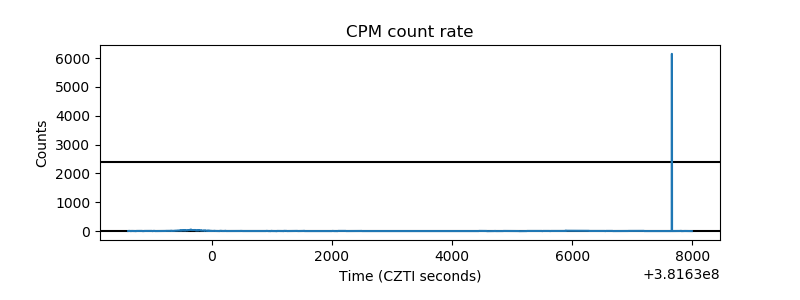 |
| CZT Counter | 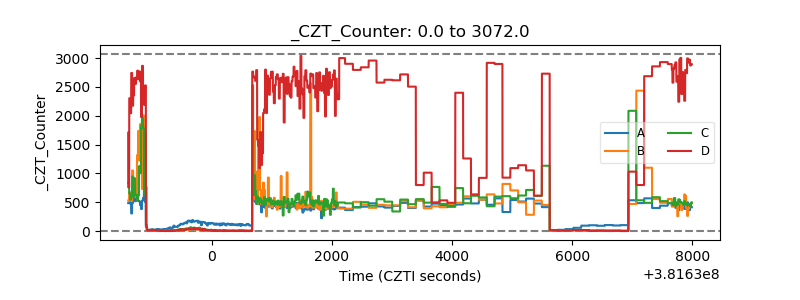 |
| +2.5 Volts monitor | 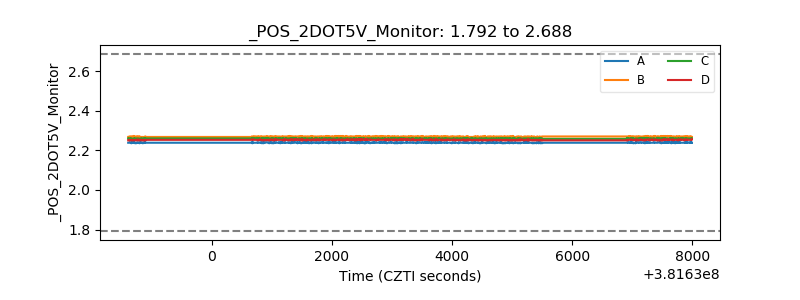 |
| +5 Volts monitor | 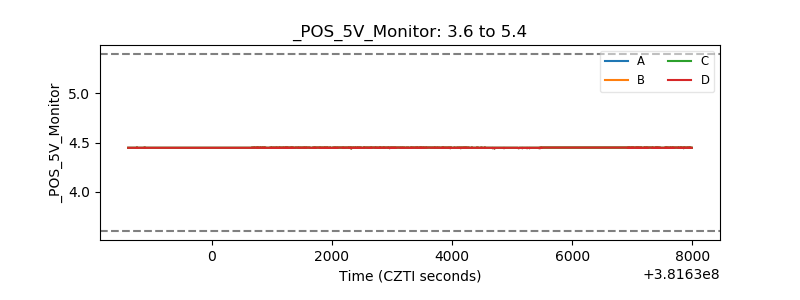 |
| _ROLL_ROT | 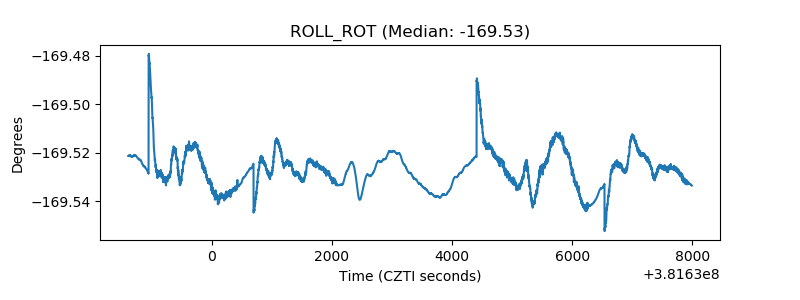 |
| _Roll_DEC |  |
| _Roll_RA | 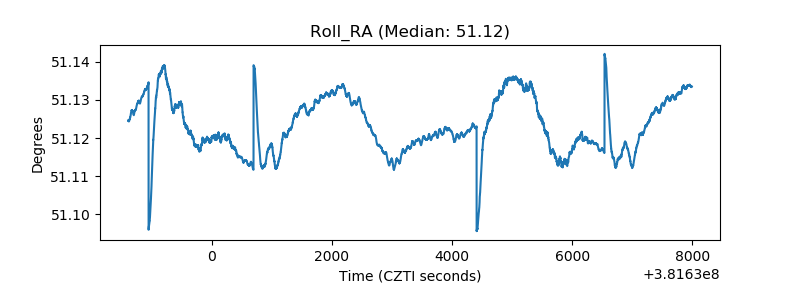 |
| Veto Counter | 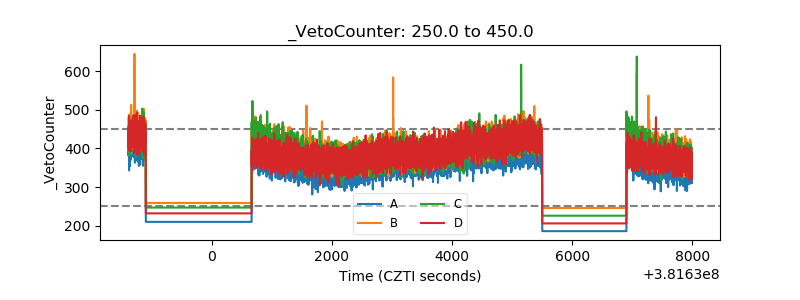 |