| Param | Original file | Final file |
|---|---|---|
| Filename | modeM0/AS1A05_019T01_9000004906_34350cztM0_level2.evt | modeM0/AS1A05_019T01_9000004906_34350cztM0_level2_quad_clean.evt |
| Size (bytes) | 650,422,080 | 60,128,640 |
| Size | 620.3 MB | 57.3 MB |
| Events in quadrant A | 2,414,356 | 415,036 |
| Events in quadrant B | 3,720,209 | 417,436 |
| Events in quadrant C | 2,700,815 | 403,870 |
| Events in quadrant D | 10,532,742 | 241,166 |
| Mode SS | |||
|---|---|---|---|
| Quadrant | BADHDUFLAG | Total packets | Discarded packets |
| A | 0 | 100 | 0 |
| B | 0 | 100 | 0 |
| C | 0 | 100 | 0 |
| D | 0 | 100 | 0 |
| Mode M0 | |||
|---|---|---|---|
| Quadrant | BADHDUFLAG | Total packets | Discarded packets |
| A | 0 | 10084 | 3 |
| B | 0 | 14171 | 2 |
| C | 0 | 10707 | 2 |
| D | 0 | 34629 | 2 |
| Mode M9 | |||
|---|---|---|---|
| Quadrant | BADHDUFLAG | Total packets | Discarded packets |
| A | 0 | 23 | 0 |
| B | 0 | 23 | 0 |
| C | 0 | 23 | 0 |
| D | 0 | 24 | 0 |
| Quadrant | Total seconds | Saturated seconds | Saturation percentage |
|---|---|---|---|
| A | 4873 | 7 | 0.143649% |
| B | 4873 | 364 | 7.469731% |
| C | 4873 | 51 | 1.046583% |
| D | 4873 | 3386 | 69.484917% |
Noise dominated data is calculated using 1-second bins in cleaned event files. If a bin has >2000 counts, and if more than 50% of those come from <1% of pixels, then it is considered to be noise-dominated and hence unusable.
| Quadrant | # 1 sec bins | Bins with >0 counts | Bins with >2000 counts | High rate bins dominated by noise | Noise dominated (total time) | Noise dominated (detector-on time) | Marked lightcurve |
|---|---|---|---|---|---|---|---|
| A | 6996 | 4874 | 0 | 0 | 0.00% | 0.00% | 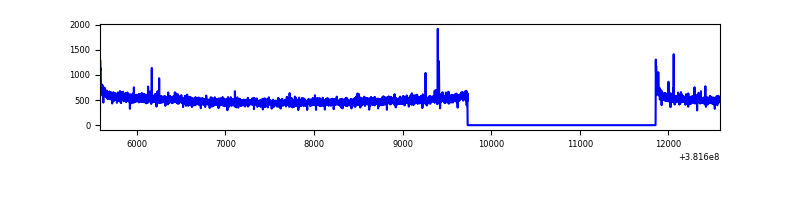 |
| B | 6996 | 4874 | 238 | 238 | 3.40% | 4.88% | 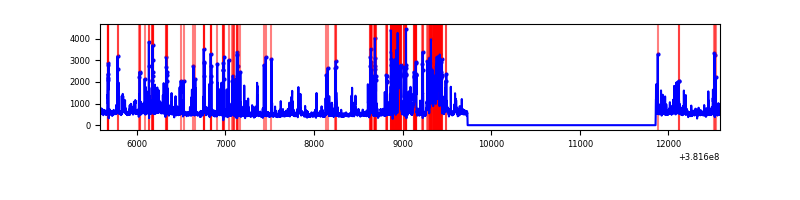 |
| C | 6996 | 4874 | 24 | 24 | 0.34% | 0.49% | 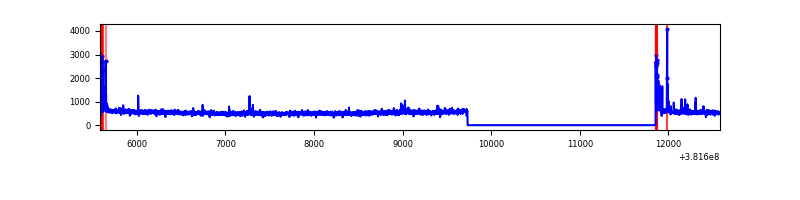 |
| D | 6996 | 4873 | 3221 | 3221 | 46.04% | 66.10% | 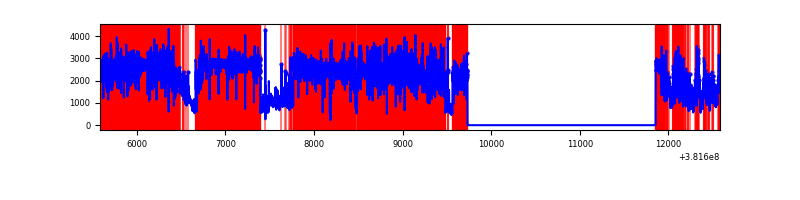 |
Top three noisy pixels from each quadrant. If the there are fewer than three noisy pixels in the level2.evt file, extra rows are filled as -1
| Pixel properties | Quadrant properties | ||||||
|---|---|---|---|---|---|---|---|
| Quadrant | DetID | PixID | Counts | Sigma | Mean | Median | Sigma |
| A | 10 | 83 | 32709 | 265.11 | 608 | 597 | 121.1 |
| A | 13 | 6 | 14970 | 118.66 | 608 | 597 | 121.1 |
| A | 10 | 255 | 10428 | 81.16 | 608 | 597 | 121.1 |
| B | 5 | 172 | 813783 | 7330.51 | 593 | 581 | 110.9 |
| B | 5 | 255 | 316804 | 2850.55 | 593 | 581 | 110.9 |
| B | 0 | 229 | 124249 | 1114.79 | 593 | 581 | 110.9 |
| C | 15 | 214 | 205967 | 1507.99 | 593 | 601 | 136.2 |
| C | 0 | 10 | 112946 | 824.94 | 593 | 601 | 136.2 |
| C | 3 | 233 | 23089 | 165.13 | 593 | 601 | 136.2 |
| D | 7 | 223 | 5792841 | 49592.75 | 426 | 418 | 116.8 |
| D | 12 | 235 | 910809 | 7794.46 | 426 | 418 | 116.8 |
| D | 8 | 195 | 841576 | 7201.71 | 426 | 418 | 116.8 |
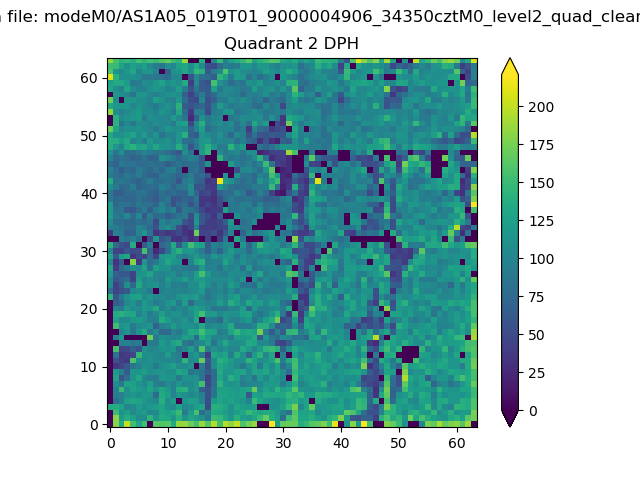
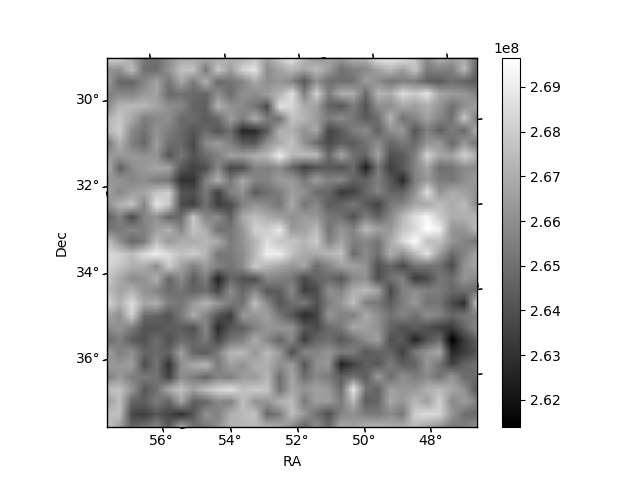
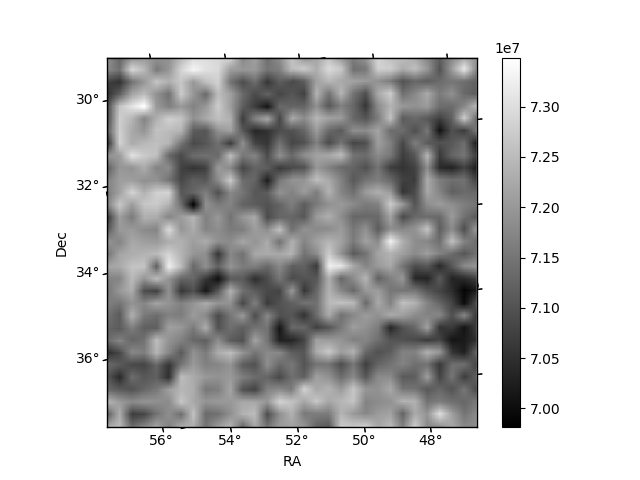
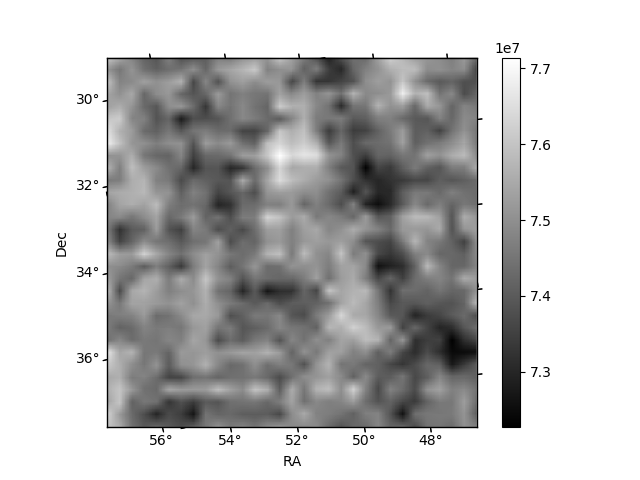
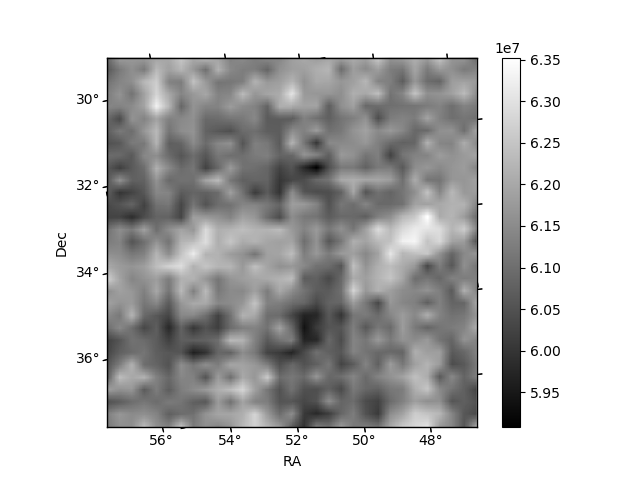
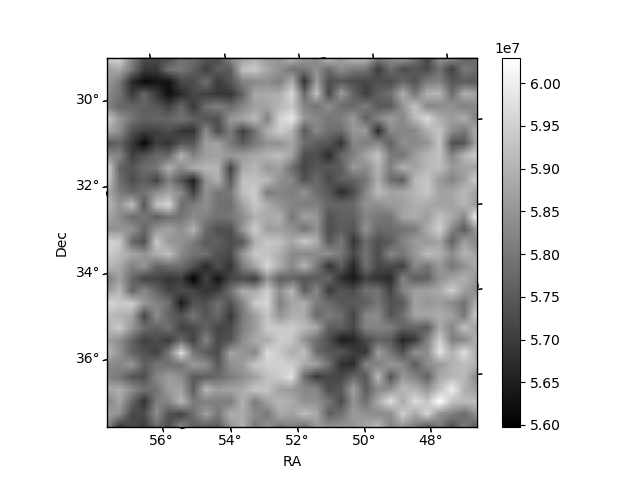
Histogram calculated using DETX and DETY for each event in the final _common_clean file
| Quadrant A | 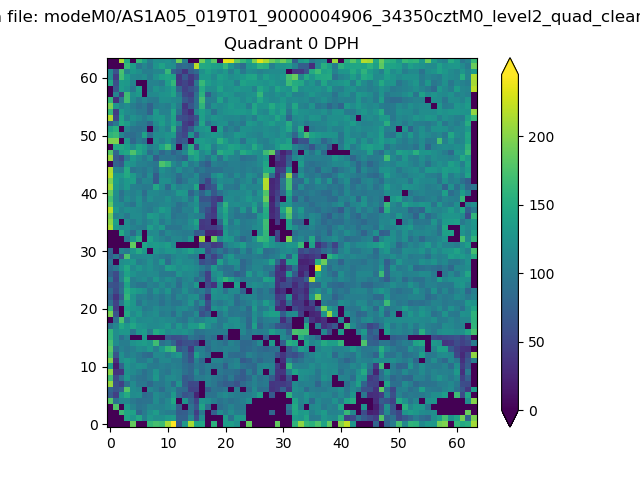 |
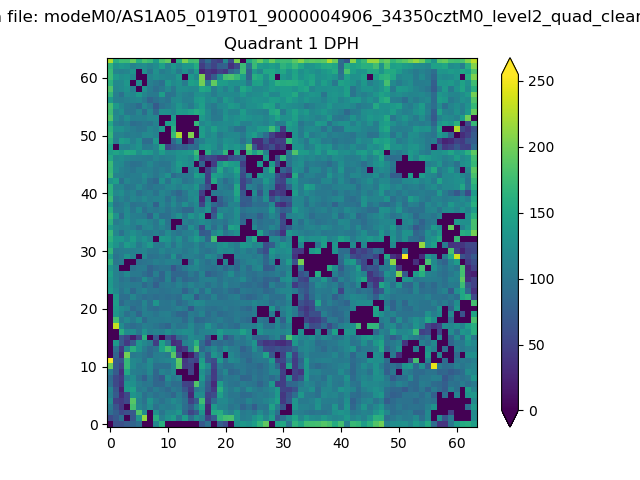 |
Quadrant B |
|---|---|---|---|
| Quadrant D | 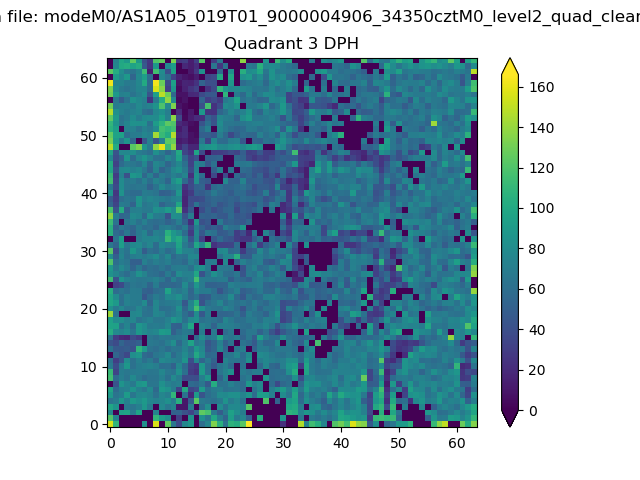 |
 |
Quadrant C |
| Plot type | Count rate plots | Images |
|---|---|---|
| Comparison with Poisson distribution Blue bars denote a histogram of data divided into 1 sec bins. Red curve is a Poisson curve with rate = median count rate of data. |
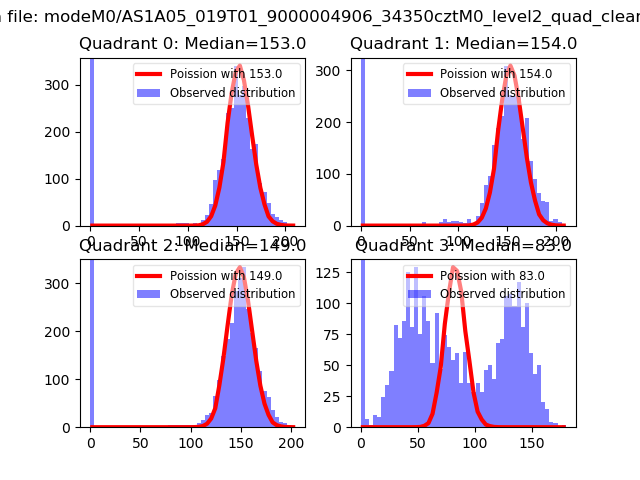 |
 |
| Quadrant-wise count rates Data is divided into 100 sec bins |
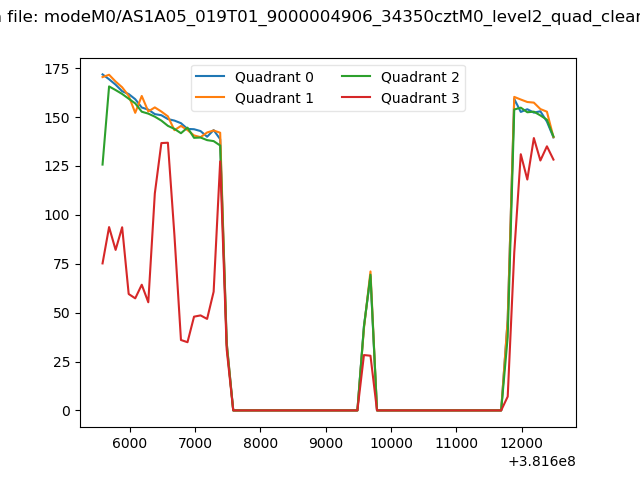 |
|
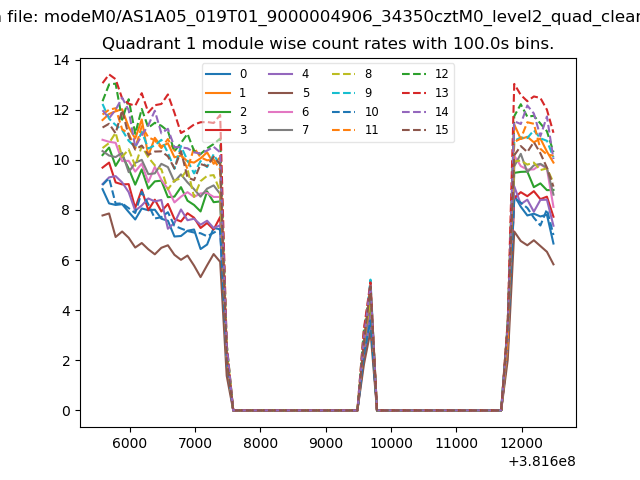
| Module-wise count rates for Quadrant A Data is divided into 100 sec bins |
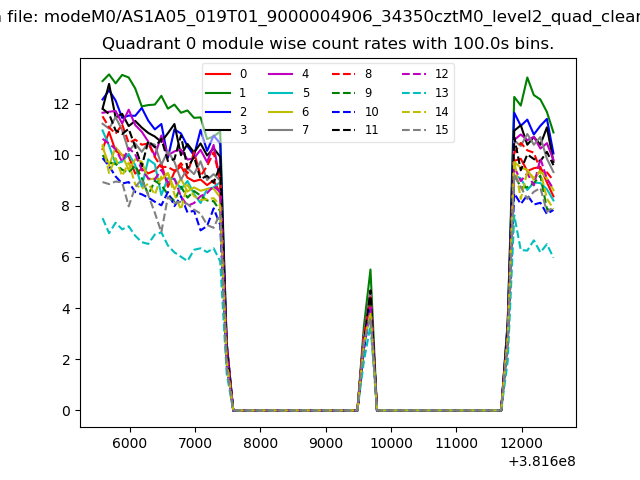 |
 |
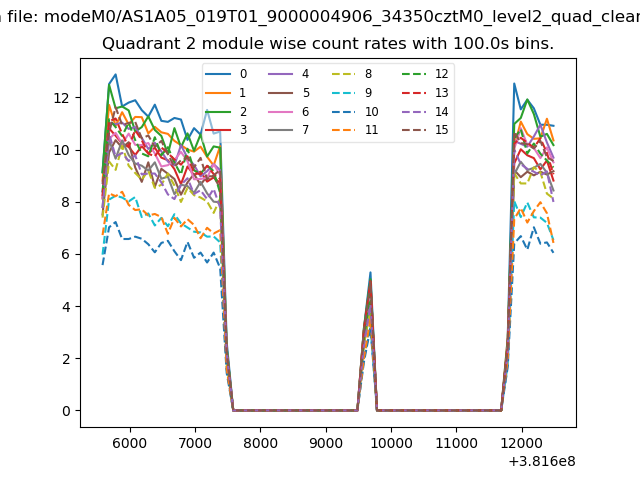
| Module-wise count rates for Quadrant B Data is divided into 100 sec bins |
 |
 |
| Module-wise count rates for Quadrant C Data is divided into 100 sec bins |
 |
 |
| Module-wise count rates for Quadrant D Data is divided into 100 sec bins |
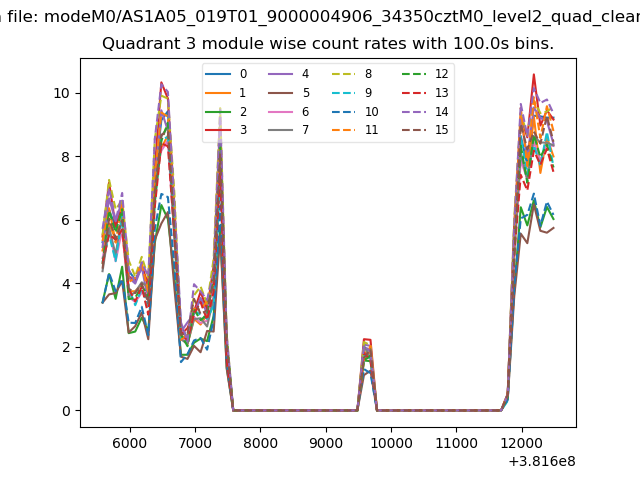 |
 |
| Parameter | Plot |
|---|---|
| CZT HV Monitor |  |
| D_VDD | 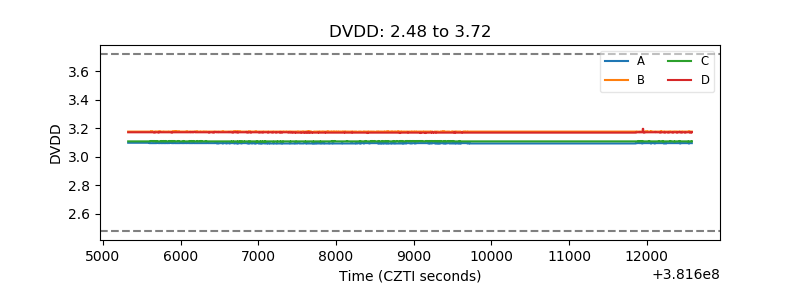 |
| Temperature 1 | 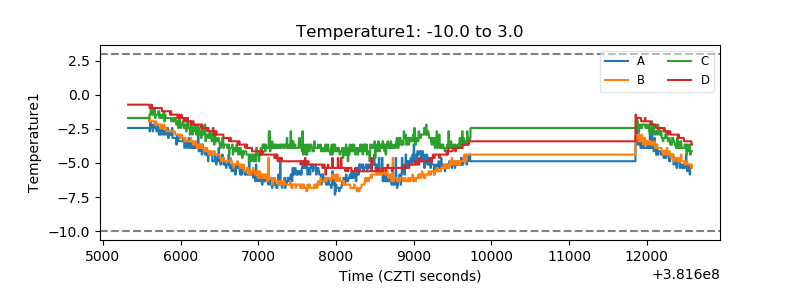 |
| Veto HV Monitor | 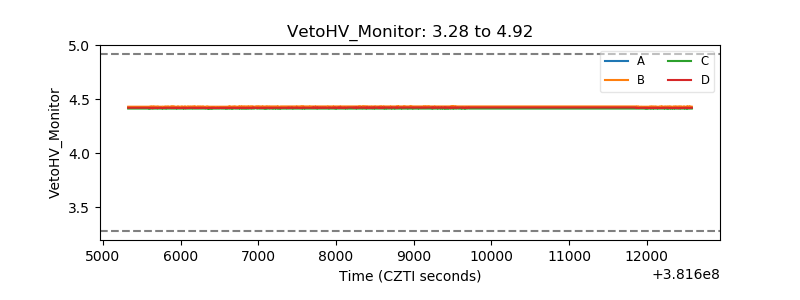 |
| Veto LLD | 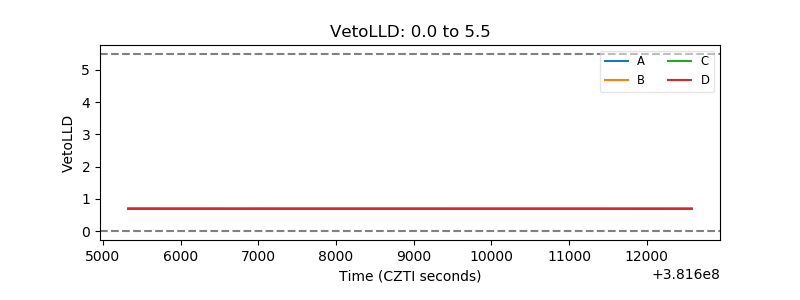 |
| Alpha Counter | 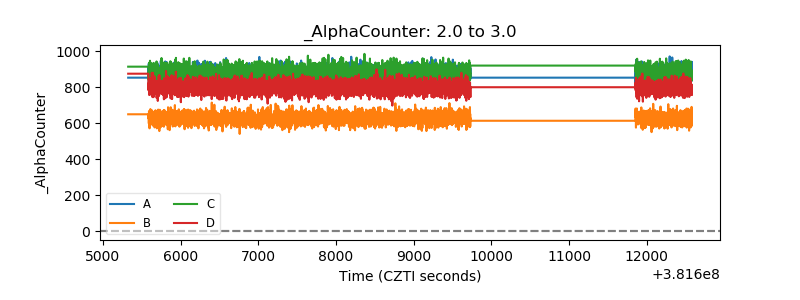 |
| _CPM_Rate | 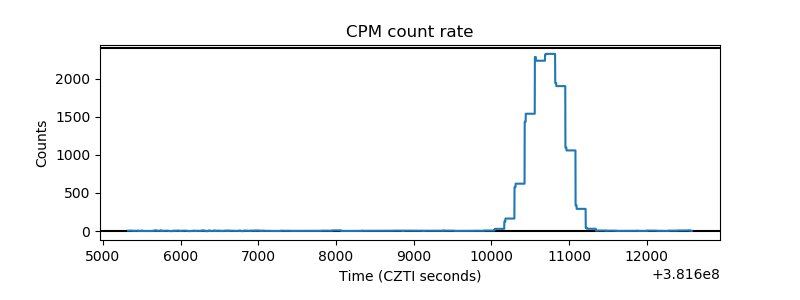 |
| CZT Counter | 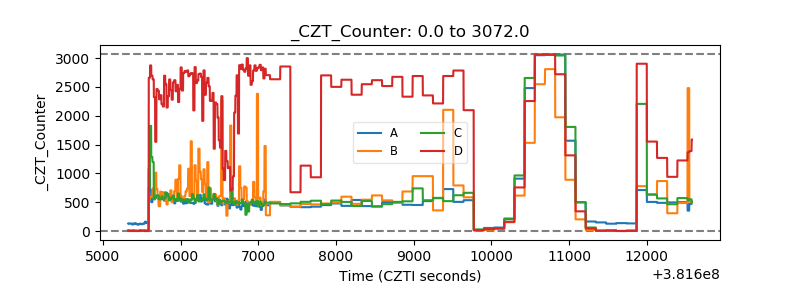 |
| +2.5 Volts monitor | 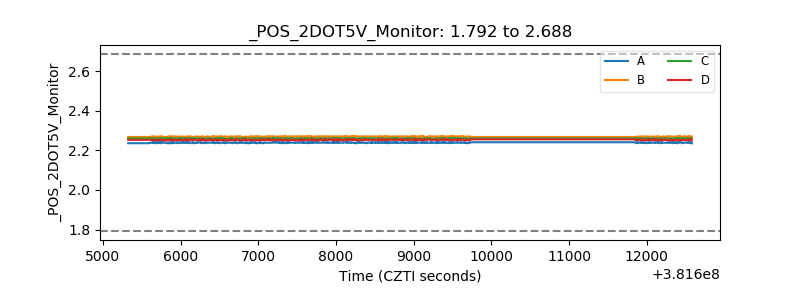 |
| +5 Volts monitor | 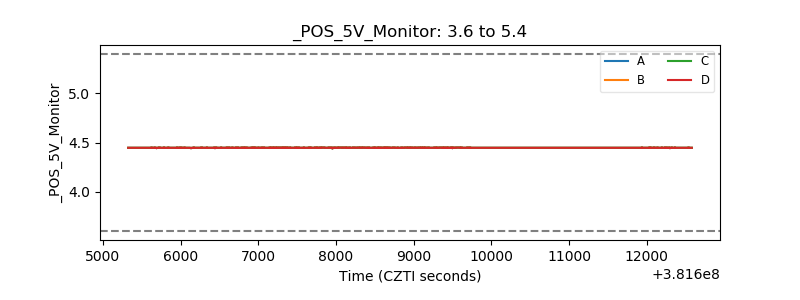 |
| _ROLL_ROT | 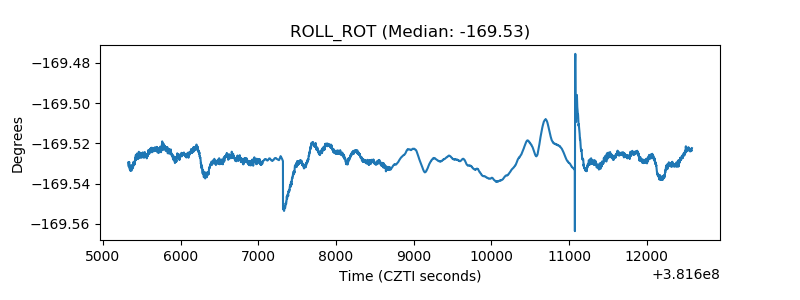 |
| _Roll_DEC | 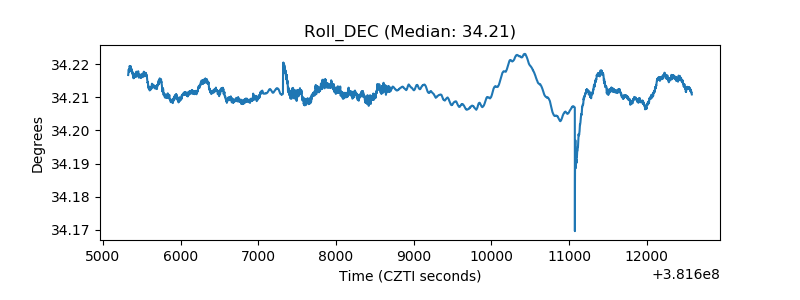 |
| _Roll_RA | 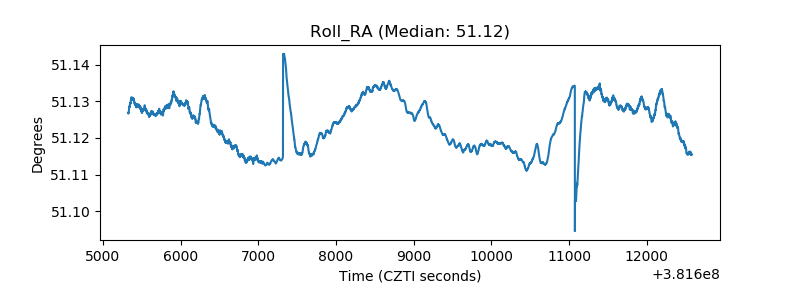 |
| Veto Counter | 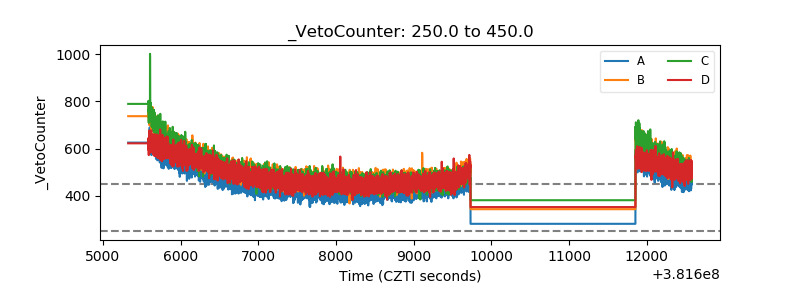 |