| Param | Original file | Final file |
|---|---|---|
| Filename | modeM0/AS1A05_019T01_9000004906cztM0_level2_bc.evt | modeM0/AS1A05_019T01_9000004906cztM0_level2_quad_clean.evt |
| Size (bytes) | 8,695,549,440 | 1,120,510,080 |
| Size | 8.1 GB | 1.0 GB |
| Events in quadrant A | 20,557,386 | 7,701,089 |
| Events in quadrant B | 34,238,660 | 7,603,443 |
| Events in quadrant C | 43,753,619 | 7,245,146 |
| Events in quadrant D | 158,247,490 | 4,742,939 |
| Mode SS | |||
|---|---|---|---|
| Quadrant | BADHDUFLAG | Total packets | Discarded packets |
| A | 0 | 1978 | 0 |
| B | 0 | 1978 | 0 |
| C | 0 | 1978 | 0 |
| D | 0 | 1978 | 0 |
| Mode M0 | |||
|---|---|---|---|
| Quadrant | BADHDUFLAG | Total packets | Discarded packets |
| A | 0 | 196884 | 0 |
| B | 0 | 250980 | 0 |
| C | 0 | 274899 | 0 |
| D | 0 | 623507 | 0 |
| Mode M9 | |||
|---|---|---|---|
| Quadrant | BADHDUFLAG | Total packets | Discarded packets |
| A | 0 | 372 | 0 |
| B | 0 | 372 | 0 |
| C | 0 | 372 | 0 |
| D | 0 | 372 | 0 |
| Quadrant | Total seconds | Saturated seconds | Saturation percentage |
|---|---|---|---|
| A | 96715 | 147 | 0.151993% |
| B | 96715 | 3756 | 3.883575% |
| C | 96715 | 6105 | 6.312361% |
| D | 96715 | 55279 | 57.156594% |
Noise dominated data is calculated using 1-second bins in cleaned event files. If a bin has >2000 counts, and if more than 50% of those come from <1% of pixels, then it is considered to be noise-dominated and hence unusable.
| Quadrant | # 1 sec bins | Bins with >0 counts | Bins with >2000 counts | High rate bins dominated by noise | Noise dominated (total time) | Noise dominated (detector-on time) | Marked lightcurve |
|---|---|---|---|---|---|---|---|
| A | 133916 | 96726 | 6 | 6 | 0.00% | 0.01% | 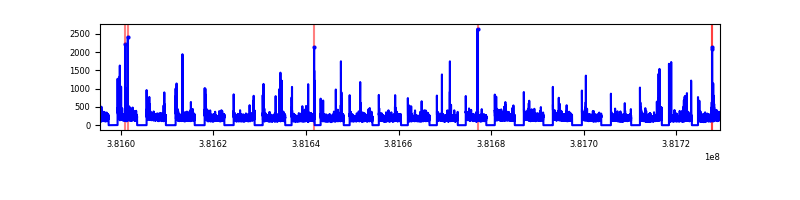 |
| B | 133916 | 96716 | 451 | 451 | 0.34% | 0.47% | 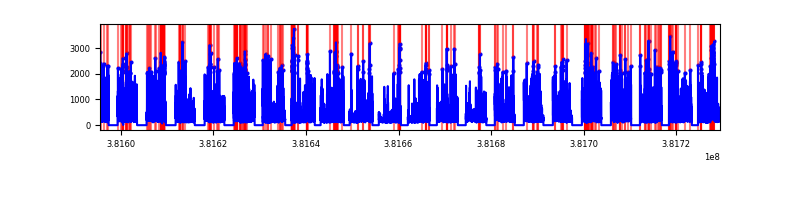 |
| C | 133916 | 96707 | 1991 | 1991 | 1.49% | 2.06% | 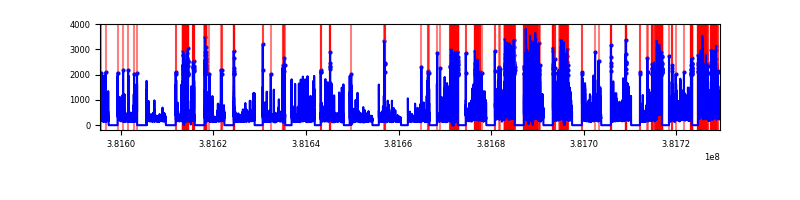 |
| D | 133916 | 96707 | 43781 | 43781 | 32.69% | 45.27% | 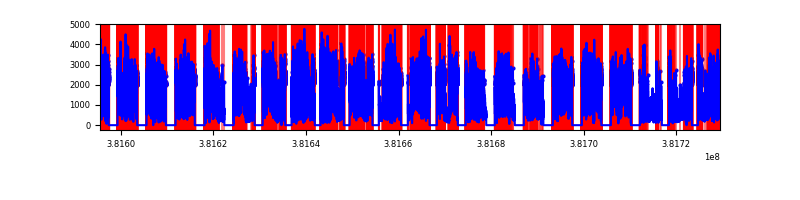 |
Top three noisy pixels from each quadrant. If the there are fewer than three noisy pixels in the level2.evt file, extra rows are filled as -1
| Pixel properties | Quadrant properties | ||||||
|---|---|---|---|---|---|---|---|
| Quadrant | DetID | PixID | Counts | Sigma | Mean | Median | Sigma |
| A | 10 | 83 | 363314 | 319.44 | 5097 | 5011 | 1121.6 |
| A | 9 | 143 | 253924 | 221.92 | 5097 | 5011 | 1121.6 |
| A | 13 | 6 | 208431 | 181.36 | 5097 | 5011 | 1121.6 |
| B | 5 | 172 | 7319817 | 7288.93 | 5056 | 4942 | 1003.6 |
| B | 5 | 31 | 1571302 | 1560.81 | 5056 | 4942 | 1003.6 |
| B | 4 | 171 | 1290166 | 1280.67 | 5056 | 4942 | 1003.6 |
| C | 4 | 254 | 15900647 | 14344.52 | 4836 | 4809 | 1108.1 |
| C | 15 | 214 | 3720407 | 3352.98 | 4836 | 4809 | 1108.1 |
| C | 14 | 254 | 2018499 | 1817.17 | 4836 | 4809 | 1108.1 |
| D | 7 | 223 | 110435804 | 116627.11 | 3619 | 3524 | 946.9 |
| D | 8 | 195 | 13380659 | 14127.54 | 3619 | 3524 | 946.9 |
| D | 12 | 235 | 7742340 | 8172.93 | 3619 | 3524 | 946.9 |
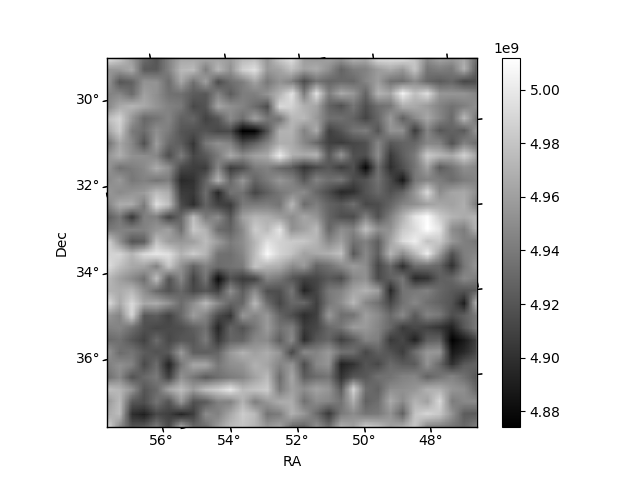
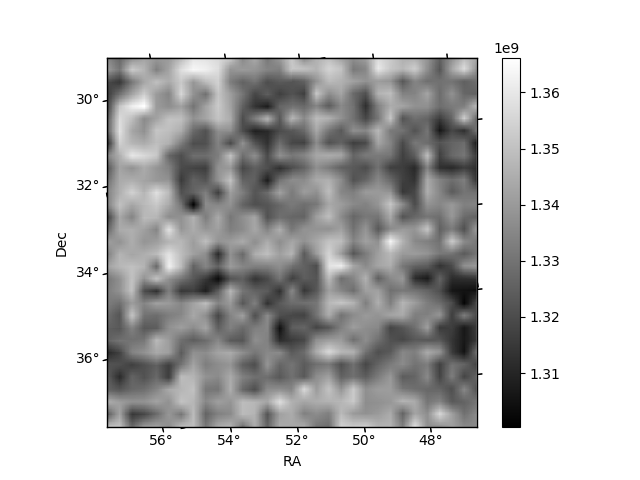
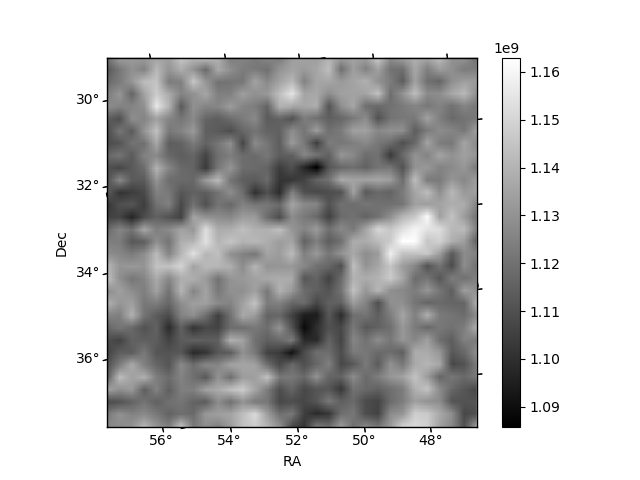
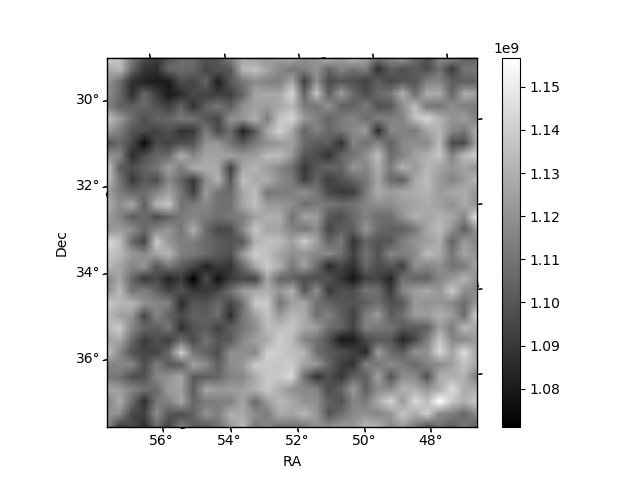
Histogram calculated using DETX and DETY for each event in the final _common_clean file
| Quadrant A | 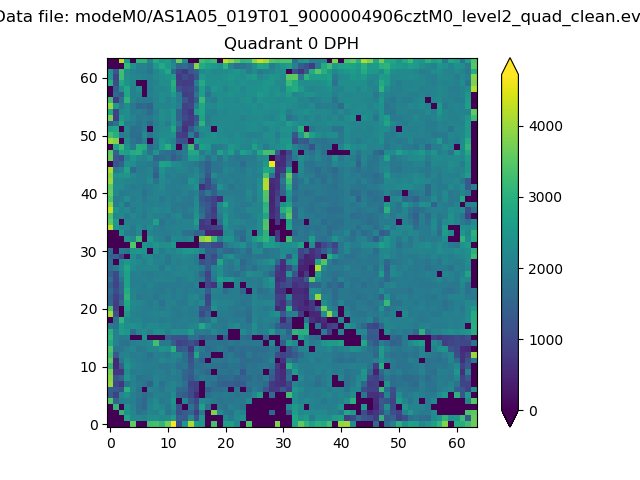 |
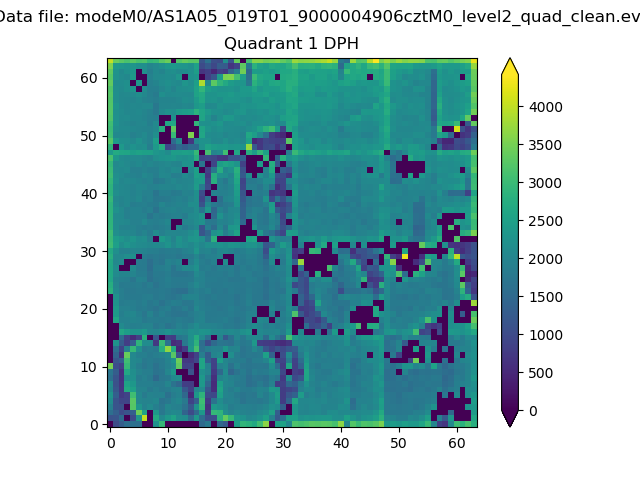 |
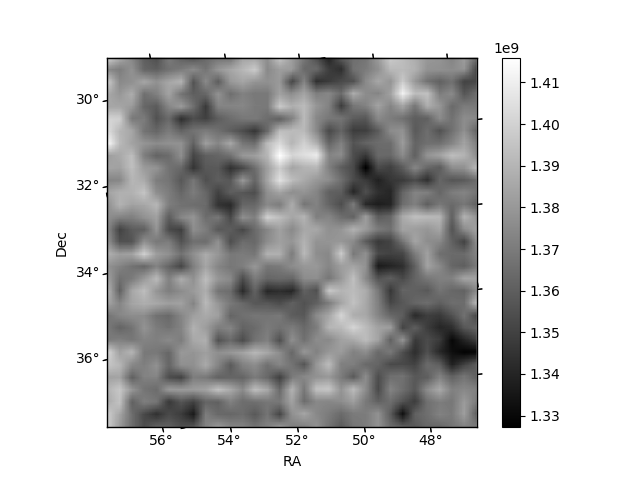
Quadrant B |
|---|---|---|---|
| Quadrant D | 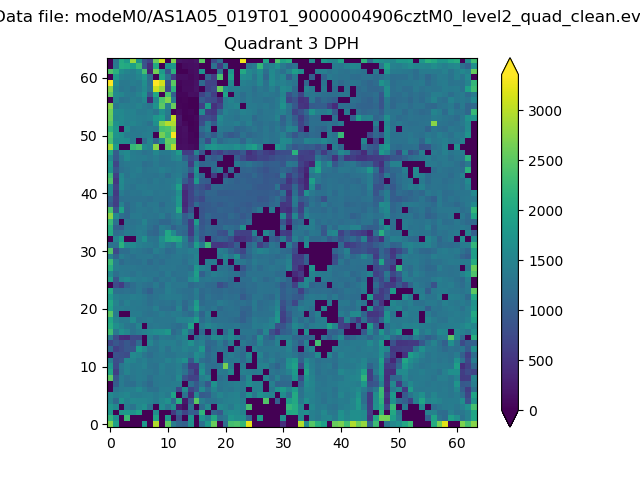 |
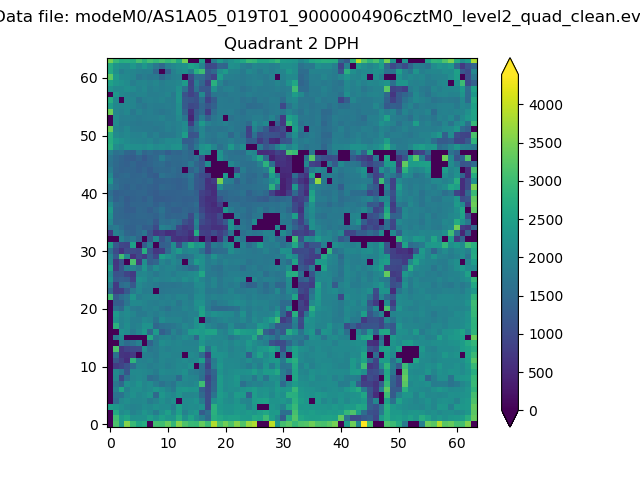 |
Quadrant C |
| Plot type | Count rate plots | Images |
|---|---|---|
| Comparison with Poisson distribution Blue bars denote a histogram of data divided into 1 sec bins. Red curve is a Poisson curve with rate = median count rate of data. |
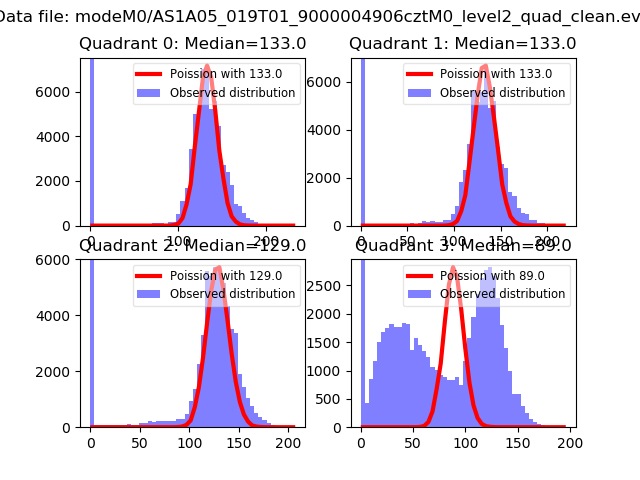 |
 |
| Quadrant-wise count rates Data is divided into 100 sec bins |
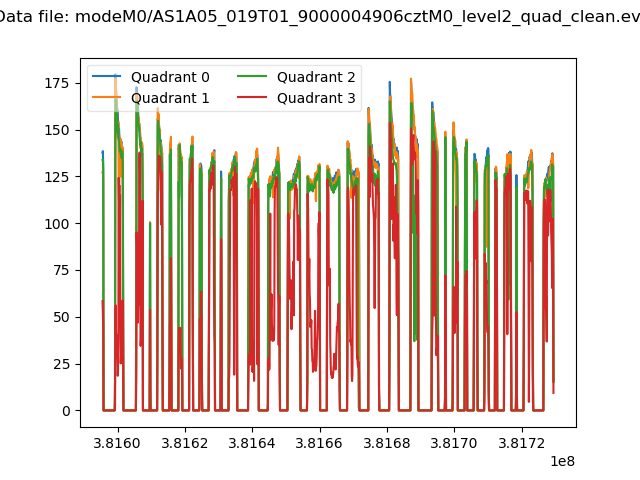 |
|
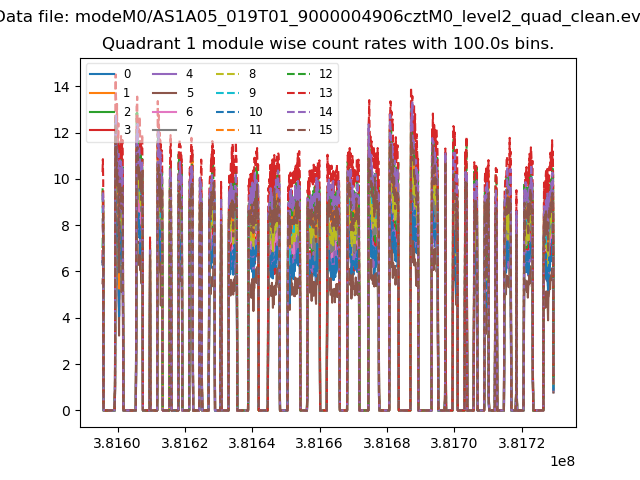
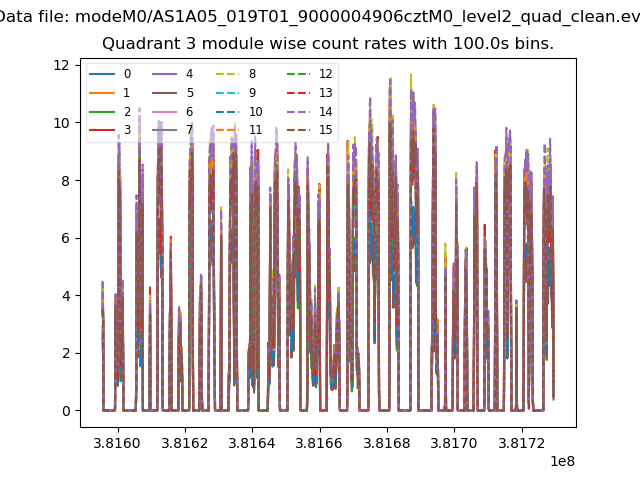
| Module-wise count rates for Quadrant A Data is divided into 100 sec bins |
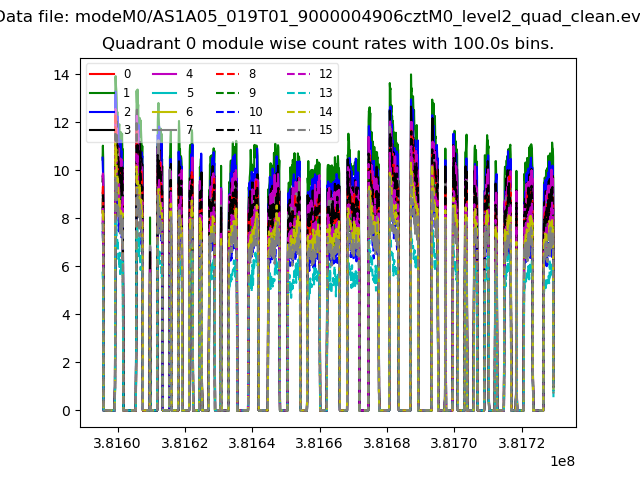 |
 |
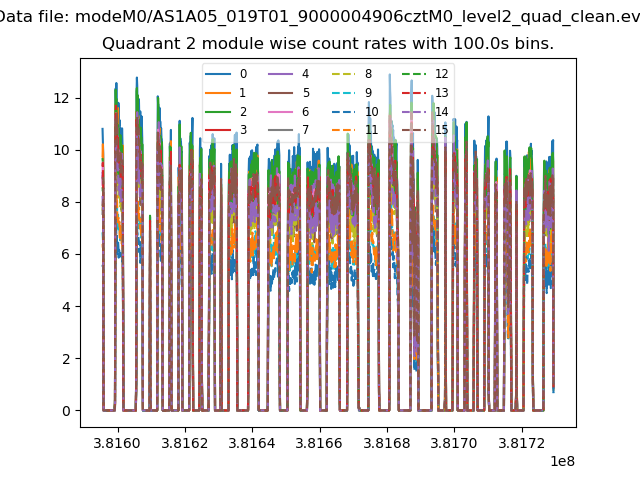
| Module-wise count rates for Quadrant B Data is divided into 100 sec bins |
 |
 |
| Module-wise count rates for Quadrant C Data is divided into 100 sec bins |
 |
 |
| Module-wise count rates for Quadrant D Data is divided into 100 sec bins |
 |
 |
| Parameter | Plot |
|---|---|
| CZT HV Monitor | 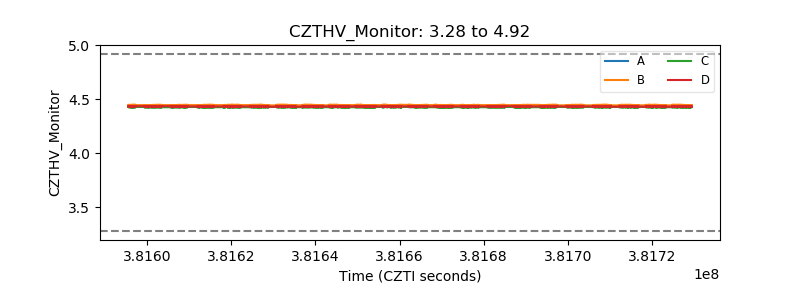 |
| D_VDD | 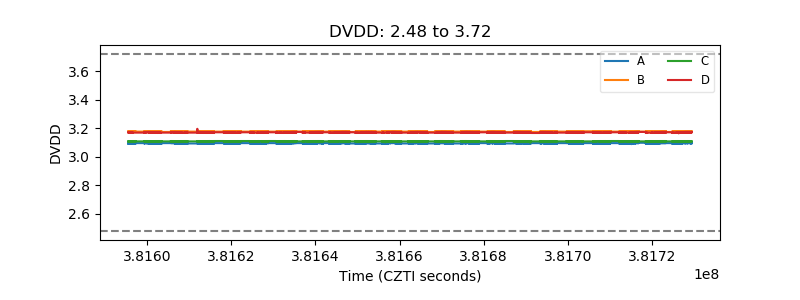 |
| Temperature 1 | 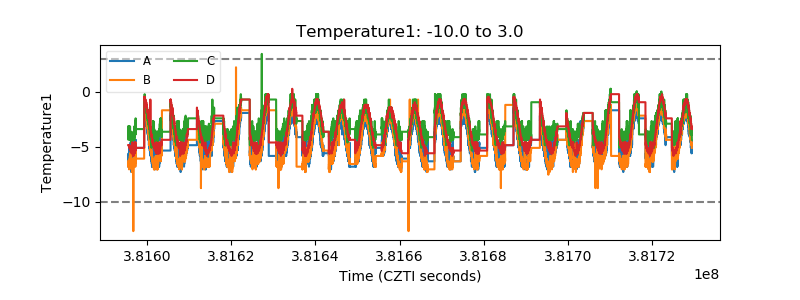 |
| Veto HV Monitor | 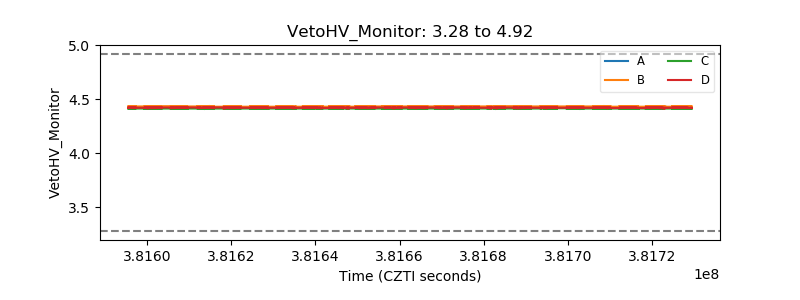 |
| Veto LLD | 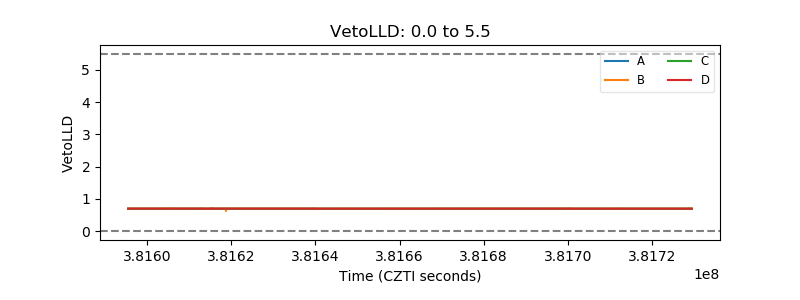 |
| Alpha Counter | 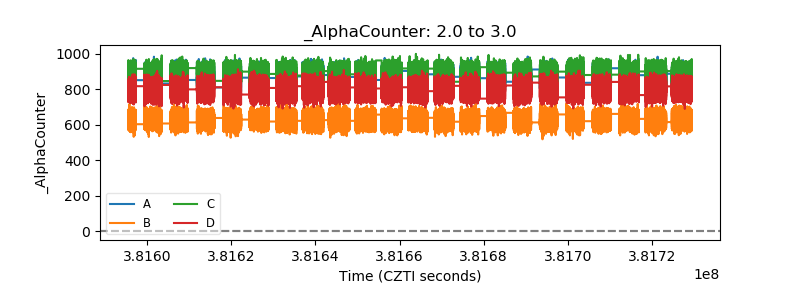 |
| _CPM_Rate | 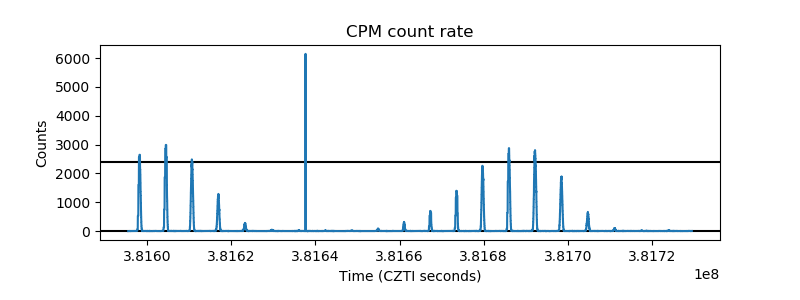 |
| CZT Counter | 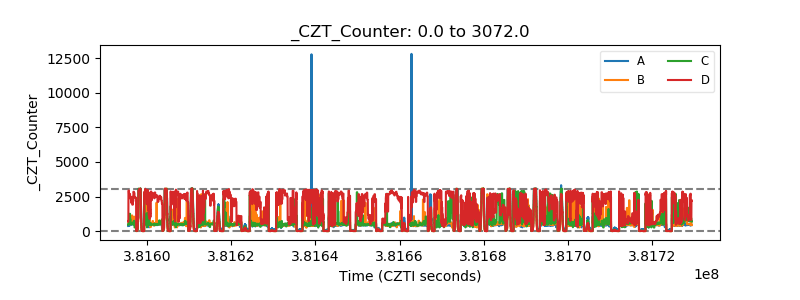 |
| +2.5 Volts monitor | 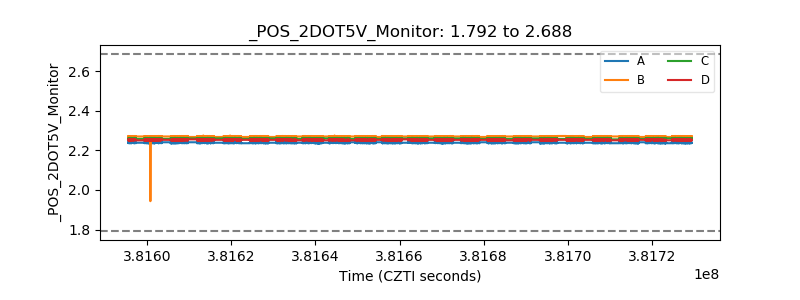 |
| +5 Volts monitor | 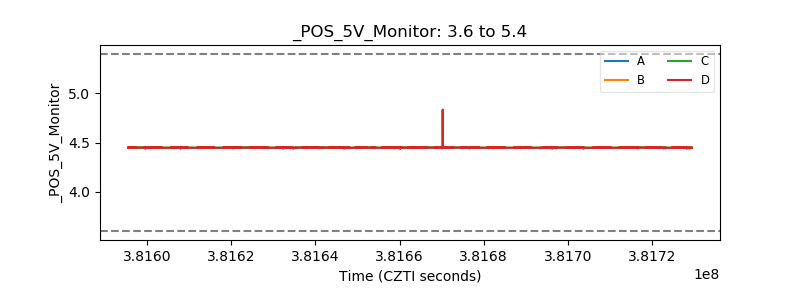 |
| _ROLL_ROT | 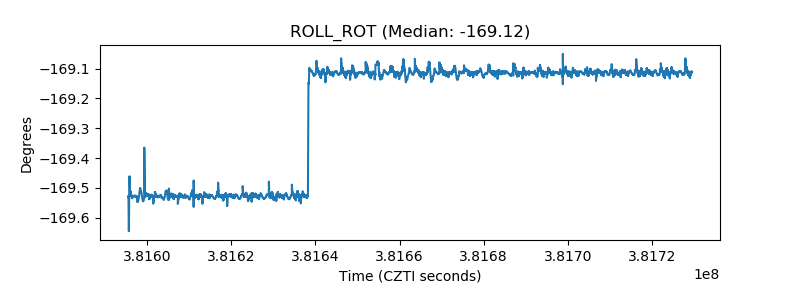 |
| _Roll_DEC | 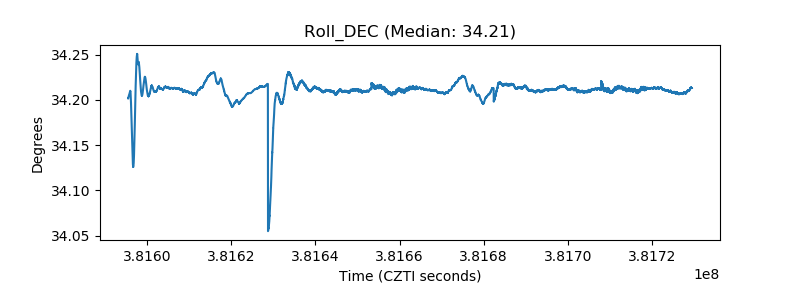 |
| _Roll_RA | 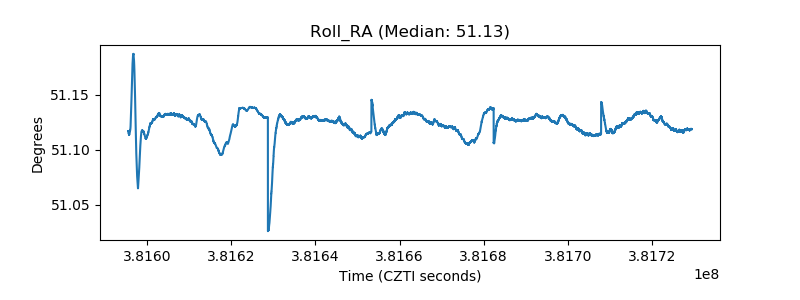 |
| Veto Counter | 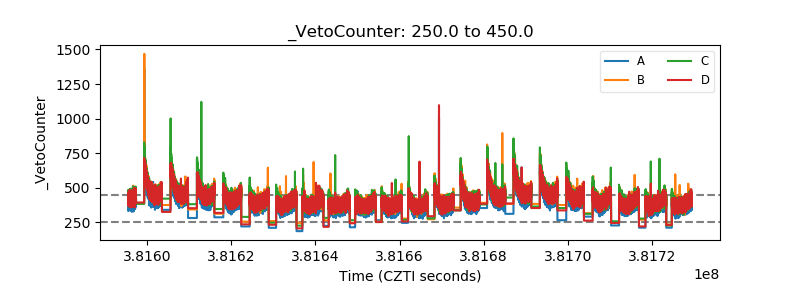 |