| Param | Original file | Final file |
|---|---|---|
| Filename | modeM0/AS1C07_001T05_9000004902_34345cztM0_level2.evt | modeM0/AS1C07_001T05_9000004902_34345cztM0_level2_quad_clean.evt |
| Size (bytes) | 279,803,520 | 55,647,360 |
| Size | 266.8 MB | 53.1 MB |
| Events in quadrant A | 1,543,692 | 369,900 |
| Events in quadrant B | 1,924,597 | 370,847 |
| Events in quadrant C | 1,715,364 | 362,531 |
| Events in quadrant D | 3,058,329 | 340,636 |
| Mode SS | |||
|---|---|---|---|
| Quadrant | BADHDUFLAG | Total packets | Discarded packets |
| A | 0 | 68 | 0 |
| B | 0 | 68 | 0 |
| C | 0 | 68 | 0 |
| D | 0 | 68 | 0 |
| Mode M9 | |||
|---|---|---|---|
| Quadrant | BADHDUFLAG | Total packets | Discarded packets |
| A | 0 | 3 | 0 |
| B | 0 | 3 | 0 |
| C | 0 | 3 | 0 |
| D | 0 | 4 | 0 |
| Mode M0 | |||
|---|---|---|---|
| Quadrant | BADHDUFLAG | Total packets | Discarded packets |
| A | 0 | 6905 | 1 |
| B | 0 | 7922 | 1 |
| C | 0 | 7111 | 1 |
| D | 0 | 11581 | 1 |
| Quadrant | Total seconds | Saturated seconds | Saturation percentage |
|---|---|---|---|
| A | 3397 | 5 | 0.147189% |
| B | 3397 | 54 | 1.589638% |
| C | 3397 | 24 | 0.706506% |
| D | 3397 | 63 | 1.854578% |
Noise dominated data is calculated using 1-second bins in cleaned event files. If a bin has >2000 counts, and if more than 50% of those come from <1% of pixels, then it is considered to be noise-dominated and hence unusable.
| Quadrant | # 1 sec bins | Bins with >0 counts | Bins with >2000 counts | High rate bins dominated by noise | Noise dominated (total time) | Noise dominated (detector-on time) | Marked lightcurve |
|---|---|---|---|---|---|---|---|
| A | 3397 | 3397 | 0 | 0 | 0.00% | 0.00% | 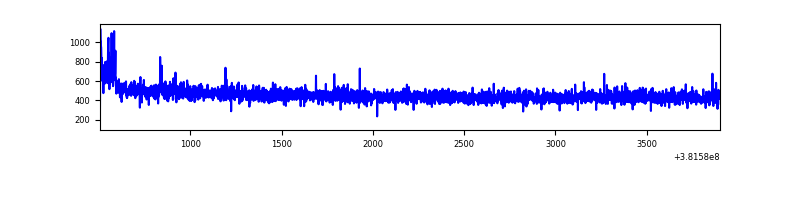 |
| B | 3397 | 3397 | 33 | 33 | 0.97% | 0.97% | 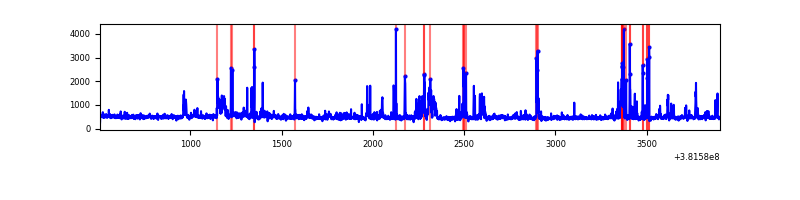 |
| C | 3397 | 3397 | 16 | 16 | 0.47% | 0.47% | 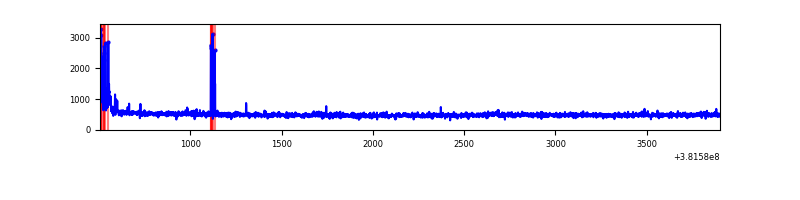 |
| D | 3397 | 3397 | 54 | 54 | 1.59% | 1.59% | 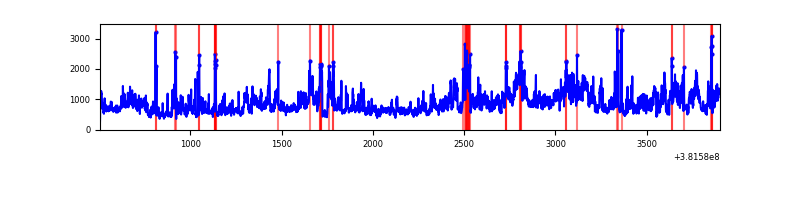 |
Top three noisy pixels from each quadrant. If the there are fewer than three noisy pixels in the level2.evt file, extra rows are filled as -1
| Pixel properties | Quadrant properties | ||||||
|---|---|---|---|---|---|---|---|
| Quadrant | DetID | PixID | Counts | Sigma | Mean | Median | Sigma |
| A | 10 | 83 | 16226 | 200.13 | 389 | 380 | 79.2 |
| A | 9 | 143 | 13272 | 162.82 | 389 | 380 | 79.2 |
| A | 13 | 6 | 10611 | 129.21 | 389 | 380 | 79.2 |
| B | 5 | 172 | 315125 | 4221.14 | 382 | 372 | 74.6 |
| B | 4 | 251 | 39491 | 524.62 | 382 | 372 | 74.6 |
| B | 5 | 255 | 21431 | 282.42 | 382 | 372 | 74.6 |
| C | 15 | 214 | 141151 | 1603.68 | 377 | 379 | 87.8 |
| C | 0 | 10 | 56480 | 639.11 | 377 | 379 | 87.8 |
| C | 14 | 254 | 28542 | 320.83 | 377 | 379 | 87.8 |
| D | 12 | 235 | 1052252 | 11140.68 | 379 | 366 | 94.4 |
| D | 8 | 195 | 374416 | 3961.62 | 379 | 366 | 94.4 |
| D | 2 | 250 | 61588 | 648.41 | 379 | 366 | 94.4 |
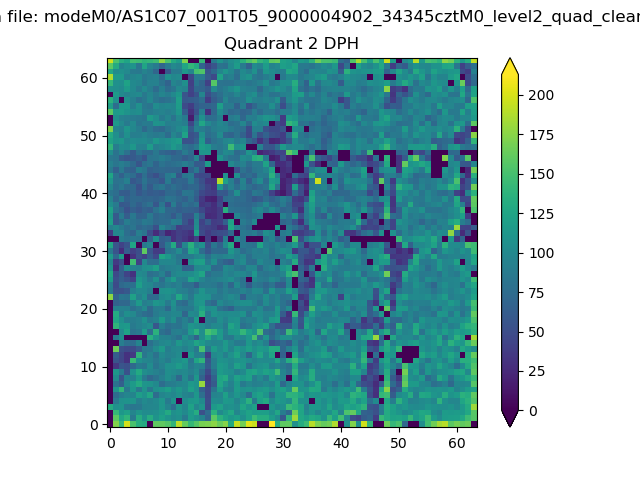
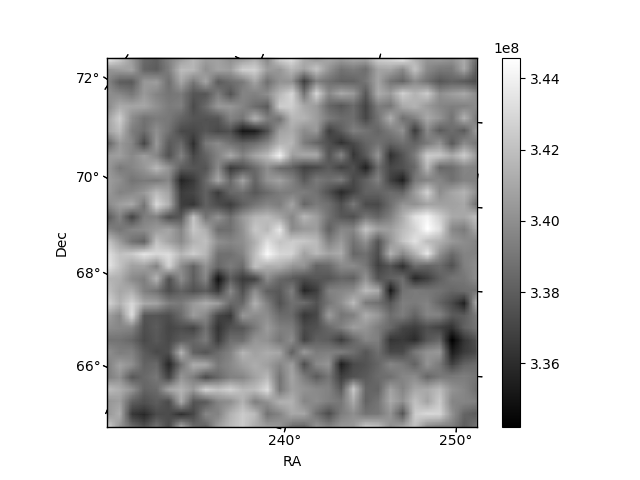
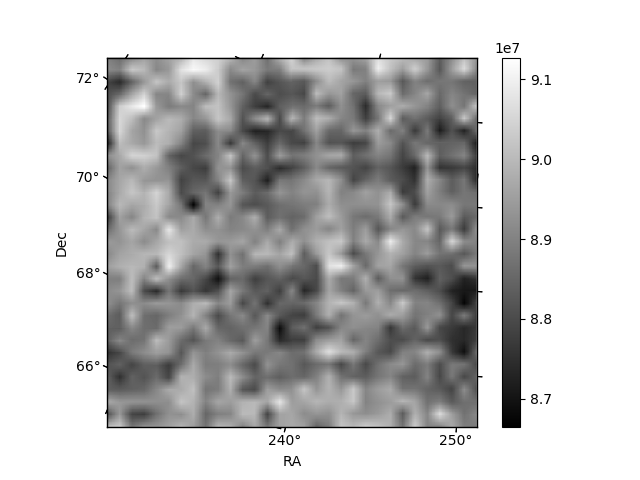
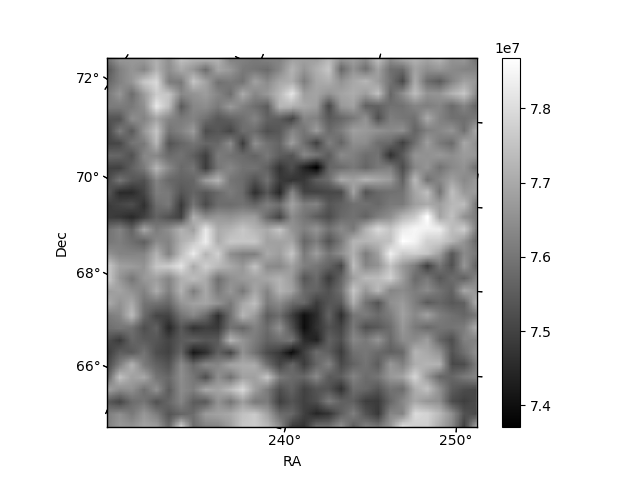
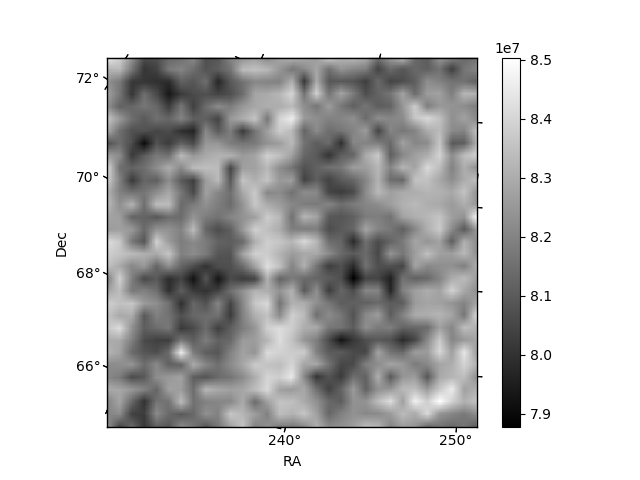
Histogram calculated using DETX and DETY for each event in the final _common_clean file
| Quadrant A | 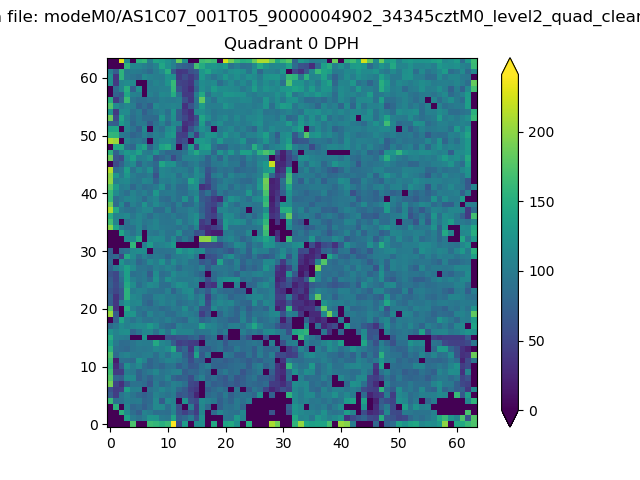 |
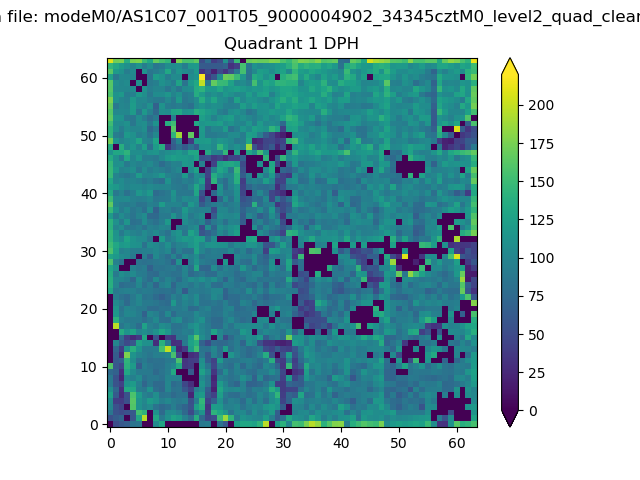 |
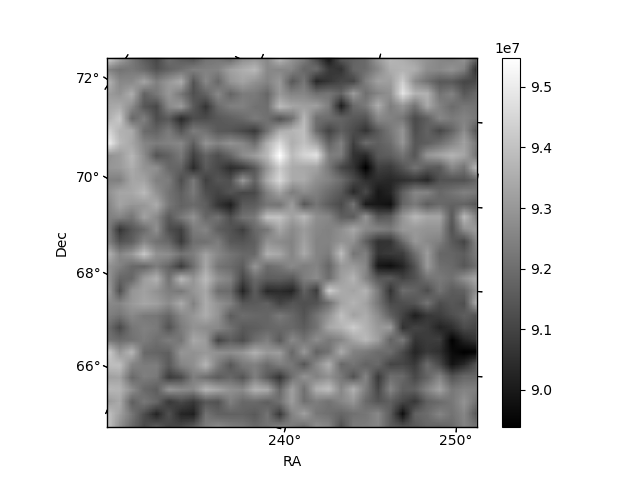
Quadrant B |
|---|---|---|---|
| Quadrant D | 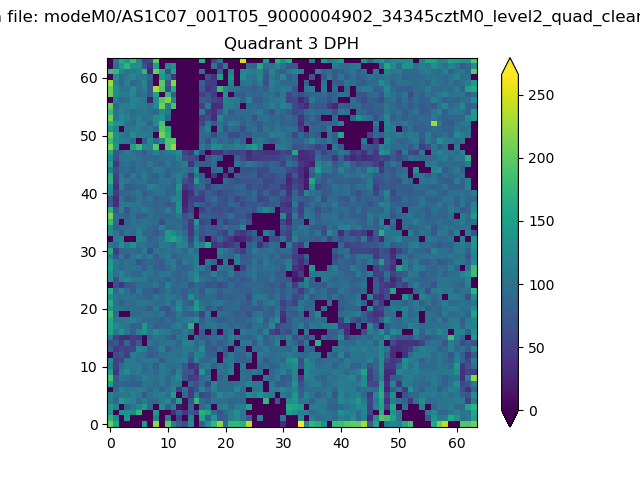 |
 |
Quadrant C |
| Plot type | Count rate plots | Images |
|---|---|---|
| Comparison with Poisson distribution Blue bars denote a histogram of data divided into 1 sec bins. Red curve is a Poisson curve with rate = median count rate of data. |
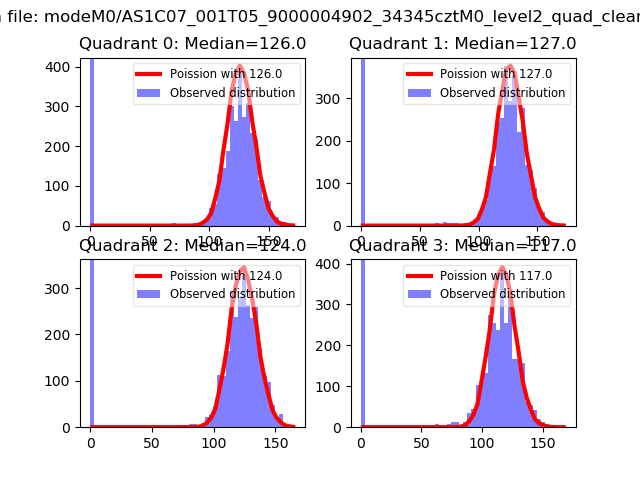 |
 |
| Quadrant-wise count rates Data is divided into 100 sec bins |
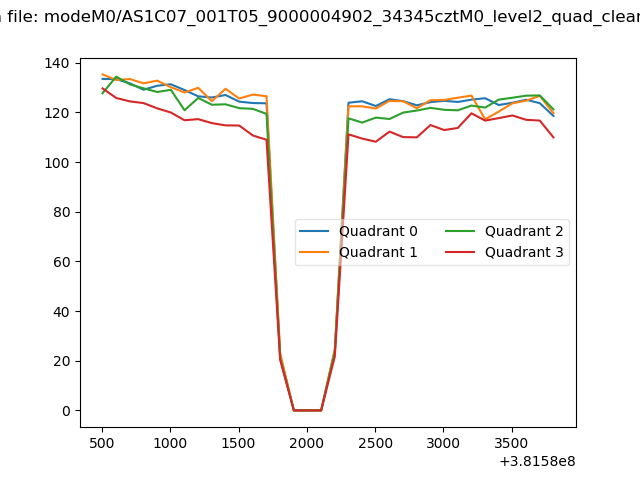 |
|
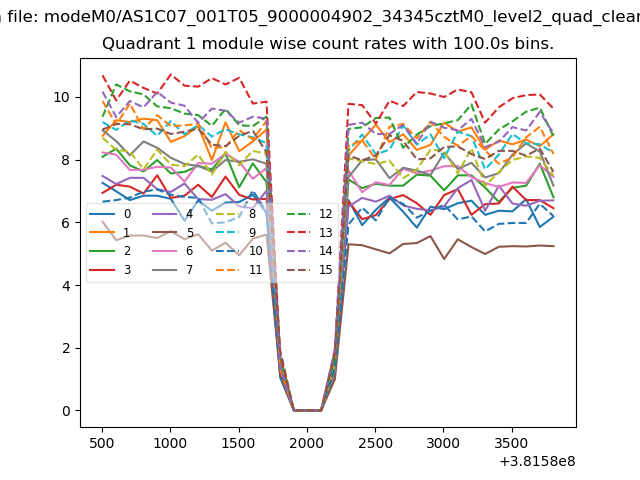
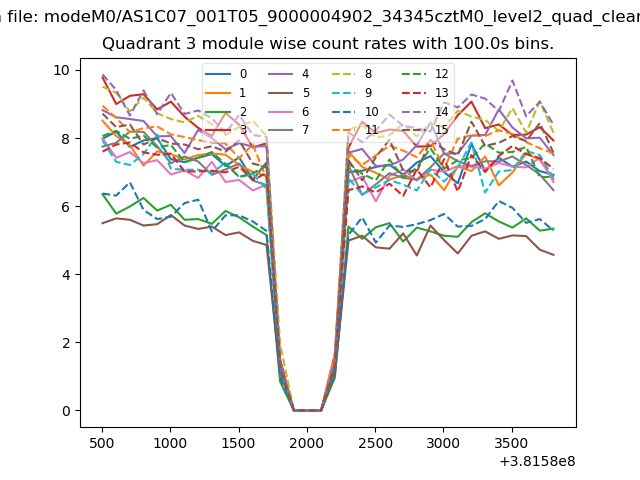
| Module-wise count rates for Quadrant A Data is divided into 100 sec bins |
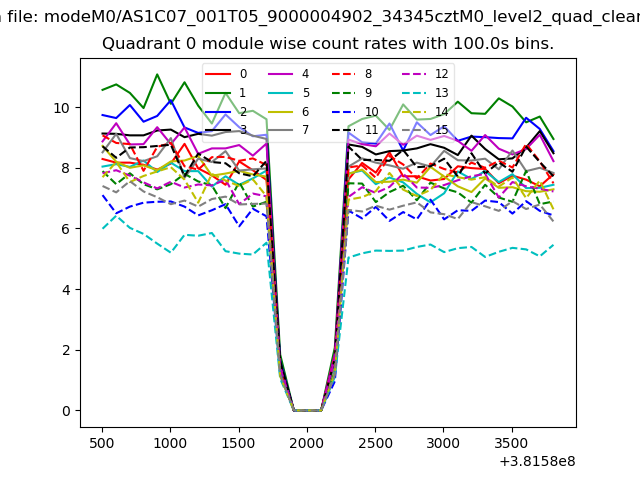 |
 |
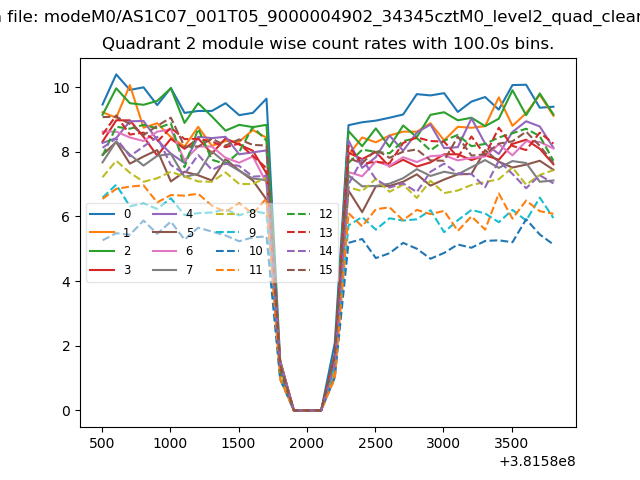
| Module-wise count rates for Quadrant B Data is divided into 100 sec bins |
 |
 |
| Module-wise count rates for Quadrant C Data is divided into 100 sec bins |
 |
 |
| Module-wise count rates for Quadrant D Data is divided into 100 sec bins |
 |
 |
| Parameter | Plot |
|---|---|
| CZT HV Monitor | 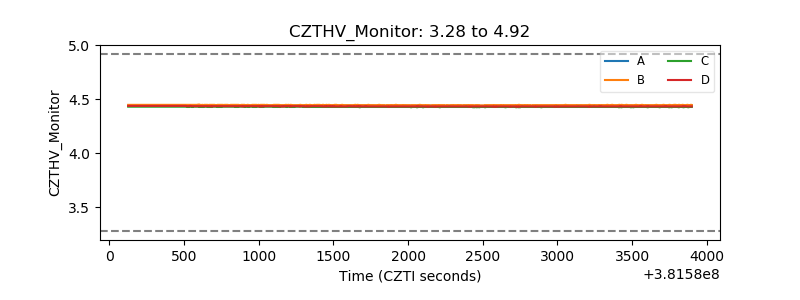 |
| D_VDD | 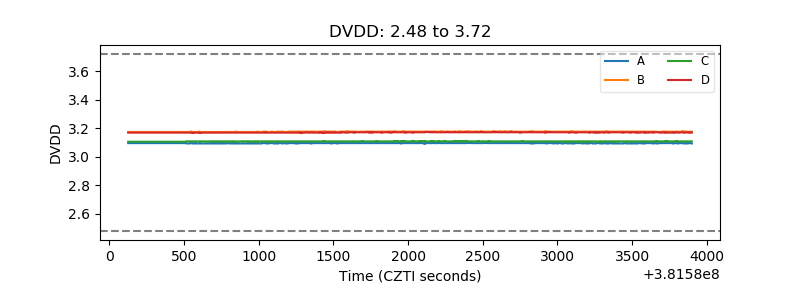 |
| Temperature 1 | 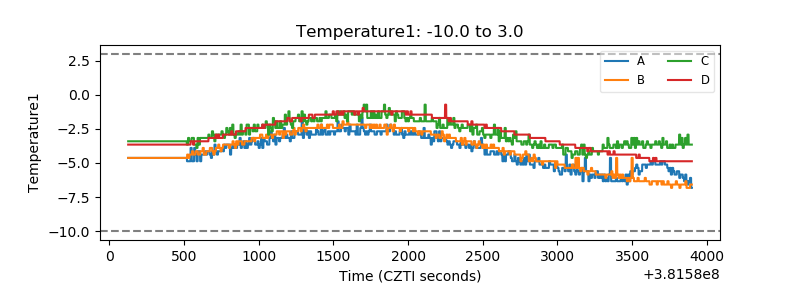 |
| Veto HV Monitor | 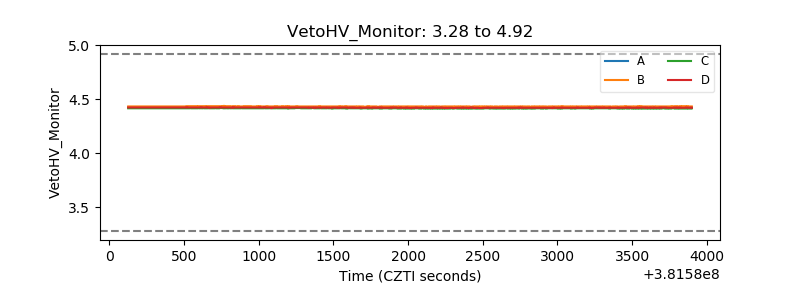 |
| Veto LLD | 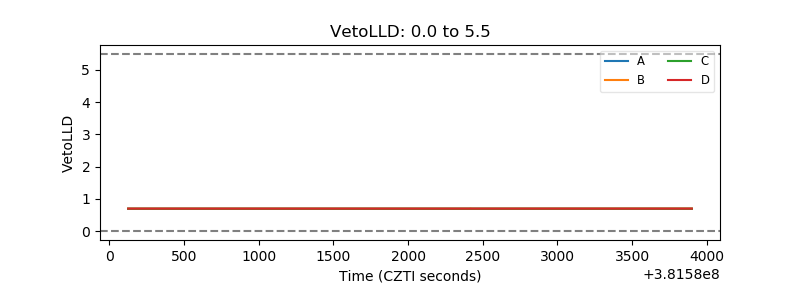 |
| Alpha Counter | 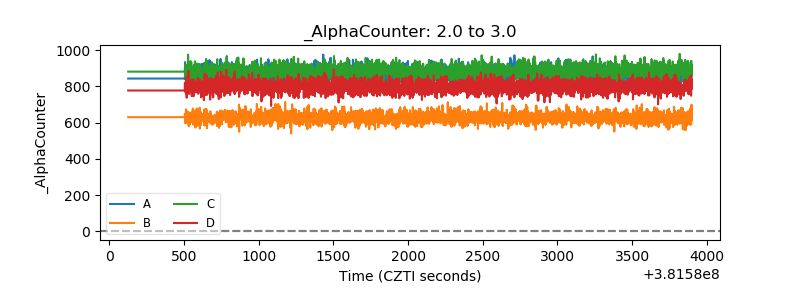 |
| _CPM_Rate | 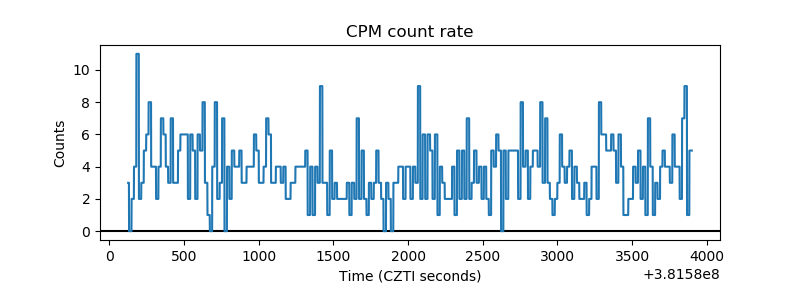 |
| CZT Counter | 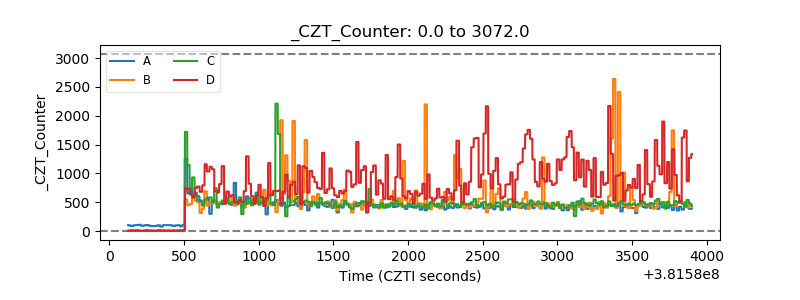 |
| +2.5 Volts monitor | 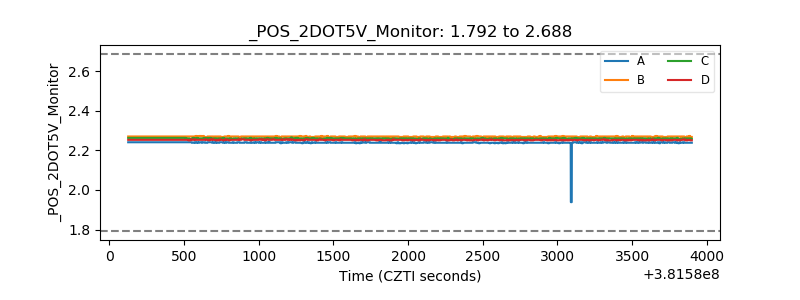 |
| +5 Volts monitor | 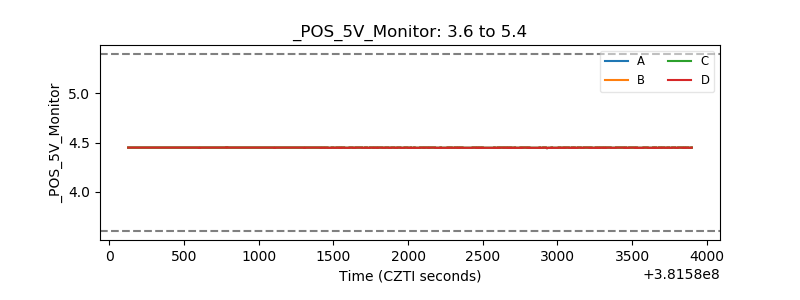 |
| _ROLL_ROT | 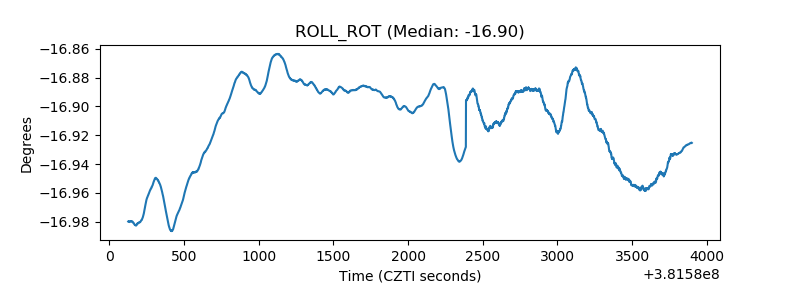 |
| _Roll_DEC | 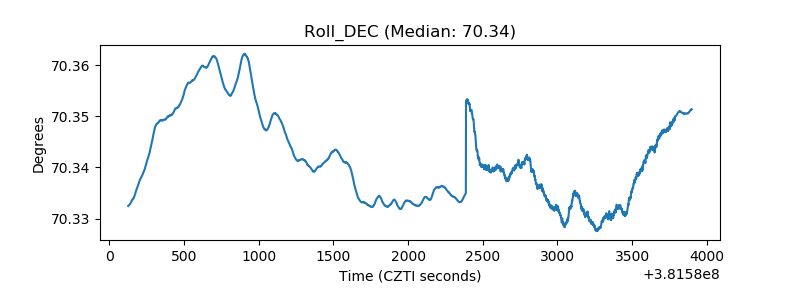 |
| _Roll_RA | 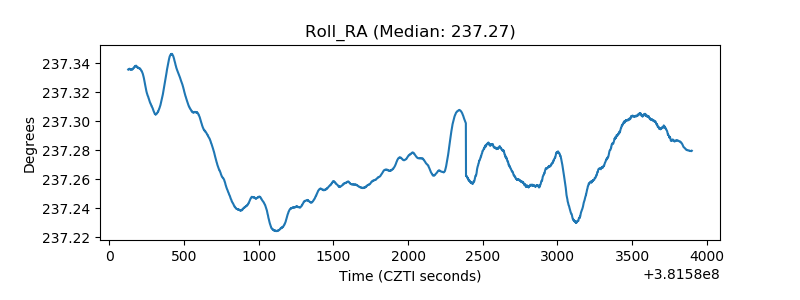 |
| Veto Counter | 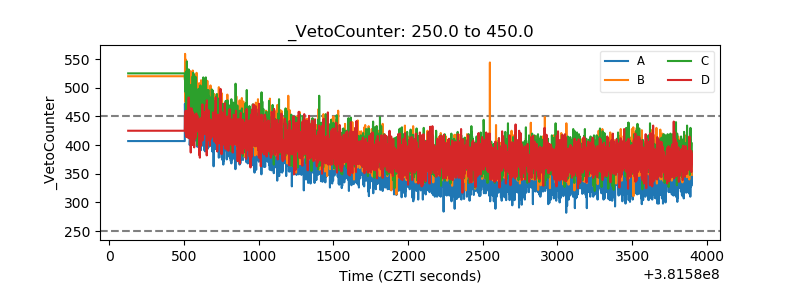 |