| Param | Original file | Final file |
|---|---|---|
| Filename | modeM0/AS1C07_001T05_9000004902_34344cztM0_level2.evt | modeM0/AS1C07_001T05_9000004902_34344cztM0_level2_quad_clean.evt |
| Size (bytes) | 477,316,800 | 96,186,240 |
| Size | 455.2 MB | 91.7 MB |
| Events in quadrant A | 2,571,391 | 644,070 |
| Events in quadrant B | 3,334,988 | 644,262 |
| Events in quadrant C | 3,146,820 | 636,613 |
| Events in quadrant D | 5,020,648 | 594,400 |
| Mode SS | |||
|---|---|---|---|
| Quadrant | BADHDUFLAG | Total packets | Discarded packets |
| A | 0 | 114 | 0 |
| B | 0 | 114 | 0 |
| C | 0 | 114 | 0 |
| D | 0 | 114 | 0 |
| Mode M9 | |||
|---|---|---|---|
| Quadrant | BADHDUFLAG | Total packets | Discarded packets |
| A | 0 | 16 | 0 |
| B | 0 | 16 | 0 |
| C | 0 | 16 | 0 |
| D | 0 | 17 | 0 |
| Mode M0 | |||
|---|---|---|---|
| Quadrant | BADHDUFLAG | Total packets | Discarded packets |
| A | 0 | 11416 | 3 |
| B | 0 | 13508 | 2 |
| C | 0 | 12637 | 2 |
| D | 0 | 18848 | 2 |
| Quadrant | Total seconds | Saturated seconds | Saturation percentage |
|---|---|---|---|
| A | 5629 | 7 | 0.124356% |
| B | 5629 | 172 | 3.055605% |
| C | 5629 | 51 | 0.906022% |
| D | 5629 | 275 | 4.885415% |
Noise dominated data is calculated using 1-second bins in cleaned event files. If a bin has >2000 counts, and if more than 50% of those come from <1% of pixels, then it is considered to be noise-dominated and hence unusable.
| Quadrant | # 1 sec bins | Bins with >0 counts | Bins with >2000 counts | High rate bins dominated by noise | Noise dominated (total time) | Noise dominated (detector-on time) | Marked lightcurve |
|---|---|---|---|---|---|---|---|
| A | 7182 | 5630 | 0 | 0 | 0.00% | 0.00% | 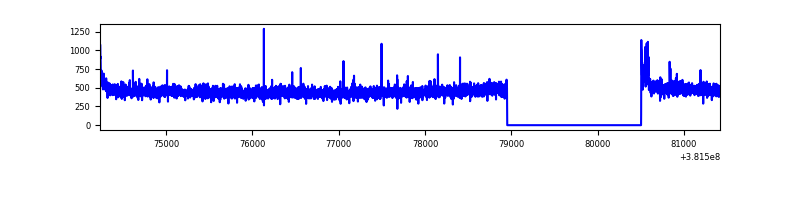 |
| B | 7182 | 5630 | 113 | 113 | 1.57% | 2.01% | 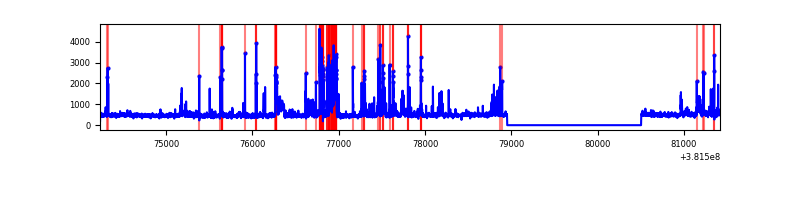 |
| C | 7182 | 5630 | 46 | 46 | 0.64% | 0.82% | 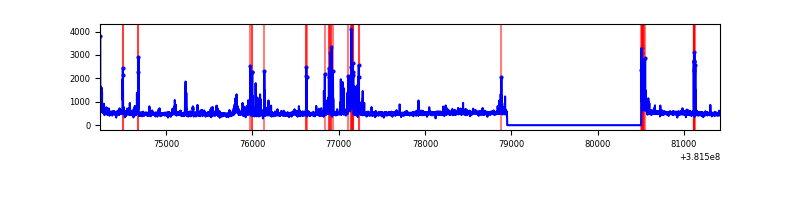 |
| D | 7182 | 5630 | 302 | 302 | 4.20% | 5.36% | 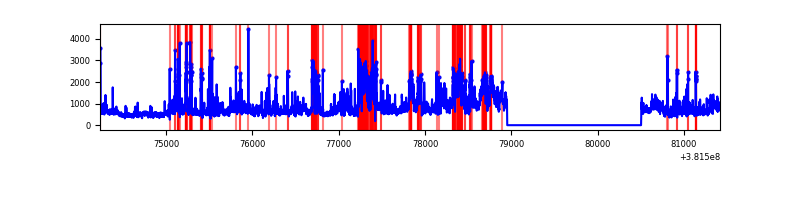 |
Top three noisy pixels from each quadrant. If the there are fewer than three noisy pixels in the level2.evt file, extra rows are filled as -1
| Pixel properties | Quadrant properties | ||||||
|---|---|---|---|---|---|---|---|
| Quadrant | DetID | PixID | Counts | Sigma | Mean | Median | Sigma |
| A | 10 | 83 | 30984 | 230.53 | 651 | 640 | 131.6 |
| A | 9 | 143 | 16405 | 119.77 | 651 | 640 | 131.6 |
| A | 13 | 6 | 9590 | 67.99 | 651 | 640 | 131.6 |
| B | 5 | 172 | 712332 | 5706.5 | 639 | 621 | 124.7 |
| B | 4 | 251 | 51549 | 408.34 | 639 | 621 | 124.7 |
| B | 0 | 229 | 20149 | 156.58 | 639 | 621 | 124.7 |
| C | 14 | 254 | 350445 | 2419.24 | 628 | 632 | 144.6 |
| C | 15 | 214 | 237098 | 1635.35 | 628 | 632 | 144.6 |
| C | 0 | 10 | 77015 | 528.25 | 628 | 632 | 144.6 |
| D | 12 | 235 | 1504184 | 9799.74 | 625 | 608 | 153.4 |
| D | 8 | 195 | 605199 | 3940.49 | 625 | 608 | 153.4 |
| D | 2 | 250 | 181446 | 1178.63 | 625 | 608 | 153.4 |
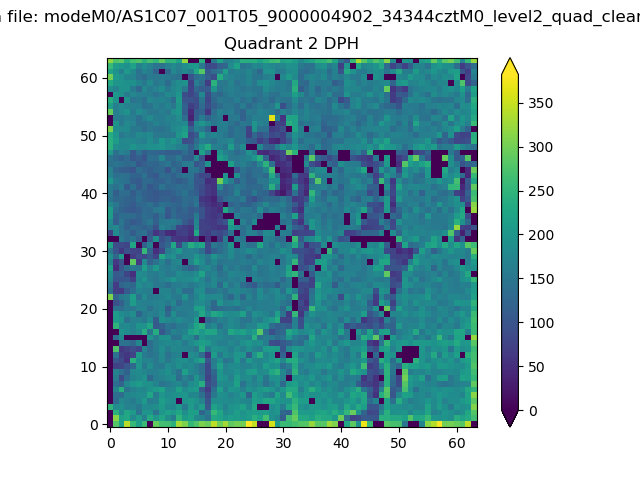
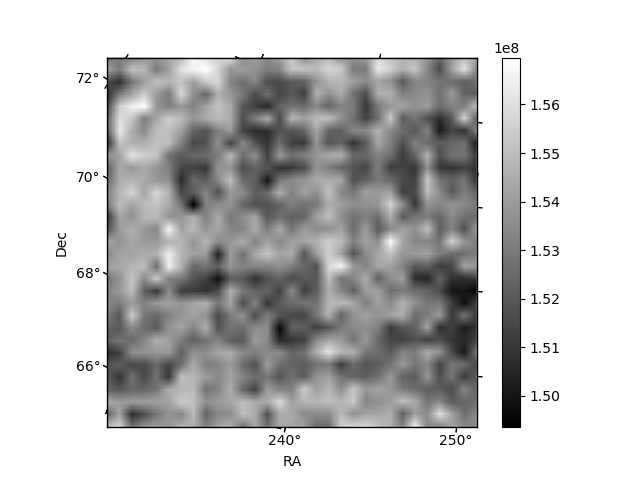
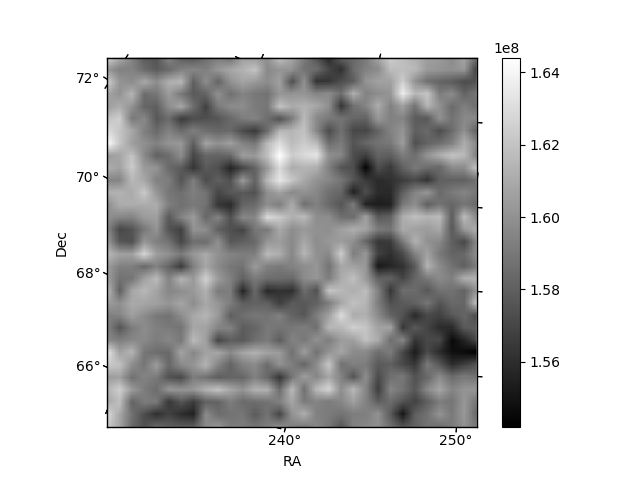
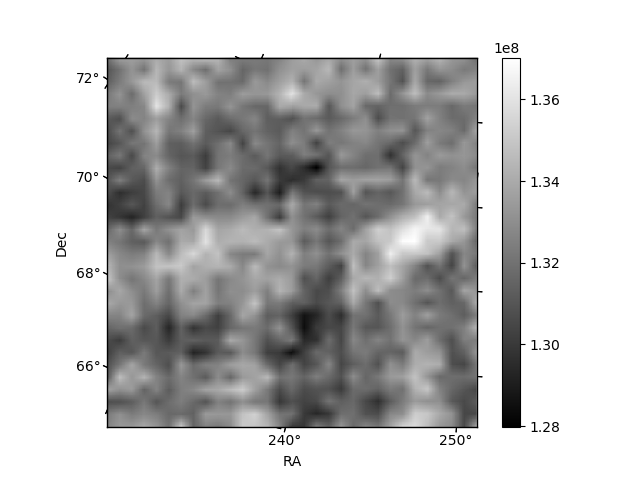
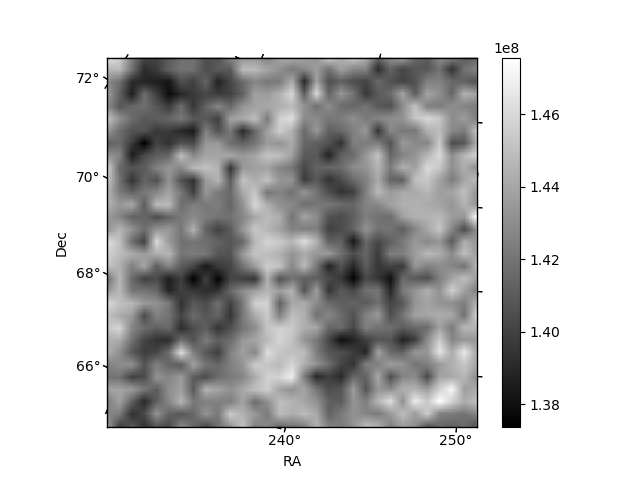
Histogram calculated using DETX and DETY for each event in the final _common_clean file
| Quadrant A | 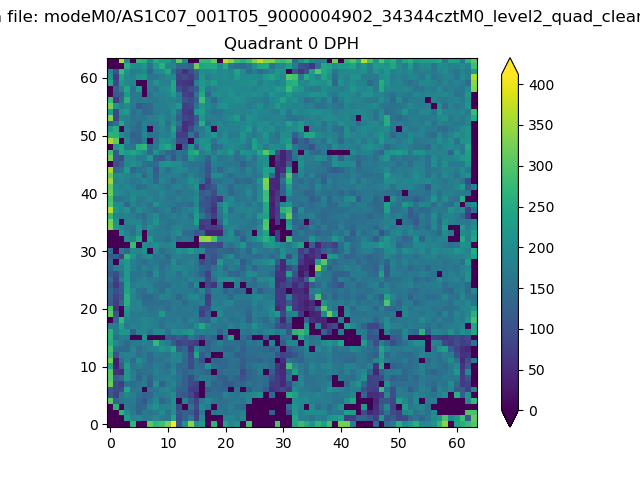 |
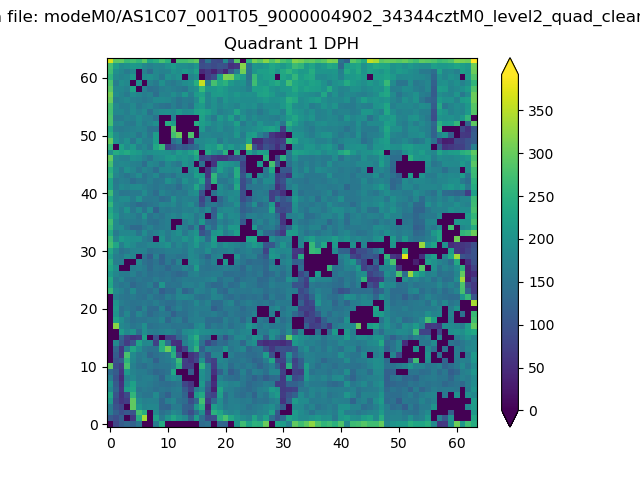 |
Quadrant B |
|---|---|---|---|
| Quadrant D | 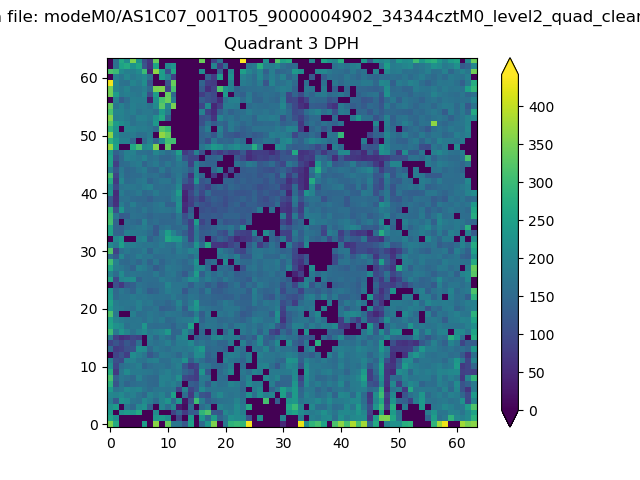 |
 |
Quadrant C |
| Plot type | Count rate plots | Images |
|---|---|---|
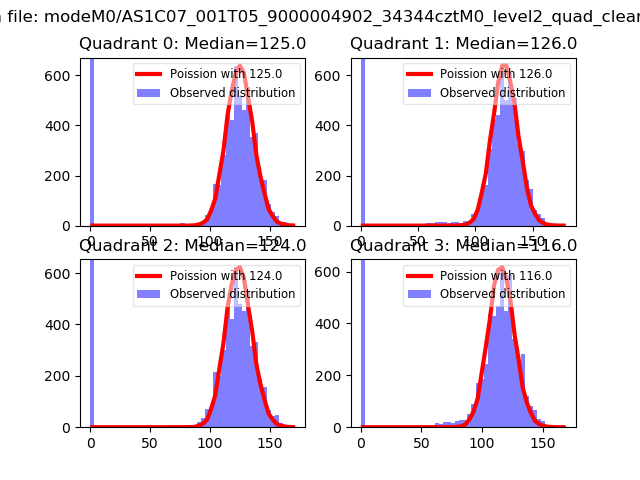
| Comparison with Poisson distribution Blue bars denote a histogram of data divided into 1 sec bins. Red curve is a Poisson curve with rate = median count rate of data. |
 |
 |
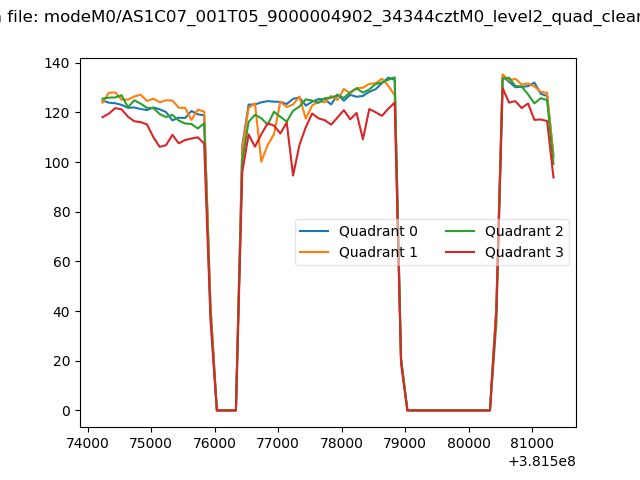
| Quadrant-wise count rates Data is divided into 100 sec bins |
 |
|
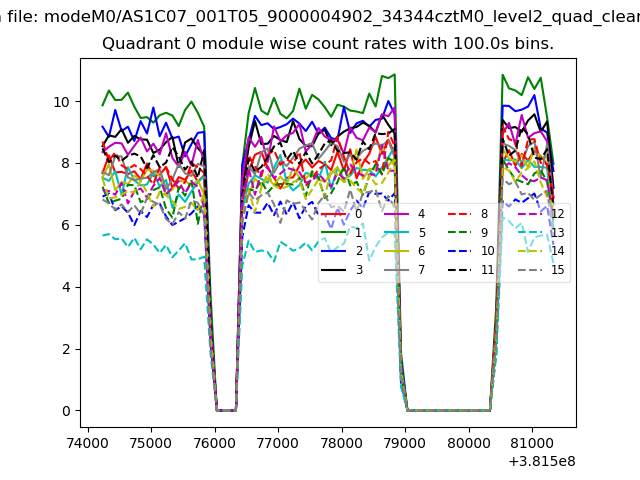
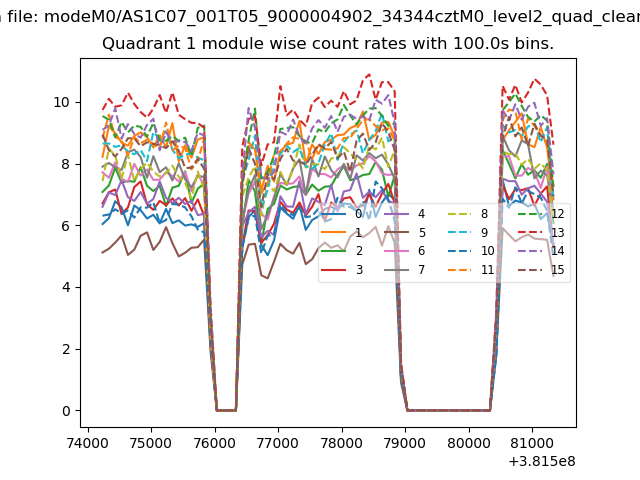
| Module-wise count rates for Quadrant A Data is divided into 100 sec bins |
 |
 |
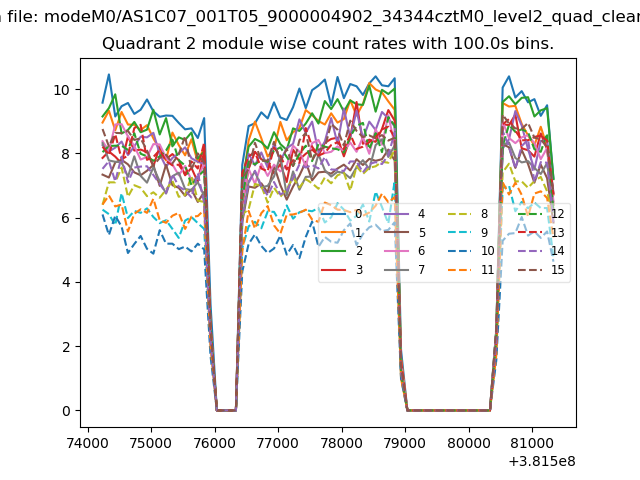
| Module-wise count rates for Quadrant B Data is divided into 100 sec bins |
 |
 |
| Module-wise count rates for Quadrant C Data is divided into 100 sec bins |
 |
 |
| Module-wise count rates for Quadrant D Data is divided into 100 sec bins |
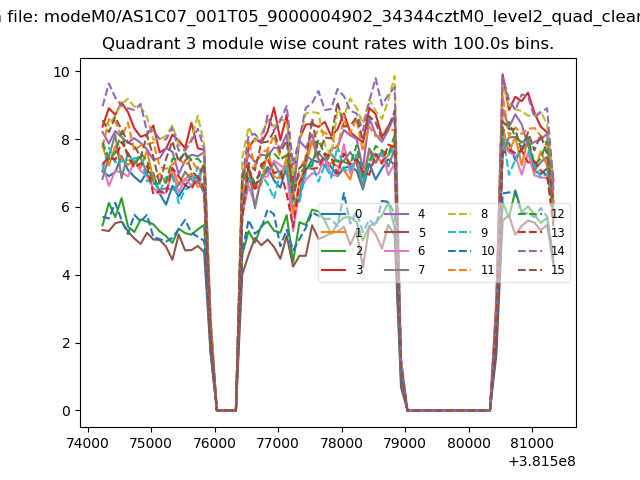 |
 |
| Parameter | Plot |
|---|---|
| CZT HV Monitor | 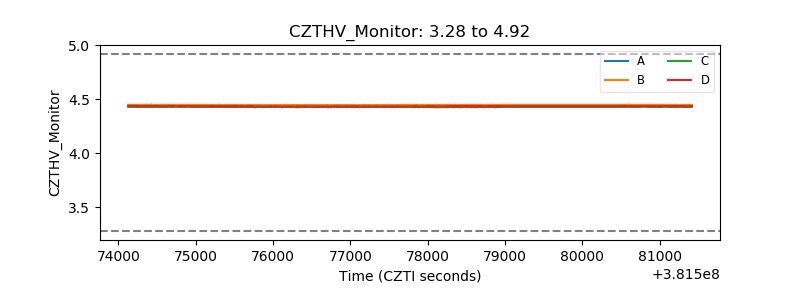 |
| D_VDD | 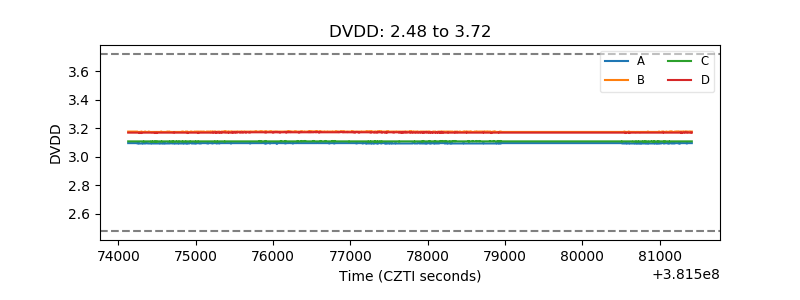 |
| Temperature 1 | 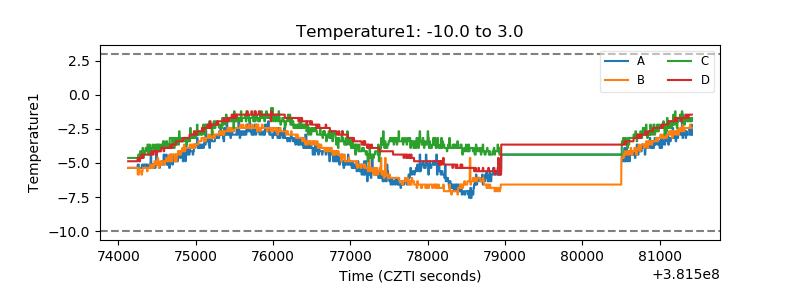 |
| Veto HV Monitor |  |
| Veto LLD | 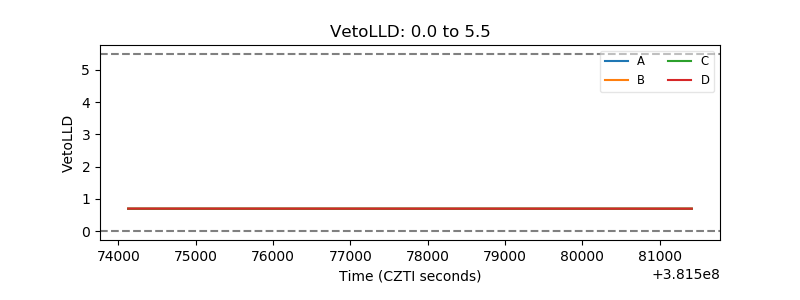 |
| Alpha Counter | 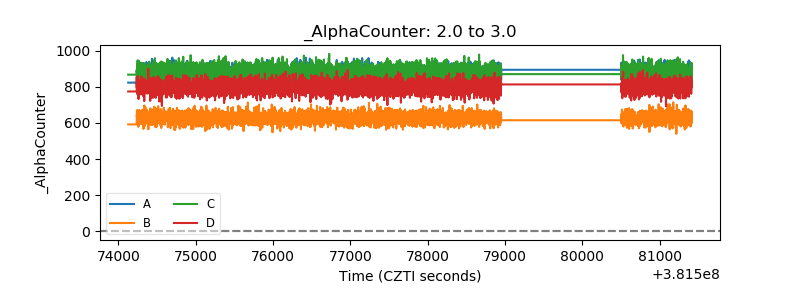 |
| _CPM_Rate | 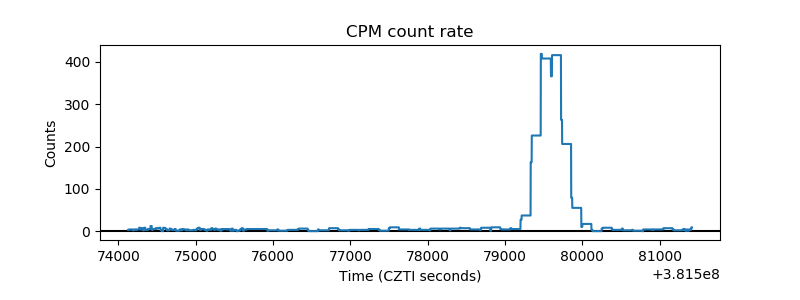 |
| CZT Counter | 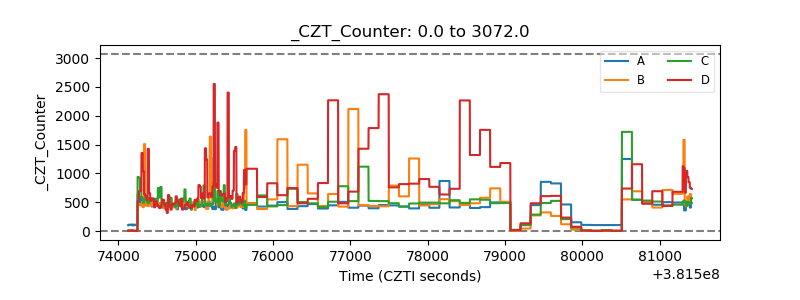 |
| +2.5 Volts monitor | 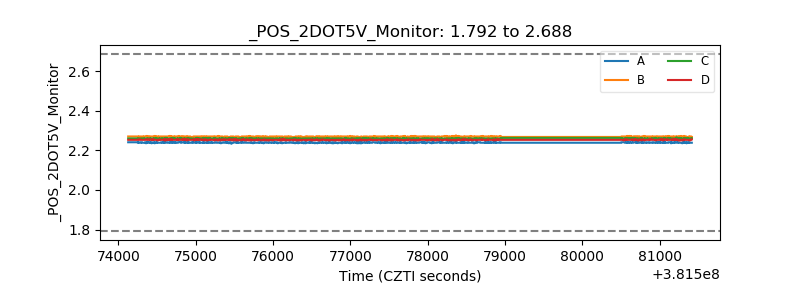 |
| +5 Volts monitor |  |
| _ROLL_ROT | 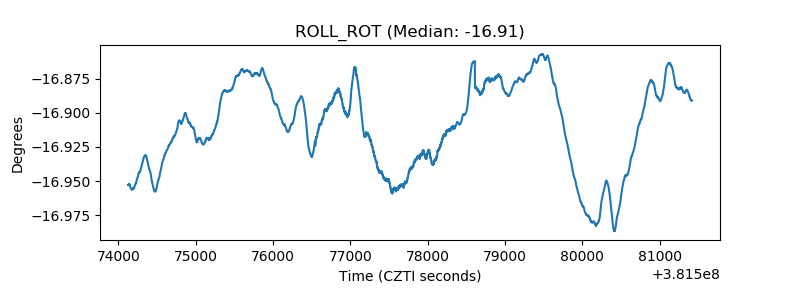 |
| _Roll_DEC | 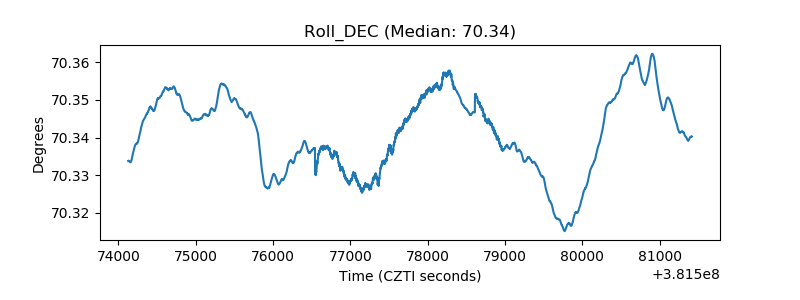 |
| _Roll_RA | 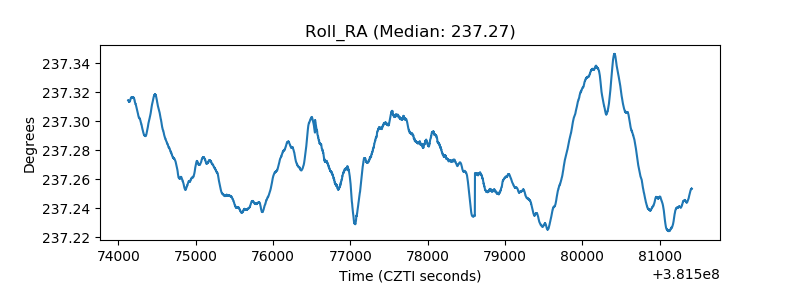 |
| Veto Counter | 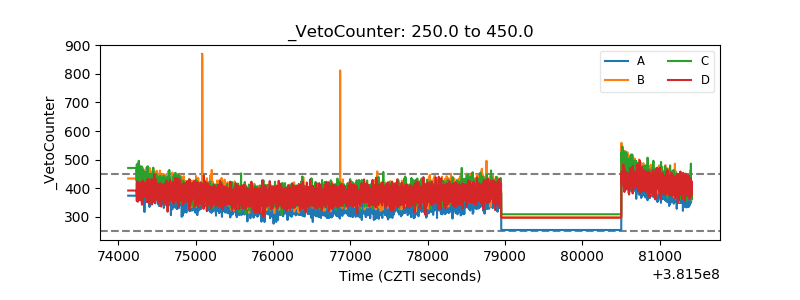 |