| Param | Original file | Final file |
|---|---|---|
| Filename | modeM0/AS1C07_001T05_9000004902_34332cztM0_level2.evt | modeM0/AS1C07_001T05_9000004902_34332cztM0_level2_quad_clean.evt |
| Size (bytes) | 449,542,080 | 86,114,880 |
| Size | 428.7 MB | 82.1 MB |
| Events in quadrant A | 2,552,074 | 566,813 |
| Events in quadrant B | 2,967,214 | 569,085 |
| Events in quadrant C | 2,901,497 | 558,599 |
| Events in quadrant D | 4,822,107 | 530,502 |
| Mode SS | |||
|---|---|---|---|
| Quadrant | BADHDUFLAG | Total packets | Discarded packets |
| A | 0 | 112 | 0 |
| B | 0 | 112 | 0 |
| C | 0 | 112 | 0 |
| D | 0 | 112 | 0 |
| Mode M9 | |||
|---|---|---|---|
| Quadrant | BADHDUFLAG | Total packets | Discarded packets |
| A | 0 | 17 | 0 |
| B | 0 | 17 | 0 |
| C | 0 | 17 | 0 |
| D | 0 | 17 | 0 |
| Mode M0 | |||
|---|---|---|---|
| Quadrant | BADHDUFLAG | Total packets | Discarded packets |
| A | 0 | 11173 | 2 |
| B | 0 | 12323 | 1 |
| C | 0 | 11821 | 1 |
| D | 0 | 18010 | 1 |
| Quadrant | Total seconds | Saturated seconds | Saturation percentage |
|---|---|---|---|
| A | 5469 | 8 | 0.146279% |
| B | 5469 | 66 | 1.206802% |
| C | 5469 | 29 | 0.530261% |
| D | 5469 | 371 | 6.783690% |
Noise dominated data is calculated using 1-second bins in cleaned event files. If a bin has >2000 counts, and if more than 50% of those come from <1% of pixels, then it is considered to be noise-dominated and hence unusable.
| Quadrant | # 1 sec bins | Bins with >0 counts | Bins with >2000 counts | High rate bins dominated by noise | Noise dominated (total time) | Noise dominated (detector-on time) | Marked lightcurve |
|---|---|---|---|---|---|---|---|
| A | 7203 | 5470 | 0 | 0 | 0.00% | 0.00% | 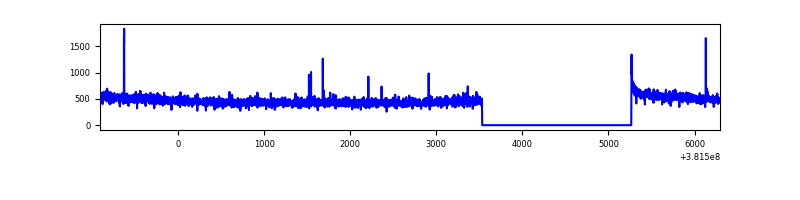 |
| B | 7203 | 5470 | 45 | 45 | 0.62% | 0.82% | 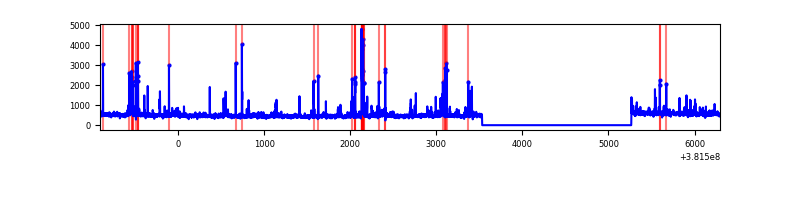 |
| C | 7203 | 5470 | 17 | 17 | 0.24% | 0.31% | 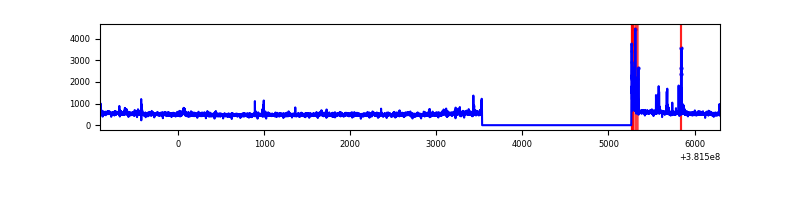 |
| D | 7203 | 5470 | 279 | 279 | 3.87% | 5.10% | 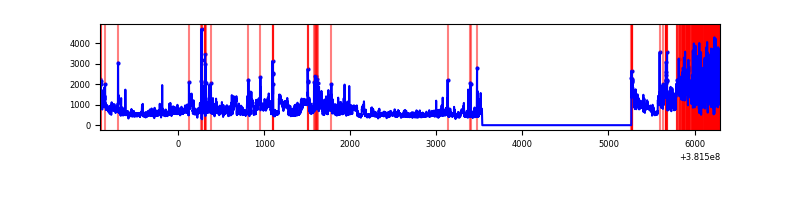 |
Top three noisy pixels from each quadrant. If the there are fewer than three noisy pixels in the level2.evt file, extra rows are filled as -1
| Pixel properties | Quadrant properties | ||||||
|---|---|---|---|---|---|---|---|
| Quadrant | DetID | PixID | Counts | Sigma | Mean | Median | Sigma |
| A | 10 | 83 | 21994 | 164.36 | 648 | 635 | 130.0 |
| A | 9 | 143 | 14056 | 103.28 | 648 | 635 | 130.0 |
| A | 13 | 6 | 9870 | 71.06 | 648 | 635 | 130.0 |
| B | 5 | 172 | 174262 | 1423.77 | 641 | 625 | 122.0 |
| B | 5 | 255 | 91834 | 747.88 | 641 | 625 | 122.0 |
| B | 0 | 229 | 53749 | 435.6 | 641 | 625 | 122.0 |
| C | 15 | 214 | 231286 | 1584.9 | 630 | 636 | 145.5 |
| C | 14 | 67 | 74417 | 506.98 | 630 | 636 | 145.5 |
| C | 0 | 10 | 62136 | 422.59 | 630 | 636 | 145.5 |
| D | 8 | 195 | 715747 | 4770.45 | 617 | 600 | 149.9 |
| D | 12 | 235 | 550876 | 3670.66 | 617 | 600 | 149.9 |
| D | 7 | 223 | 449866 | 2996.87 | 617 | 600 | 149.9 |
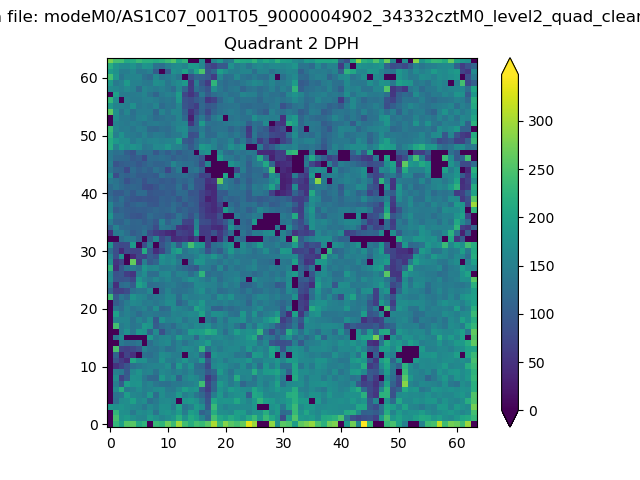
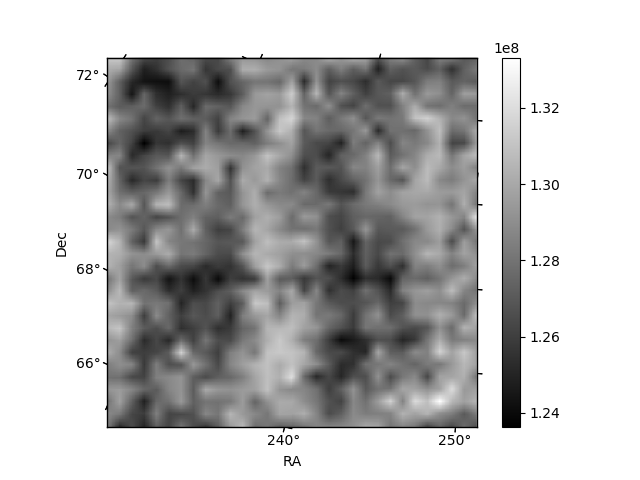
Histogram calculated using DETX and DETY for each event in the final _common_clean file
| Quadrant A | 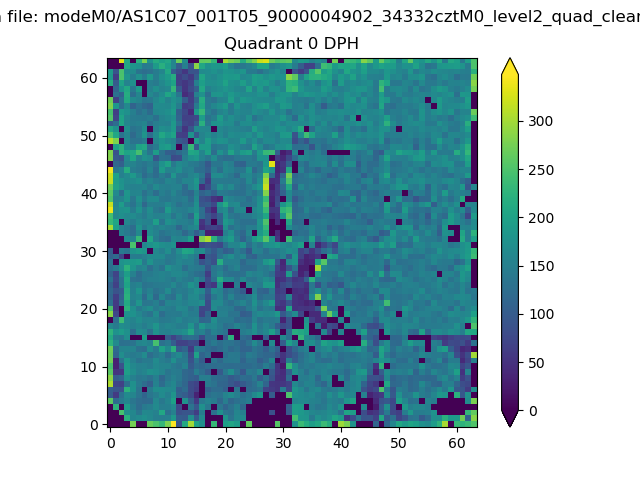 |
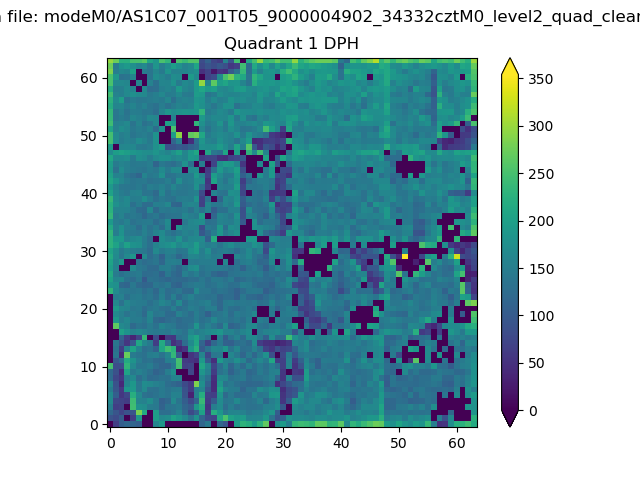 |
Quadrant B |
|---|---|---|---|
| Quadrant D | 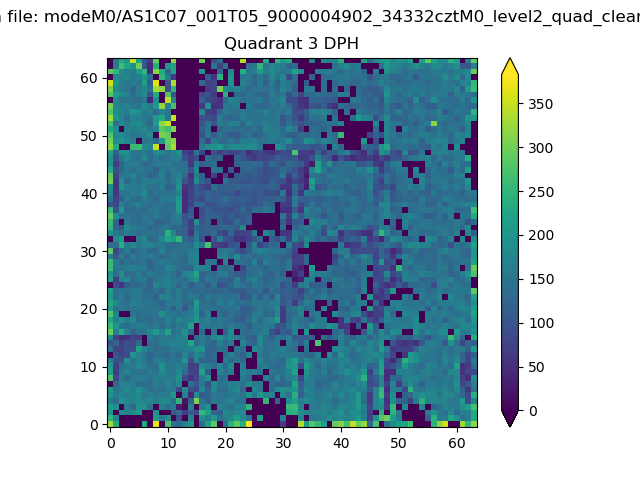 |
 |
Quadrant C |
| Plot type | Count rate plots | Images |
|---|---|---|
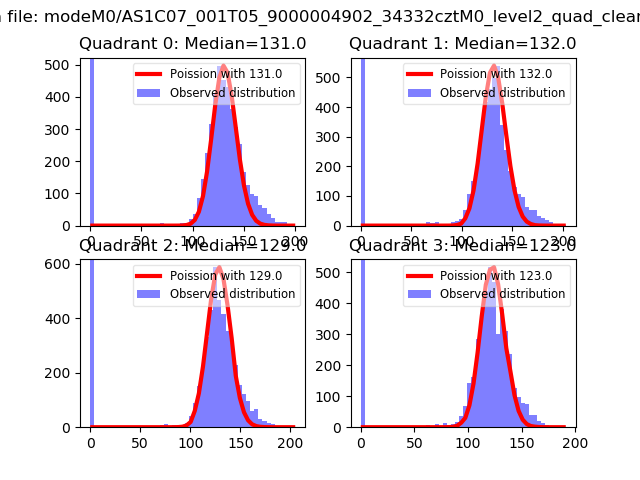
| Comparison with Poisson distribution Blue bars denote a histogram of data divided into 1 sec bins. Red curve is a Poisson curve with rate = median count rate of data. |
 |
 |
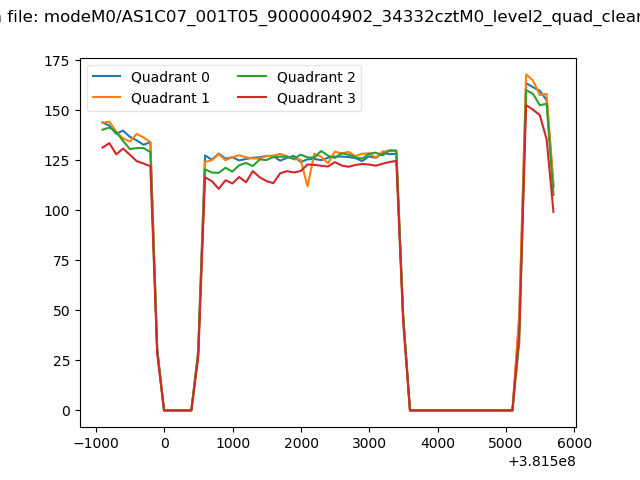
| Quadrant-wise count rates Data is divided into 100 sec bins |
 |
|
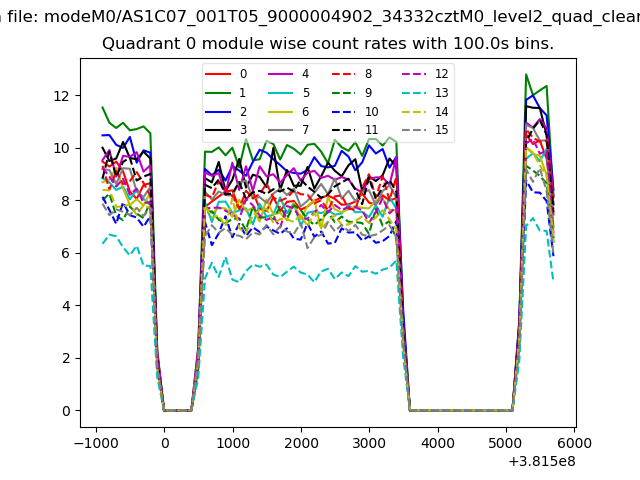
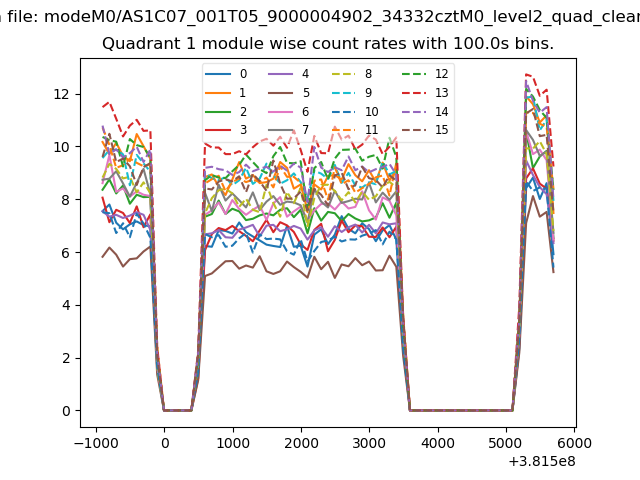
| Module-wise count rates for Quadrant A Data is divided into 100 sec bins |
 |
 |
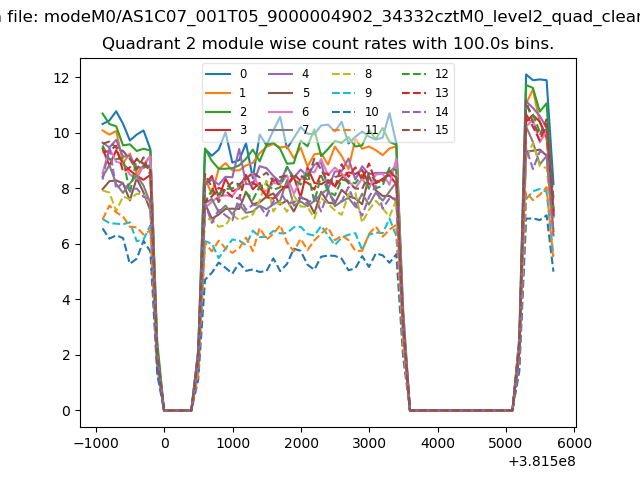
| Module-wise count rates for Quadrant B Data is divided into 100 sec bins |
 |
 |
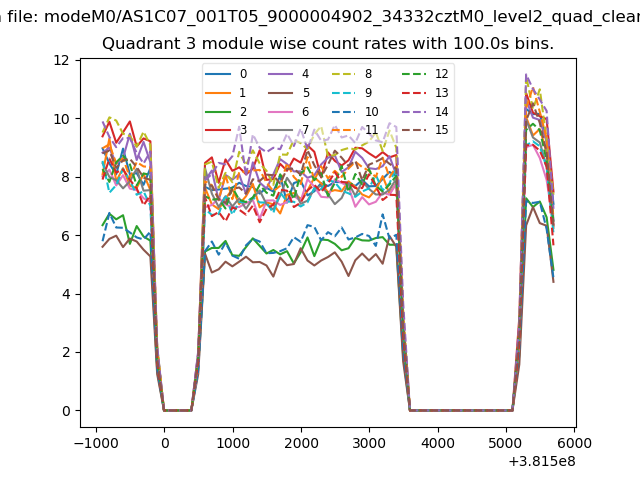
| Module-wise count rates for Quadrant C Data is divided into 100 sec bins |
 |
 |
| Module-wise count rates for Quadrant D Data is divided into 100 sec bins |
 |
 |
| Parameter | Plot |
|---|---|
| CZT HV Monitor |  |
| D_VDD | 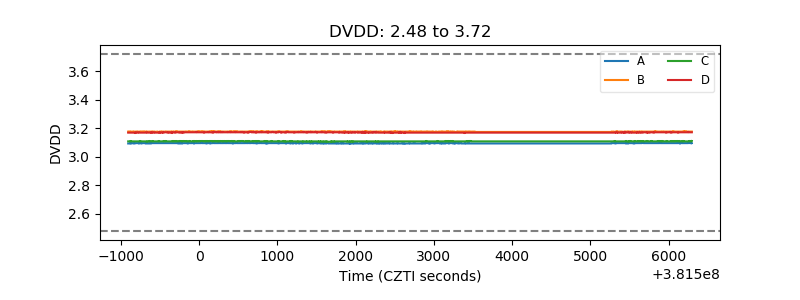 |
| Temperature 1 | 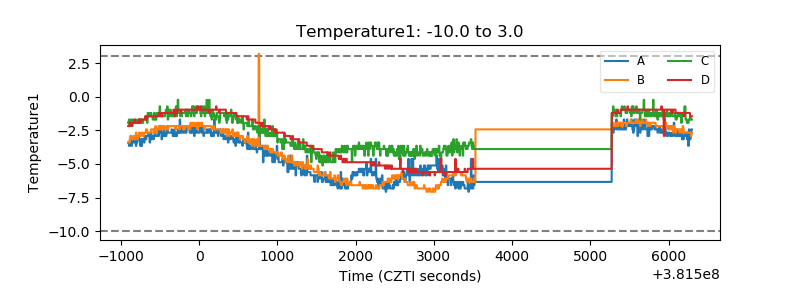 |
| Veto HV Monitor | 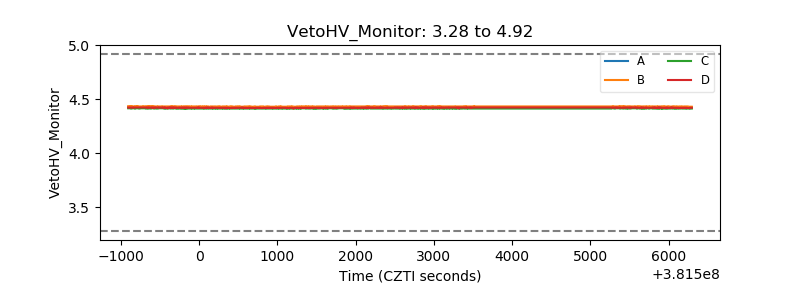 |
| Veto LLD | 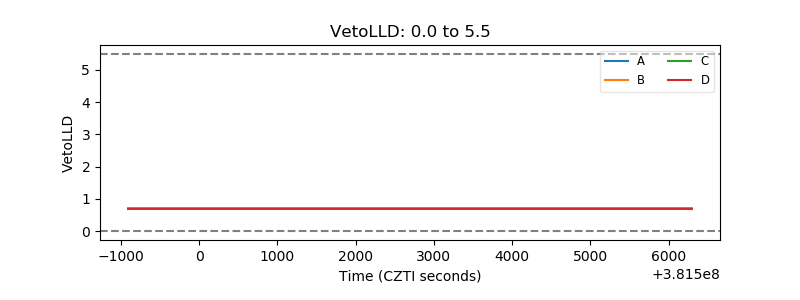 |
| Alpha Counter | 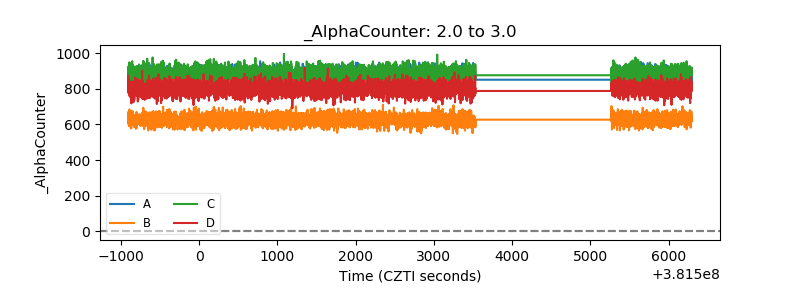 |
| _CPM_Rate | 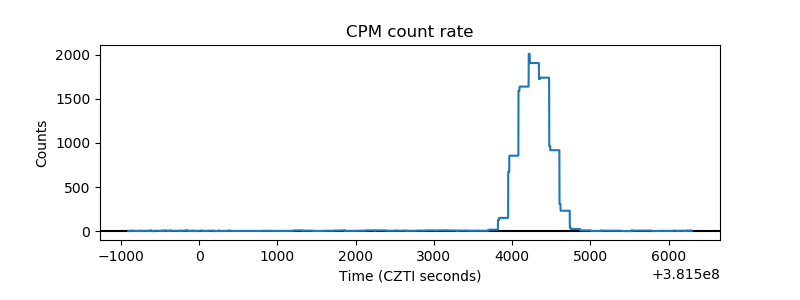 |
| CZT Counter | 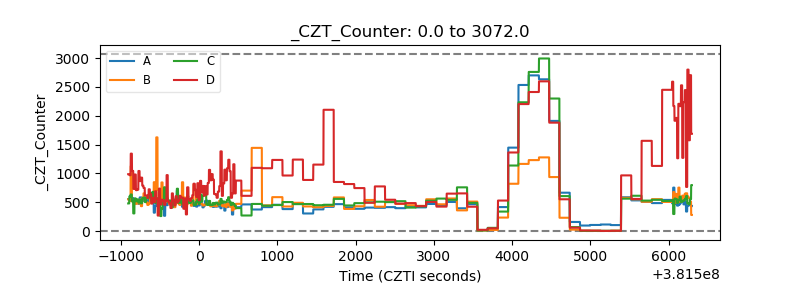 |
| +2.5 Volts monitor | 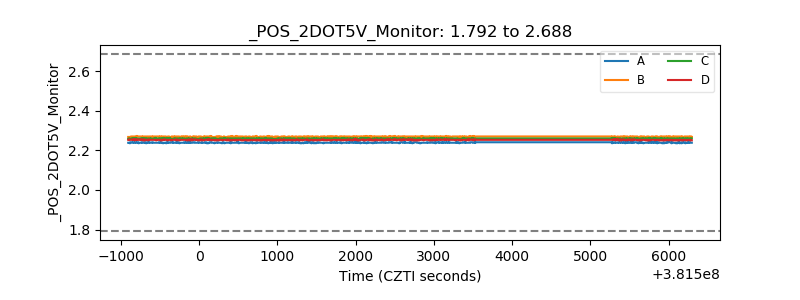 |
| +5 Volts monitor | 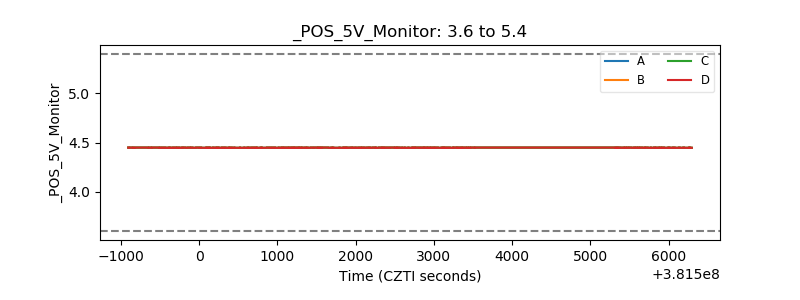 |
| _ROLL_ROT | 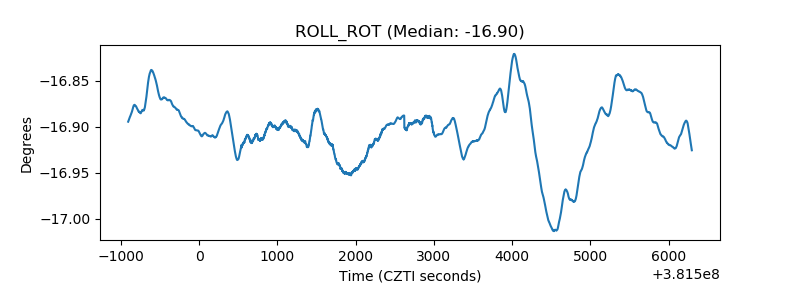 |
| _Roll_DEC | 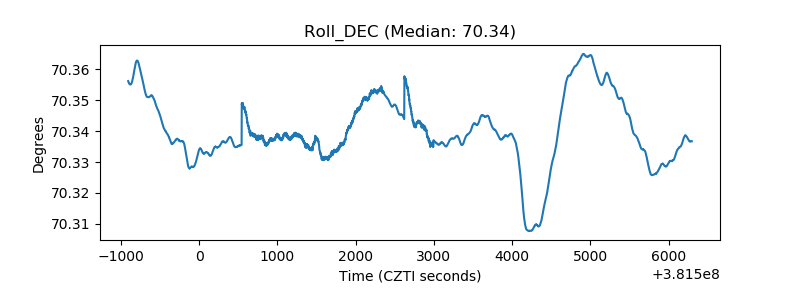 |
| _Roll_RA | 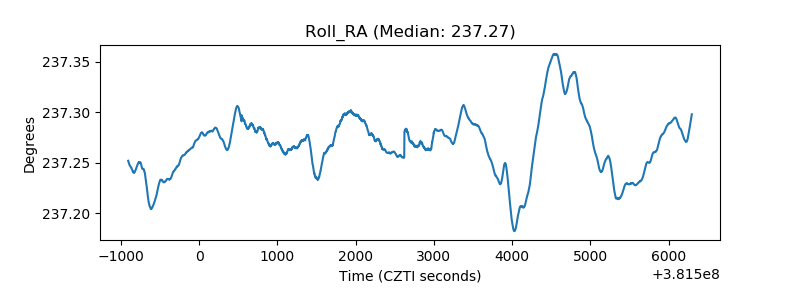 |
| Veto Counter | 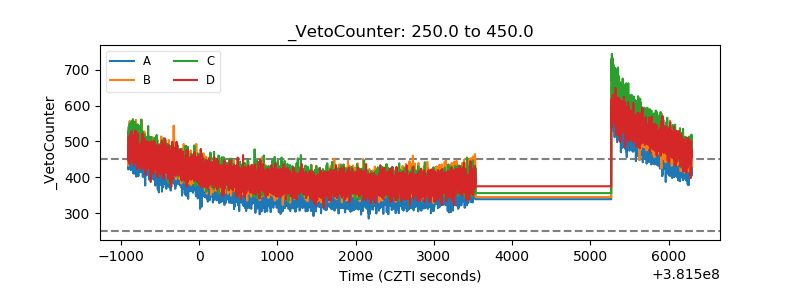 |