| Param | Original file | Final file |
|---|---|---|
| Filename | modeM0/AS1C07_001T05_9000004902_34330cztM0_level2.evt | modeM0/AS1C07_001T05_9000004902_34330cztM0_level2_quad_clean.evt |
| Size (bytes) | 445,645,440 | 89,138,880 |
| Size | 425.0 MB | 85.0 MB |
| Events in quadrant A | 2,447,064 | 593,159 |
| Events in quadrant B | 3,180,407 | 594,482 |
| Events in quadrant C | 2,964,672 | 584,823 |
| Events in quadrant D | 4,540,078 | 551,486 |
| Mode SS | |||
|---|---|---|---|
| Quadrant | BADHDUFLAG | Total packets | Discarded packets |
| A | 0 | 110 | 0 |
| B | 0 | 110 | 0 |
| C | 0 | 110 | 0 |
| D | 0 | 110 | 0 |
| Mode M9 | |||
|---|---|---|---|
| Quadrant | BADHDUFLAG | Total packets | Discarded packets |
| A | 0 | 16 | 0 |
| B | 0 | 16 | 0 |
| C | 0 | 16 | 0 |
| D | 0 | 16 | 0 |
| Mode M0 | |||
|---|---|---|---|
| Quadrant | BADHDUFLAG | Total packets | Discarded packets |
| A | 0 | 10875 | 2 |
| B | 0 | 12807 | 1 |
| C | 0 | 11969 | 1 |
| D | 0 | 17125 | 1 |
| Quadrant | Total seconds | Saturated seconds | Saturation percentage |
|---|---|---|---|
| A | 5360 | 8 | 0.149254% |
| B | 5360 | 144 | 2.686567% |
| C | 5360 | 83 | 1.548507% |
| D | 5360 | 136 | 2.537313% |
Noise dominated data is calculated using 1-second bins in cleaned event files. If a bin has >2000 counts, and if more than 50% of those come from <1% of pixels, then it is considered to be noise-dominated and hence unusable.
| Quadrant | # 1 sec bins | Bins with >0 counts | Bins with >2000 counts | High rate bins dominated by noise | Noise dominated (total time) | Noise dominated (detector-on time) | Marked lightcurve |
|---|---|---|---|---|---|---|---|
| A | 6973 | 5361 | 4 | 4 | 0.06% | 0.07% | 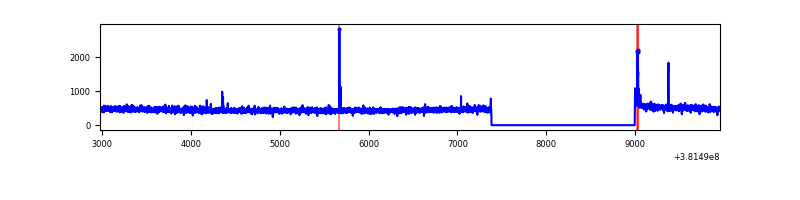 |
| B | 6973 | 5361 | 93 | 93 | 1.33% | 1.73% | 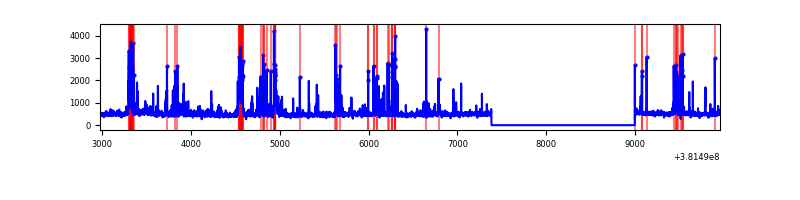 |
| C | 6973 | 5361 | 62 | 62 | 0.89% | 1.16% | 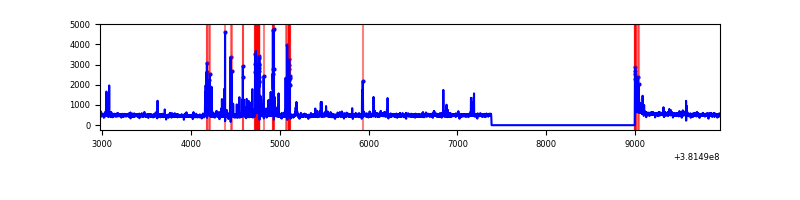 |
| D | 6973 | 5361 | 130 | 130 | 1.86% | 2.42% | 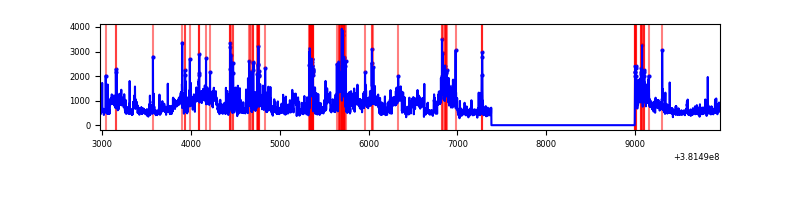 |
Top three noisy pixels from each quadrant. If the there are fewer than three noisy pixels in the level2.evt file, extra rows are filled as -1
| Pixel properties | Quadrant properties | ||||||
|---|---|---|---|---|---|---|---|
| Quadrant | DetID | PixID | Counts | Sigma | Mean | Median | Sigma |
| A | 9 | 143 | 24417 | 190.02 | 620 | 608 | 125.3 |
| A | 10 | 83 | 18936 | 146.28 | 620 | 608 | 125.3 |
| A | 13 | 6 | 8463 | 62.69 | 620 | 608 | 125.3 |
| B | 5 | 172 | 468361 | 3967.19 | 609 | 592 | 117.9 |
| B | 5 | 255 | 84448 | 711.19 | 609 | 592 | 117.9 |
| B | 4 | 251 | 69308 | 582.79 | 609 | 592 | 117.9 |
| C | 14 | 254 | 319167 | 2306.93 | 598 | 601 | 138.1 |
| C | 15 | 214 | 223818 | 1616.45 | 598 | 601 | 138.1 |
| C | 0 | 10 | 48013 | 343.34 | 598 | 601 | 138.1 |
| D | 8 | 195 | 1088252 | 7430.79 | 599 | 581 | 146.4 |
| D | 12 | 235 | 558336 | 3810.49 | 599 | 581 | 146.4 |
| D | 10 | 118 | 147097 | 1000.97 | 599 | 581 | 146.4 |
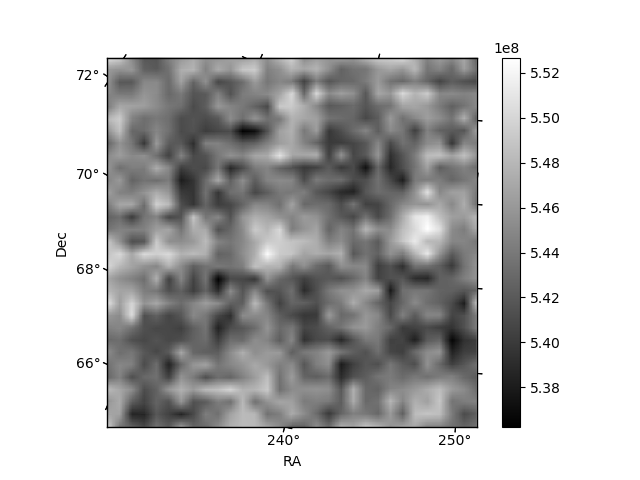
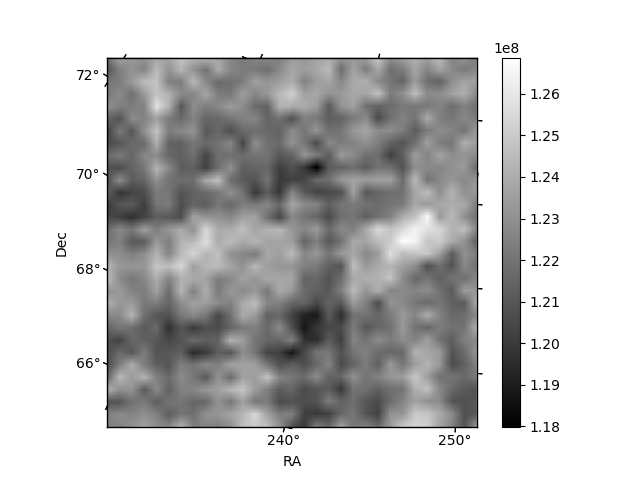
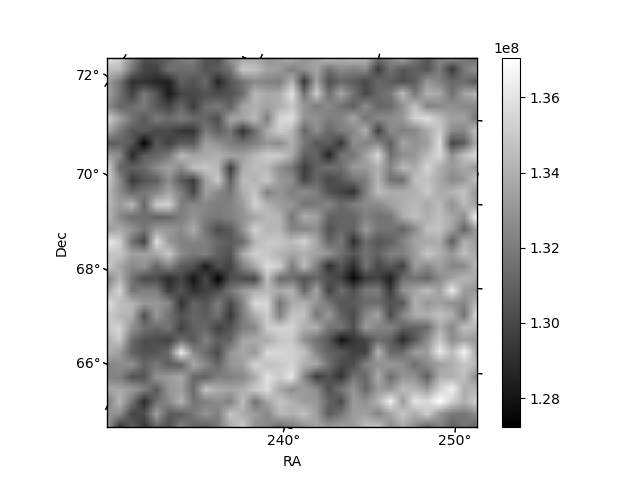
Histogram calculated using DETX and DETY for each event in the final _common_clean file
| Quadrant A | 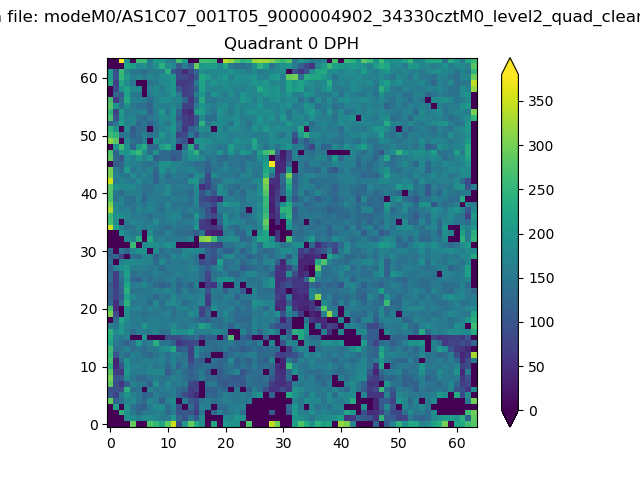 |
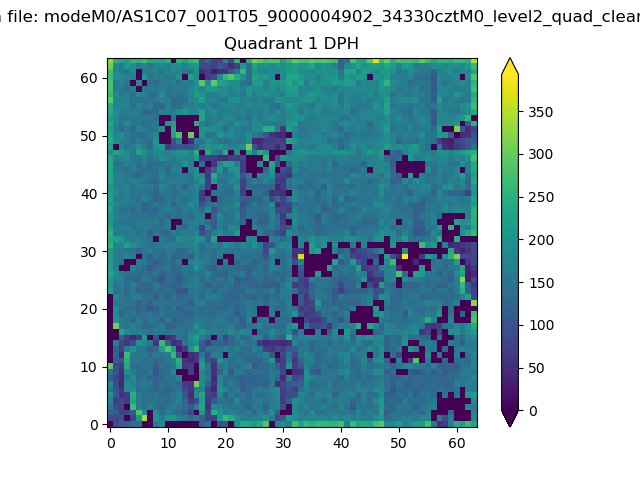 |
Quadrant B |
|---|---|---|---|
| Quadrant D | 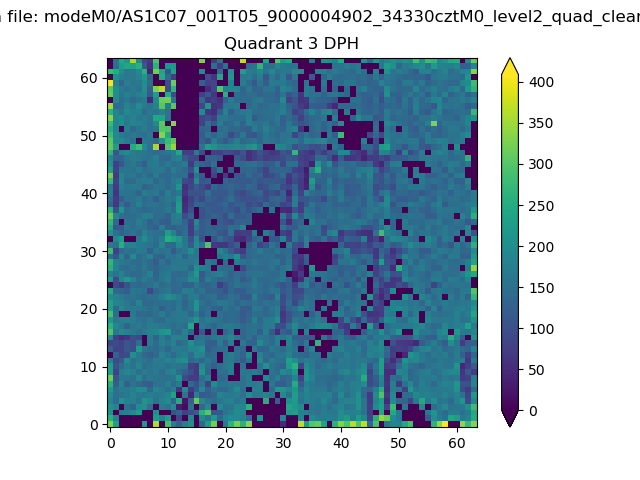 |
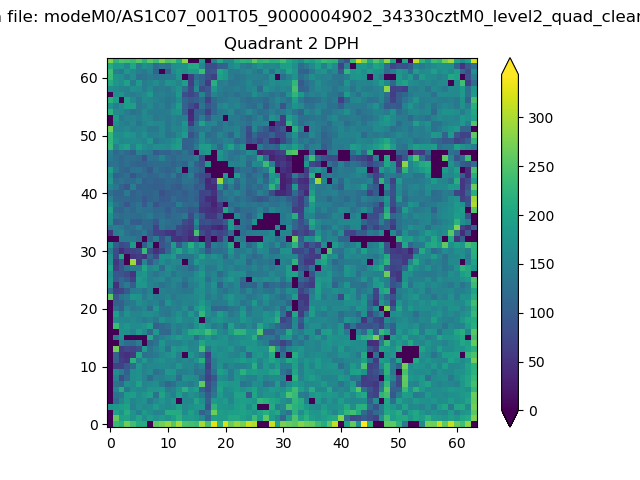 |
Quadrant C |
| Plot type | Count rate plots | Images |
|---|---|---|
| Comparison with Poisson distribution Blue bars denote a histogram of data divided into 1 sec bins. Red curve is a Poisson curve with rate = median count rate of data. |
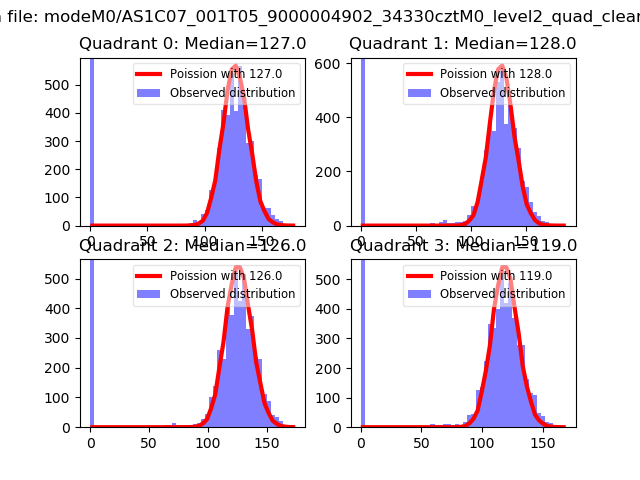 |
 |
| Quadrant-wise count rates Data is divided into 100 sec bins |
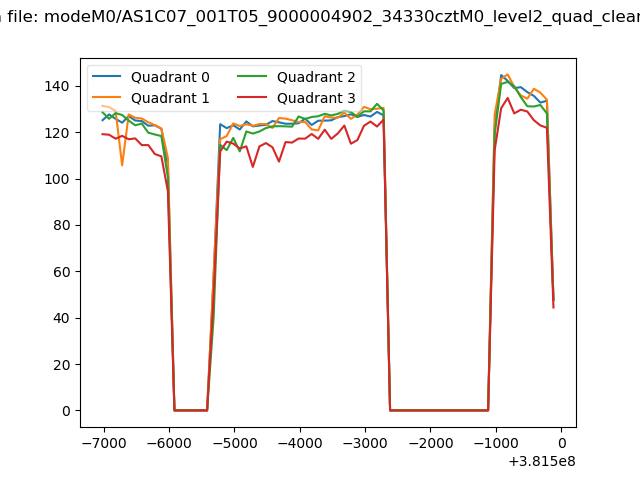 |
|
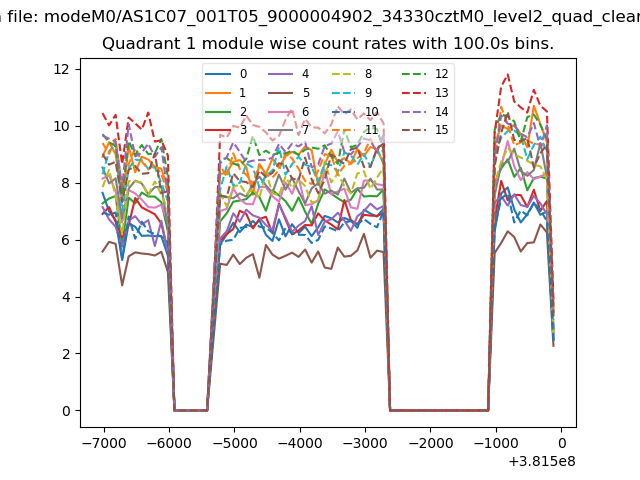
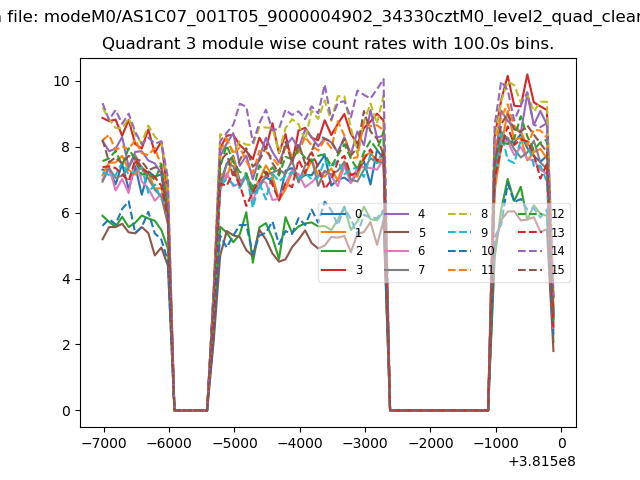
| Module-wise count rates for Quadrant A Data is divided into 100 sec bins |
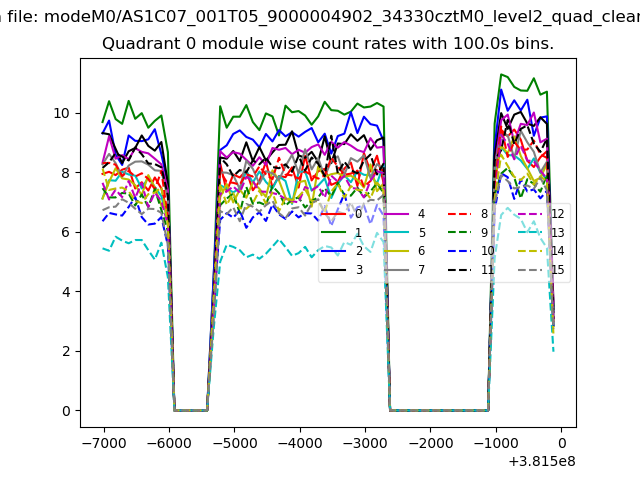 |
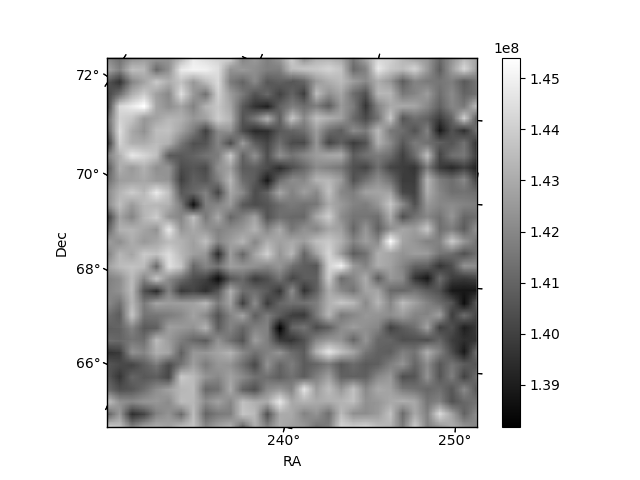 |
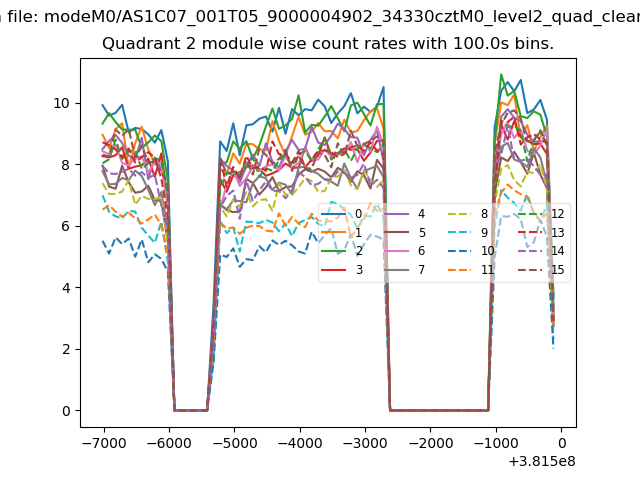
| Module-wise count rates for Quadrant B Data is divided into 100 sec bins |
 |
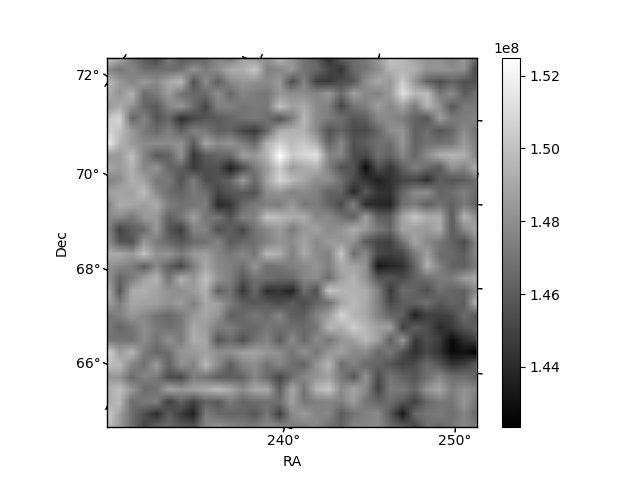 |
| Module-wise count rates for Quadrant C Data is divided into 100 sec bins |
 |
 |
| Module-wise count rates for Quadrant D Data is divided into 100 sec bins |
 |
 |
| Parameter | Plot |
|---|---|
| CZT HV Monitor |  |
| D_VDD | 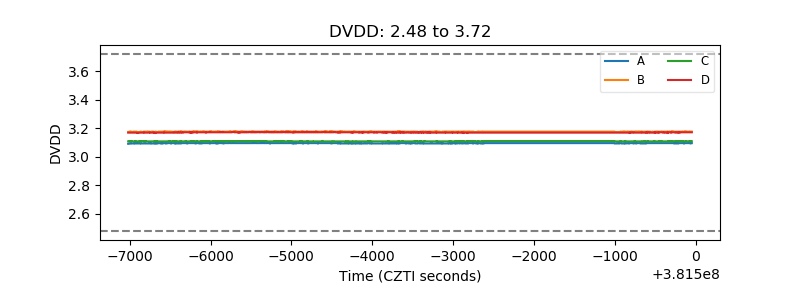 |
| Temperature 1 | 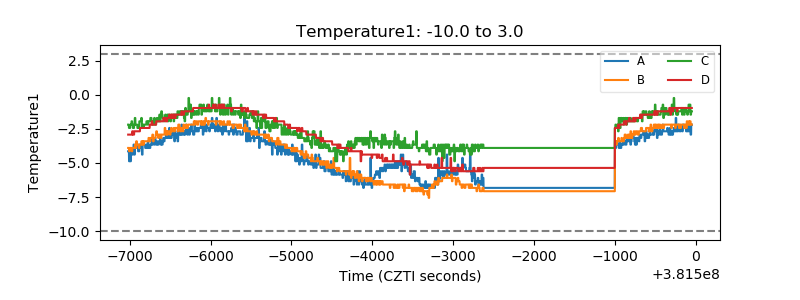 |
| Veto HV Monitor | 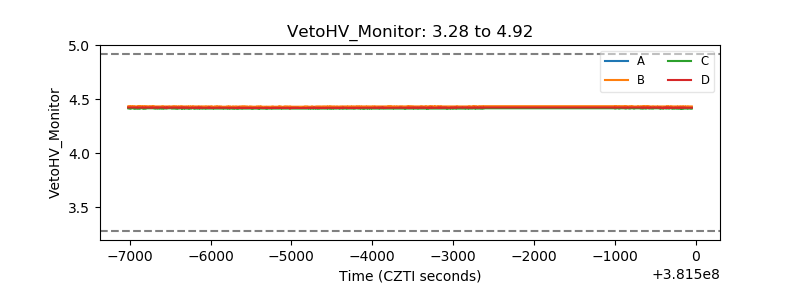 |
| Veto LLD | 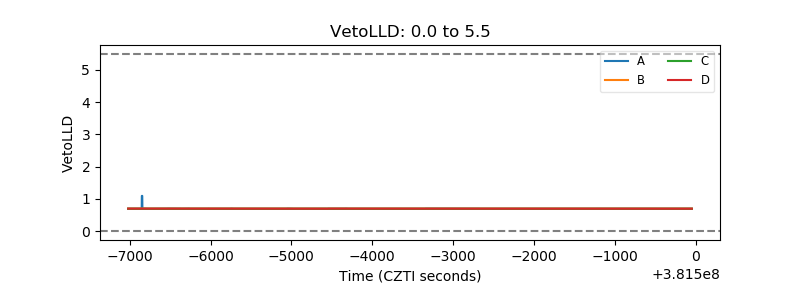 |
| Alpha Counter | 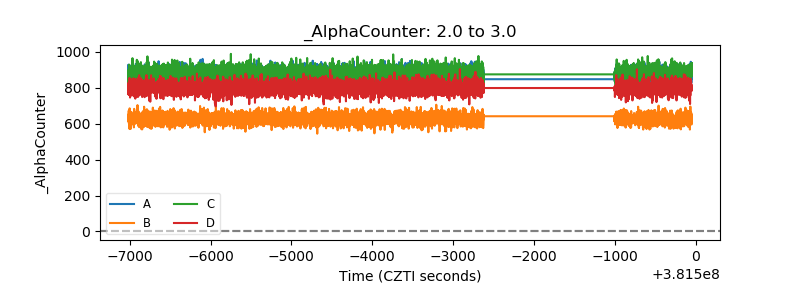 |
| _CPM_Rate | 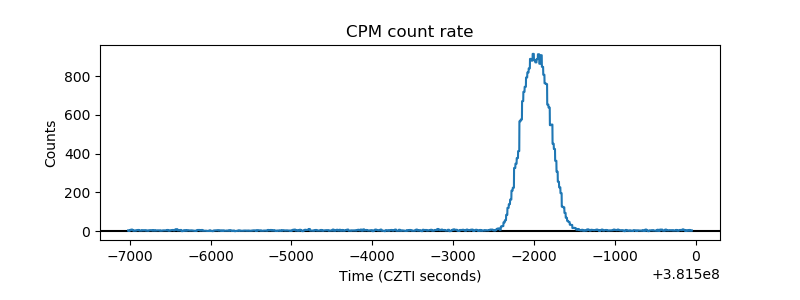 |
| CZT Counter | 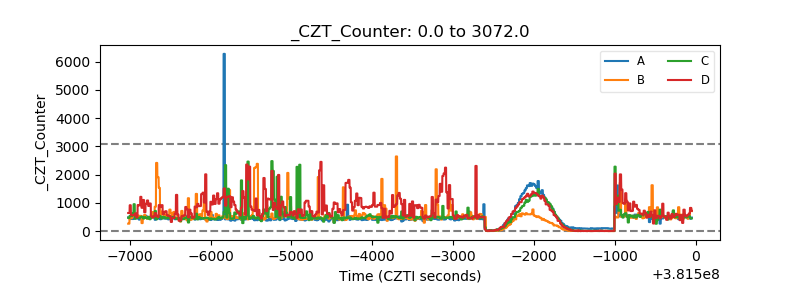 |
| +2.5 Volts monitor | 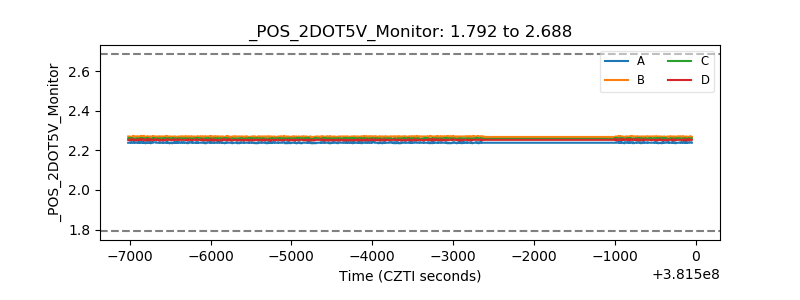 |
| +5 Volts monitor | 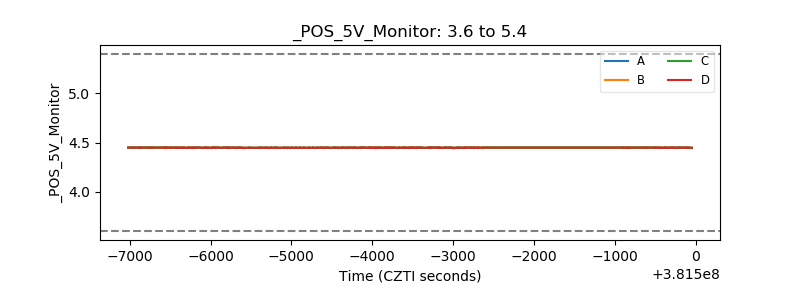 |
| _ROLL_ROT | 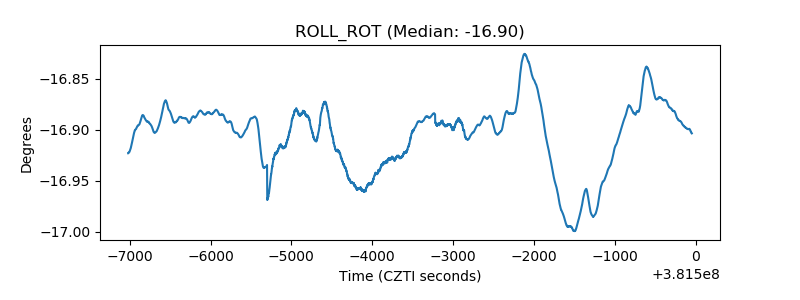 |
| _Roll_DEC | 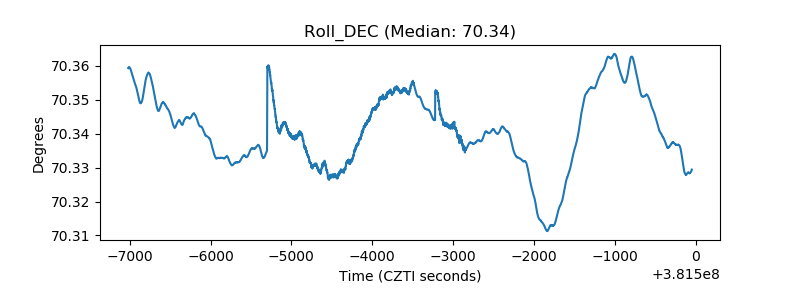 |
| _Roll_RA | 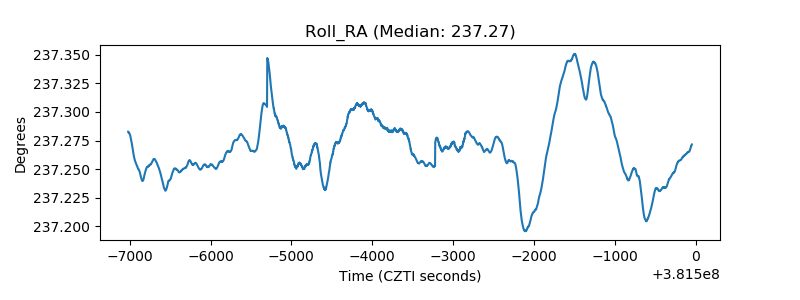 |
| Veto Counter | 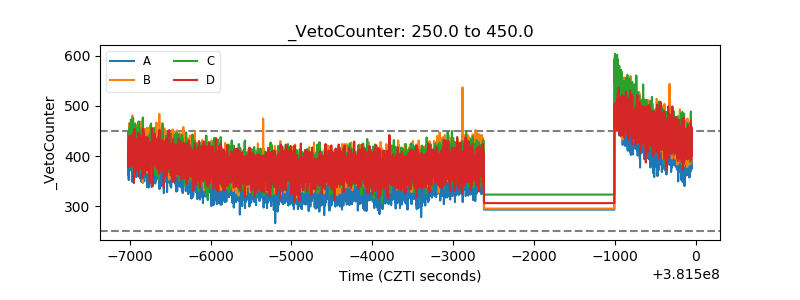 |