| Param | Original file | Final file |
|---|---|---|
| Filename | modeM0/AS1A05_084T04_9000004896_34316cztM0_level2.evt | modeM0/AS1A05_084T04_9000004896_34316cztM0_level2_quad_clean.evt |
| Size (bytes) | 611,665,920 | 79,220,160 |
| Size | 583.3 MB | 75.6 MB |
| Events in quadrant A | 2,659,885 | 532,730 |
| Events in quadrant B | 3,692,855 | 524,163 |
| Events in quadrant C | 2,839,422 | 528,009 |
| Events in quadrant D | 8,967,047 | 435,229 |
| Mode M9 | |||
|---|---|---|---|
| Quadrant | BADHDUFLAG | Total packets | Discarded packets |
| A | 0 | 17 | 0 |
| B | 0 | 17 | 0 |
| C | 0 | 17 | 0 |
| D | 0 | 18 | 0 |
| Mode SS | |||
|---|---|---|---|
| Quadrant | BADHDUFLAG | Total packets | Discarded packets |
| A | 0 | 110 | 0 |
| B | 0 | 110 | 0 |
| C | 0 | 110 | 0 |
| D | 0 | 110 | 0 |
| Mode M0 | |||
|---|---|---|---|
| Quadrant | BADHDUFLAG | Total packets | Discarded packets |
| A | 0 | 11463 | 3 |
| B | 0 | 14524 | 2 |
| C | 0 | 11670 | 2 |
| D | 0 | 30423 | 2 |
| Quadrant | Total seconds | Saturated seconds | Saturation percentage |
|---|---|---|---|
| A | 5402 | 33 | 0.610885% |
| B | 5402 | 150 | 2.776749% |
| C | 5402 | 27 | 0.499815% |
| D | 5402 | 1720 | 31.840059% |
Noise dominated data is calculated using 1-second bins in cleaned event files. If a bin has >2000 counts, and if more than 50% of those come from <1% of pixels, then it is considered to be noise-dominated and hence unusable.
| Quadrant | # 1 sec bins | Bins with >0 counts | Bins with >2000 counts | High rate bins dominated by noise | Noise dominated (total time) | Noise dominated (detector-on time) | Marked lightcurve |
|---|---|---|---|---|---|---|---|
| A | 7076 | 5403 | 20 | 20 | 0.28% | 0.37% | 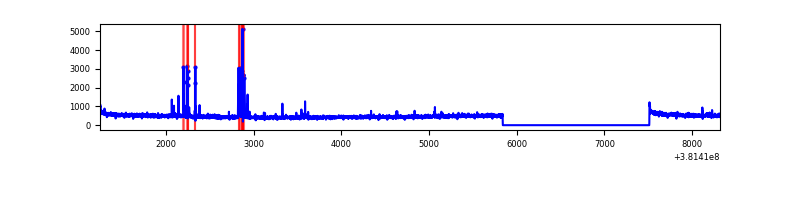 |
| B | 7076 | 5403 | 92 | 92 | 1.30% | 1.70% | 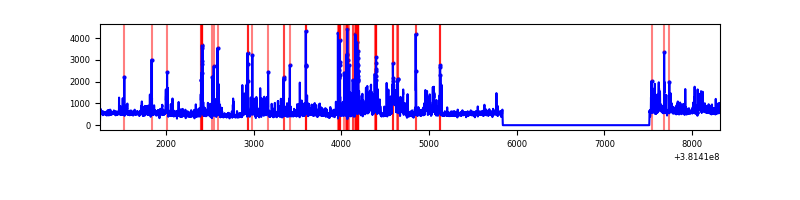 |
| C | 7076 | 5403 | 18 | 18 | 0.25% | 0.33% | 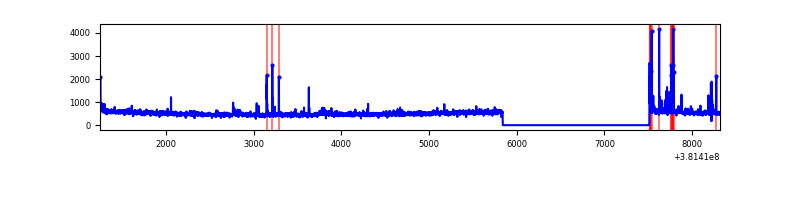 |
| D | 7076 | 5403 | 1656 | 1656 | 23.40% | 30.65% | 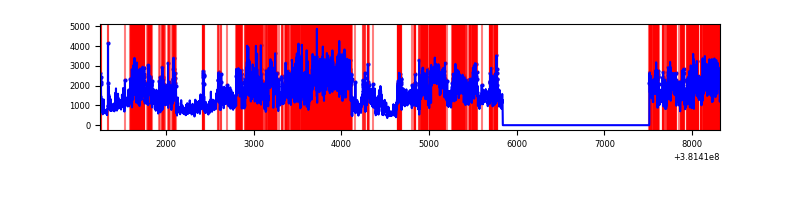 |
Top three noisy pixels from each quadrant. If the there are fewer than three noisy pixels in the level2.evt file, extra rows are filled as -1
| Pixel properties | Quadrant properties | ||||||
|---|---|---|---|---|---|---|---|
| Quadrant | DetID | PixID | Counts | Sigma | Mean | Median | Sigma |
| A | 9 | 143 | 120140 | 913.47 | 645 | 630 | 130.8 |
| A | 10 | 83 | 30362 | 227.26 | 645 | 630 | 130.8 |
| A | 13 | 6 | 11807 | 85.43 | 645 | 630 | 130.8 |
| B | 5 | 172 | 296780 | 2433.83 | 636 | 622 | 121.7 |
| B | 5 | 31 | 282289 | 2314.75 | 636 | 622 | 121.7 |
| B | 0 | 229 | 201287 | 1649.07 | 636 | 622 | 121.7 |
| C | 15 | 214 | 231516 | 1596.42 | 623 | 628 | 144.6 |
| C | 14 | 254 | 76412 | 523.99 | 623 | 628 | 144.6 |
| C | 0 | 10 | 36033 | 244.8 | 623 | 628 | 144.6 |
| D | 12 | 227 | 3766703 | 24593.0 | 565 | 554 | 153.1 |
| D | 8 | 195 | 729604 | 4760.71 | 565 | 554 | 153.1 |
| D | 12 | 235 | 719374 | 4693.9 | 565 | 554 | 153.1 |
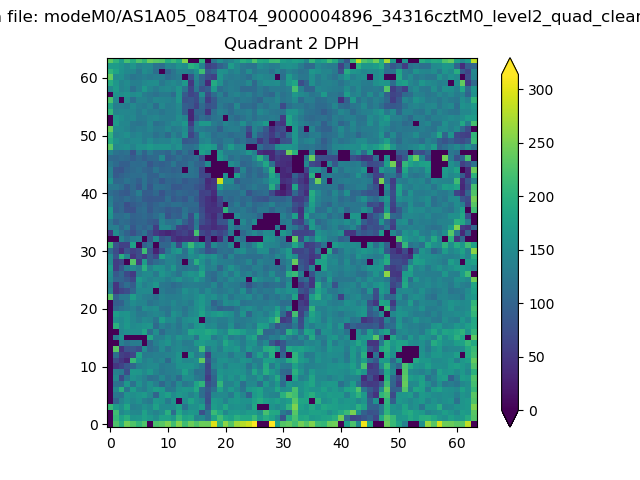
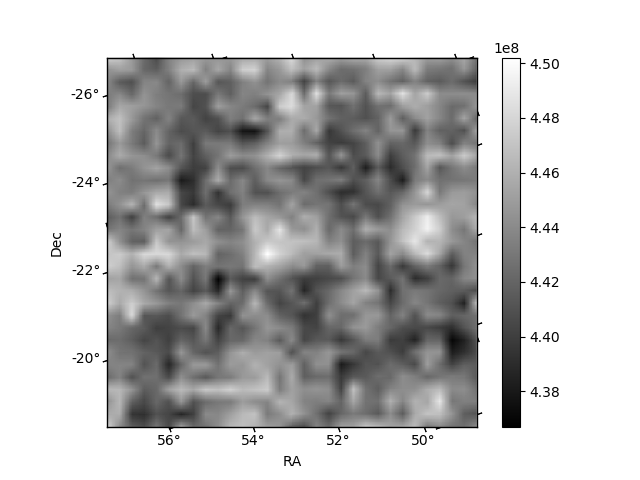
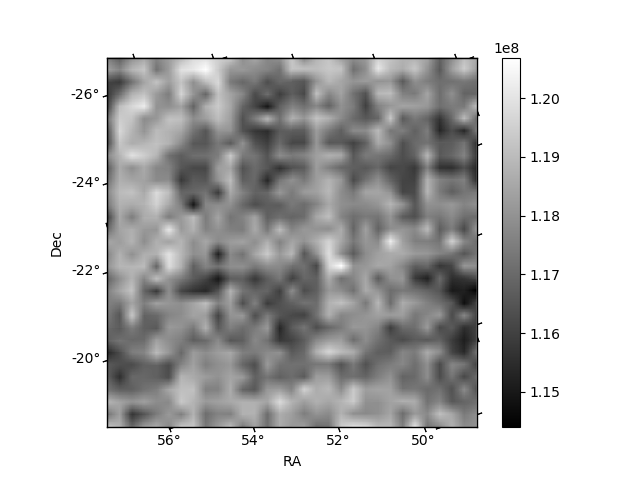
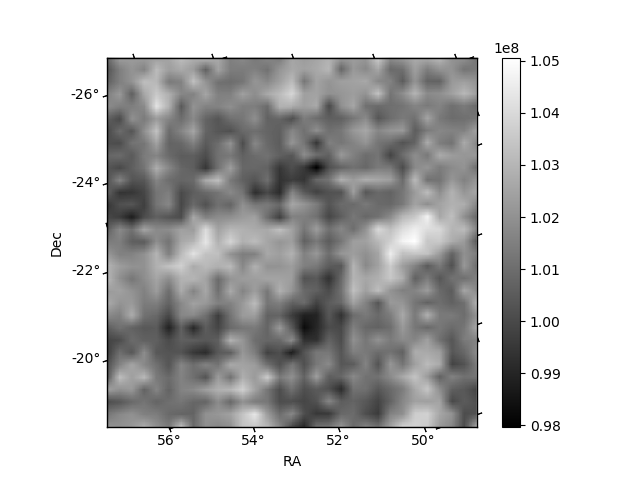
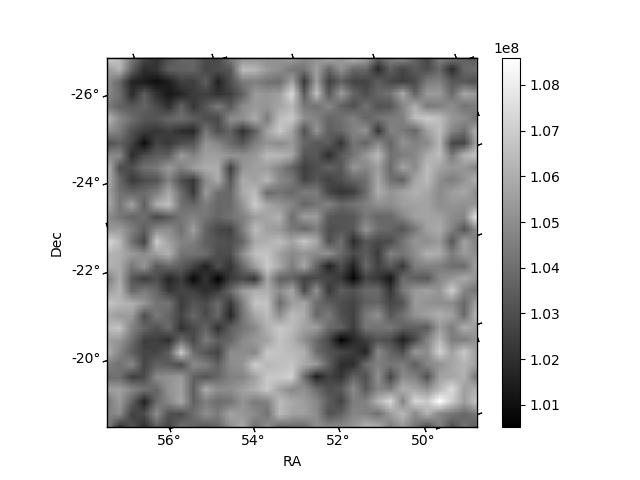
Histogram calculated using DETX and DETY for each event in the final _common_clean file
| Quadrant A | 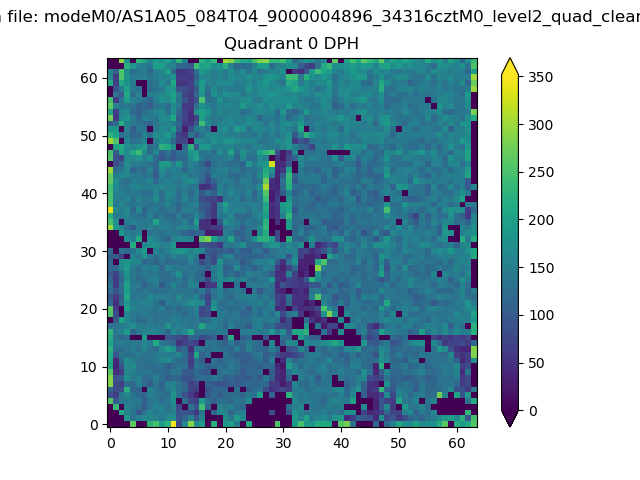 |
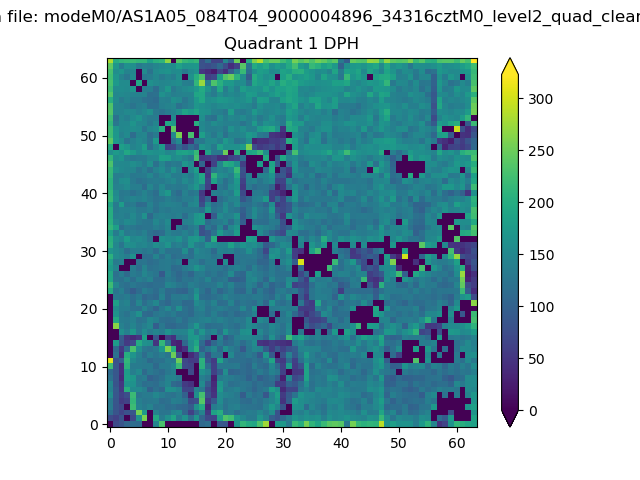 |
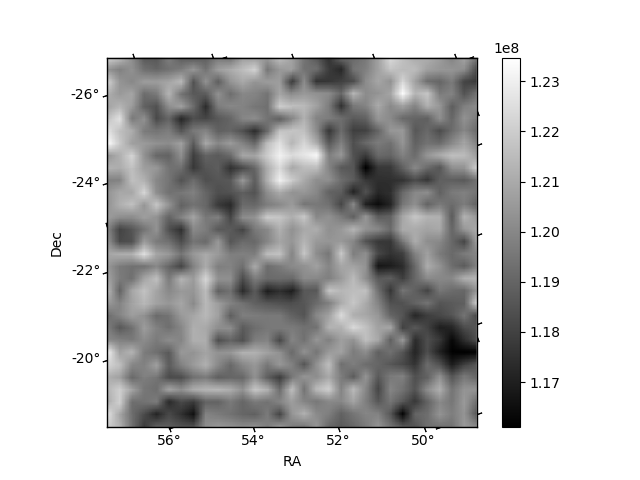
Quadrant B |
|---|---|---|---|
| Quadrant D | 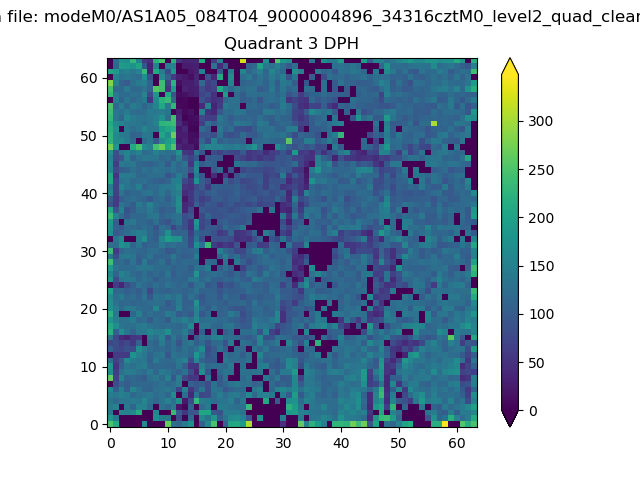 |
 |
Quadrant C |
| Plot type | Count rate plots | Images |
|---|---|---|
| Comparison with Poisson distribution Blue bars denote a histogram of data divided into 1 sec bins. Red curve is a Poisson curve with rate = median count rate of data. |
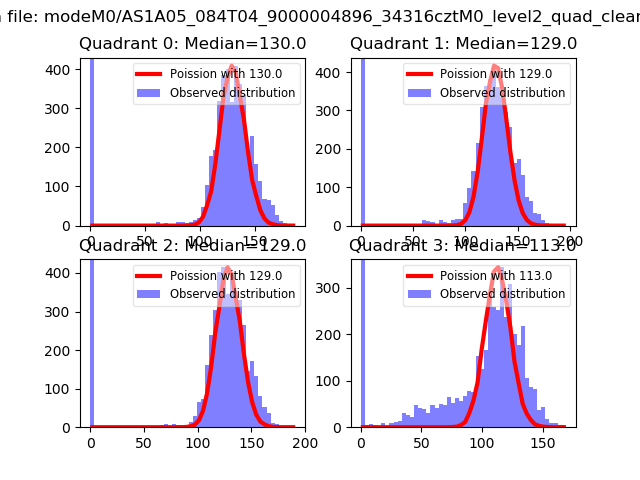 |
 |
| Quadrant-wise count rates Data is divided into 100 sec bins |
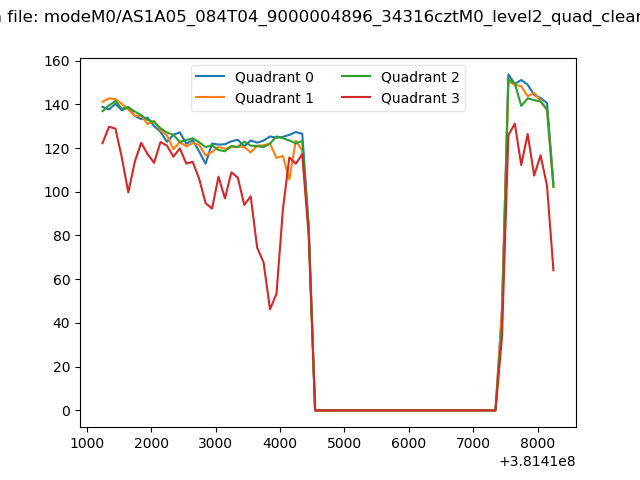 |
|
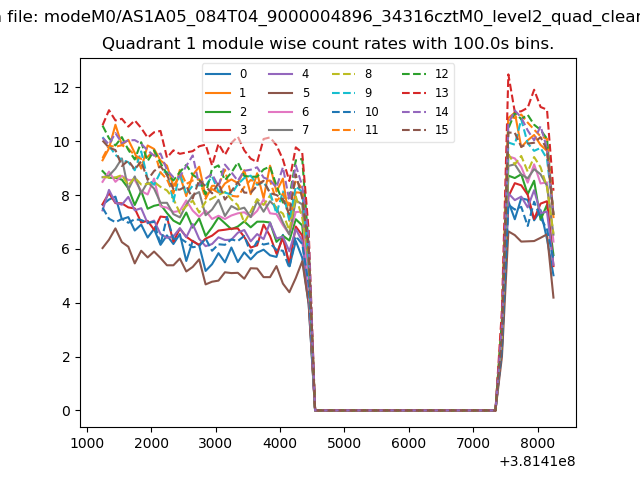
| Module-wise count rates for Quadrant A Data is divided into 100 sec bins |
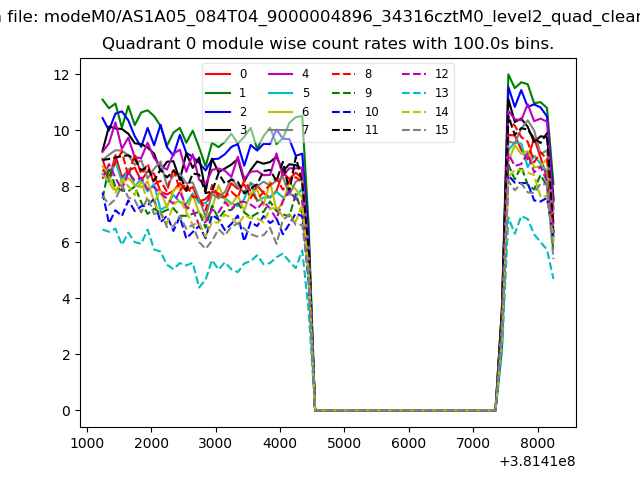 |
 |
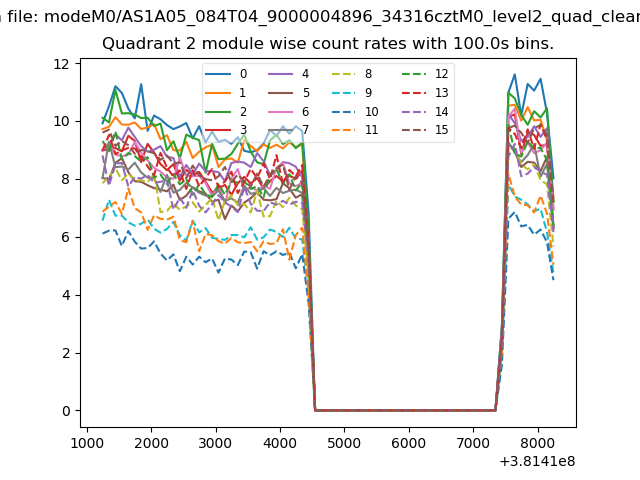
| Module-wise count rates for Quadrant B Data is divided into 100 sec bins |
 |
 |
| Module-wise count rates for Quadrant C Data is divided into 100 sec bins |
 |
 |
| Module-wise count rates for Quadrant D Data is divided into 100 sec bins |
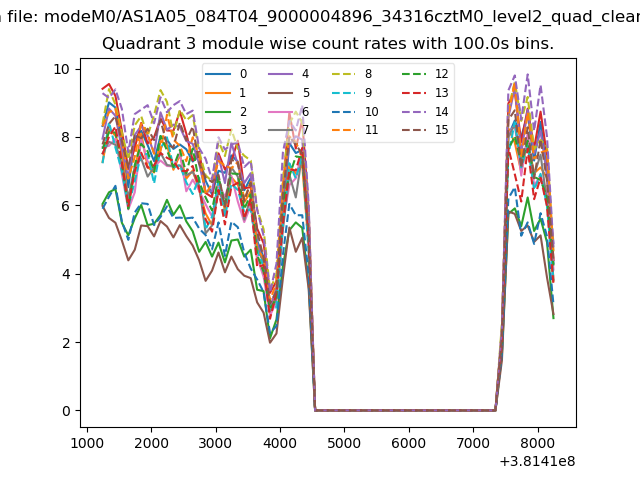 |
 |
| Parameter | Plot |
|---|---|
| CZT HV Monitor | 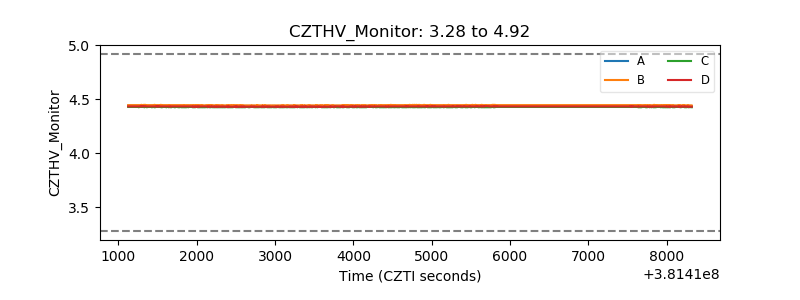 |
| D_VDD | 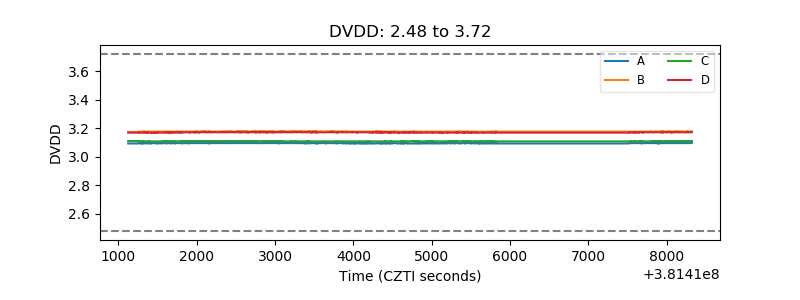 |
| Temperature 1 | 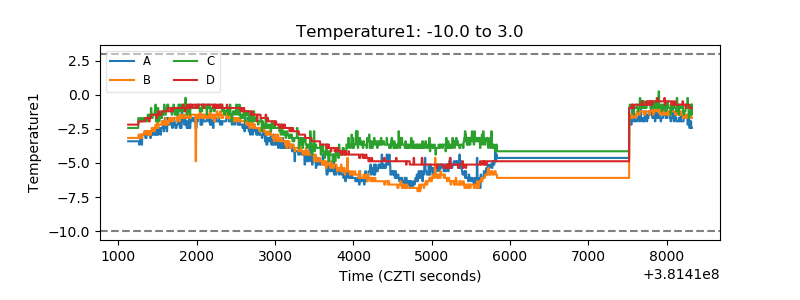 |
| Veto HV Monitor | 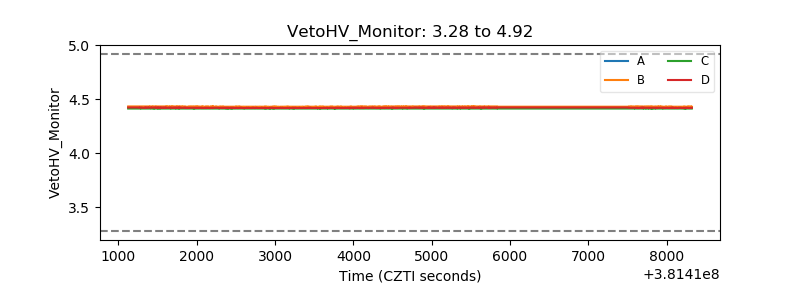 |
| Veto LLD | 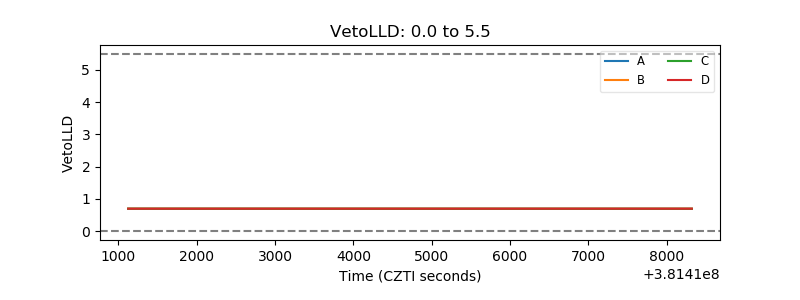 |
| Alpha Counter | 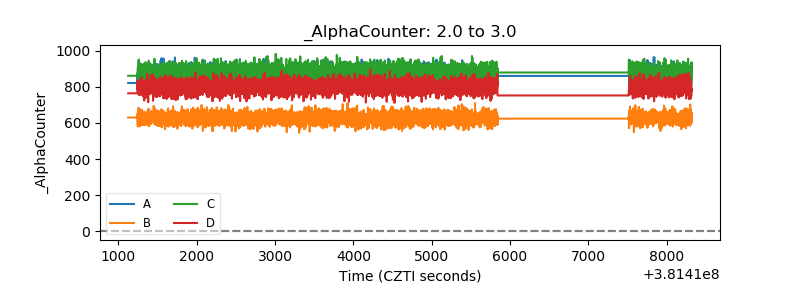 |
| _CPM_Rate | 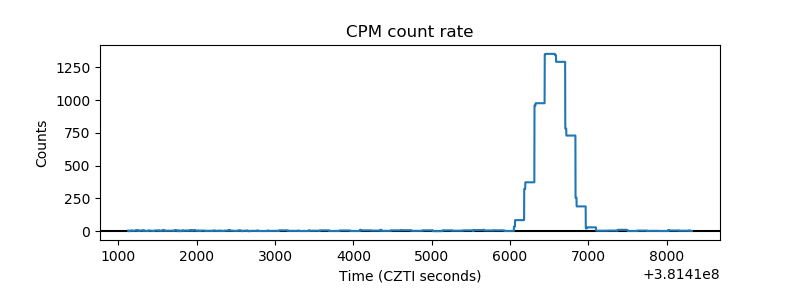 |
| CZT Counter | 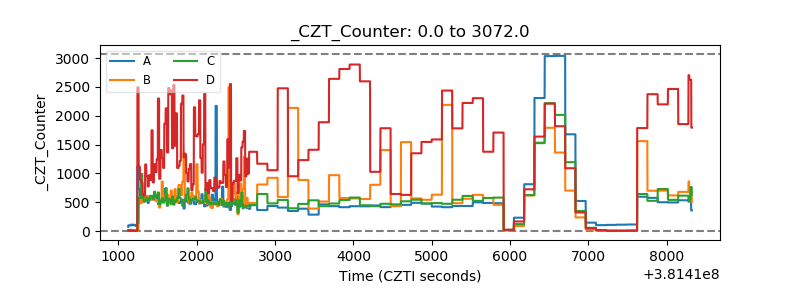 |
| +2.5 Volts monitor | 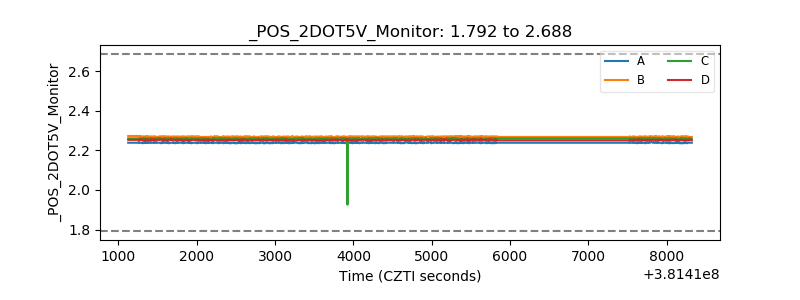 |
| +5 Volts monitor | 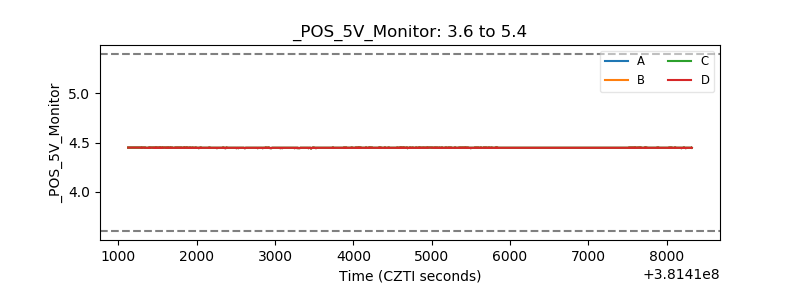 |
| _ROLL_ROT | 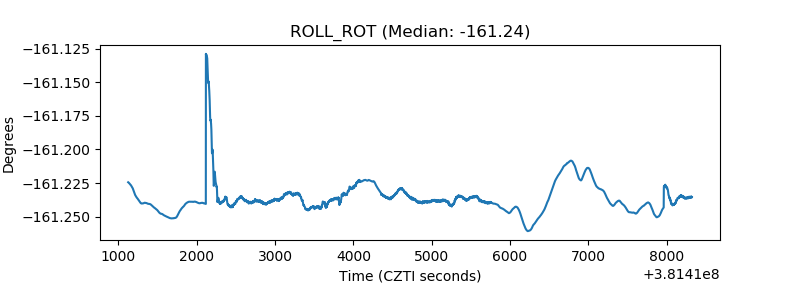 |
| _Roll_DEC | 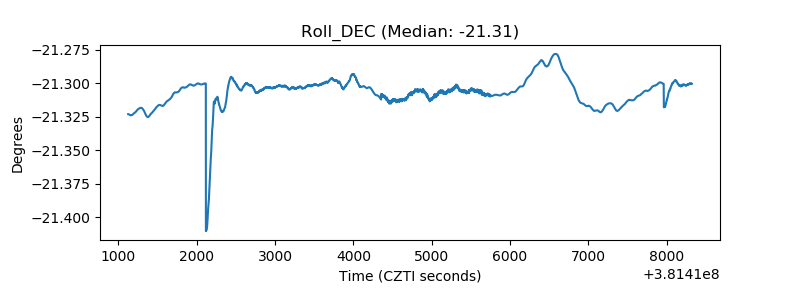 |
| _Roll_RA | 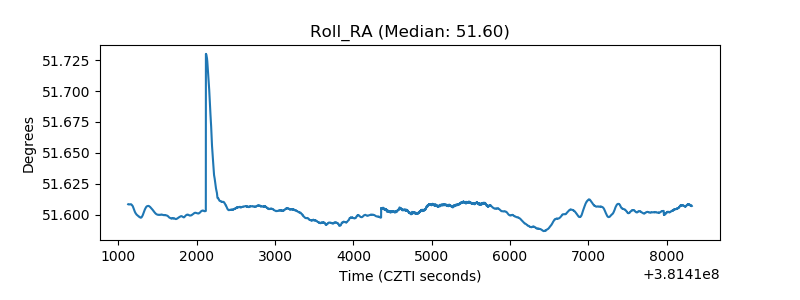 |
| Veto Counter | 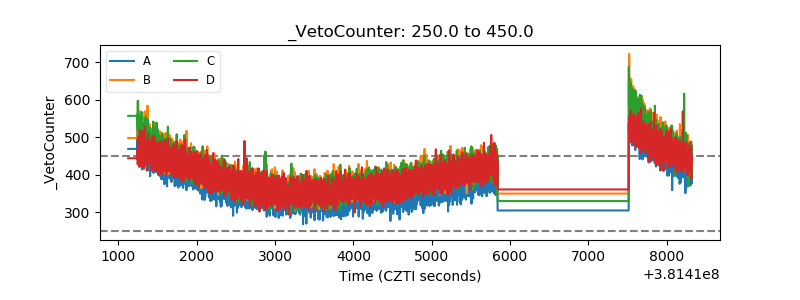 |