| Param | Original file | Final file |
|---|---|---|
| Filename | modeM0/AS1A05_082T08_9000004900_34326cztM0_level2.evt | modeM0/AS1A05_082T08_9000004900_34326cztM0_level2_quad_clean.evt |
| Size (bytes) | 444,749,760 | 52,254,720 |
| Size | 424.1 MB | 49.8 MB |
| Events in quadrant A | 2,208,596 | 317,857 |
| Events in quadrant B | 3,230,809 | 304,768 |
| Events in quadrant C | 2,693,689 | 320,587 |
| Events in quadrant D | 5,009,348 | 300,484 |
| Mode M9 | |||
|---|---|---|---|
| Quadrant | BADHDUFLAG | Total packets | Discarded packets |
| A | 0 | 9 | 0 |
| B | 0 | 9 | 0 |
| C | 0 | 9 | 0 |
| D | 0 | 10 | 0 |
| Mode SS | |||
|---|---|---|---|
| Quadrant | BADHDUFLAG | Total packets | Discarded packets |
| A | 0 | 96 | 0 |
| B | 0 | 96 | 0 |
| C | 0 | 96 | 0 |
| D | 0 | 96 | 0 |
| Mode M0 | |||
|---|---|---|---|
| Quadrant | BADHDUFLAG | Total packets | Discarded packets |
| A | 0 | 9685 | 1 |
| B | 0 | 12712 | 1 |
| C | 0 | 10889 | 1 |
| D | 0 | 18313 | 1 |
| Quadrant | Total seconds | Saturated seconds | Saturation percentage |
|---|---|---|---|
| A | 4816 | 4 | 0.083056% |
| B | 4816 | 319 | 6.623754% |
| C | 4816 | 43 | 0.892857% |
| D | 4816 | 487 | 10.112126% |
Noise dominated data is calculated using 1-second bins in cleaned event files. If a bin has >2000 counts, and if more than 50% of those come from <1% of pixels, then it is considered to be noise-dominated and hence unusable.
| Quadrant | # 1 sec bins | Bins with >0 counts | Bins with >2000 counts | High rate bins dominated by noise | Noise dominated (total time) | Noise dominated (detector-on time) | Marked lightcurve |
|---|---|---|---|---|---|---|---|
| A | 4816 | 4816 | 0 | 0 | 0.00% | 0.00% | 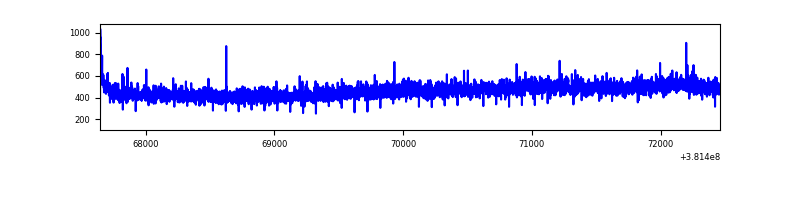 |
| B | 4816 | 4816 | 196 | 196 | 4.07% | 4.07% | 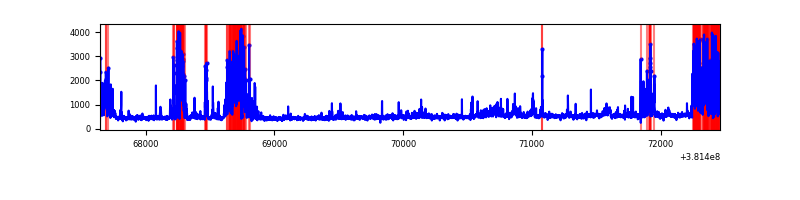 |
| C | 4816 | 4816 | 33 | 33 | 0.69% | 0.69% | 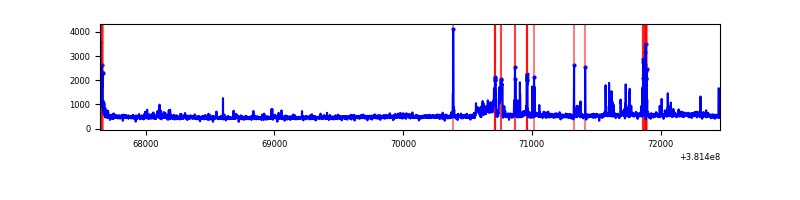 |
| D | 4816 | 4816 | 356 | 356 | 7.39% | 7.39% | 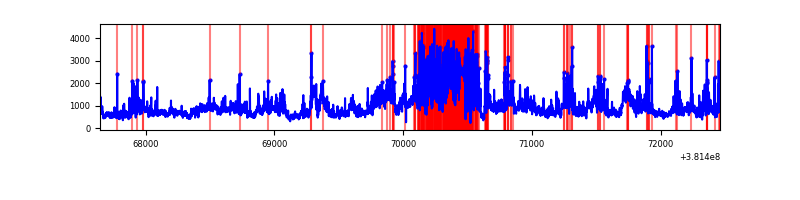 |
Top three noisy pixels from each quadrant. If the there are fewer than three noisy pixels in the level2.evt file, extra rows are filled as -1
| Pixel properties | Quadrant properties | ||||||
|---|---|---|---|---|---|---|---|
| Quadrant | DetID | PixID | Counts | Sigma | Mean | Median | Sigma |
| A | 10 | 83 | 17448 | 144.75 | 565 | 554 | 116.7 |
| A | 13 | 6 | 7849 | 62.5 | 565 | 554 | 116.7 |
| A | 13 | 254 | 7399 | 58.65 | 565 | 554 | 116.7 |
| B | 5 | 172 | 600425 | 5606.19 | 547 | 533 | 107.0 |
| B | 3 | 32 | 296494 | 2765.85 | 547 | 533 | 107.0 |
| B | 4 | 251 | 72505 | 672.6 | 547 | 533 | 107.0 |
| C | 15 | 214 | 200970 | 1554.69 | 551 | 556 | 128.9 |
| C | 14 | 254 | 151064 | 1167.55 | 551 | 556 | 128.9 |
| C | 8 | 222 | 95233 | 734.45 | 551 | 556 | 128.9 |
| D | 12 | 235 | 1145651 | 8352.9 | 527 | 511 | 137.1 |
| D | 10 | 118 | 736788 | 5370.56 | 527 | 511 | 137.1 |
| D | 8 | 195 | 707498 | 5156.92 | 527 | 511 | 137.1 |
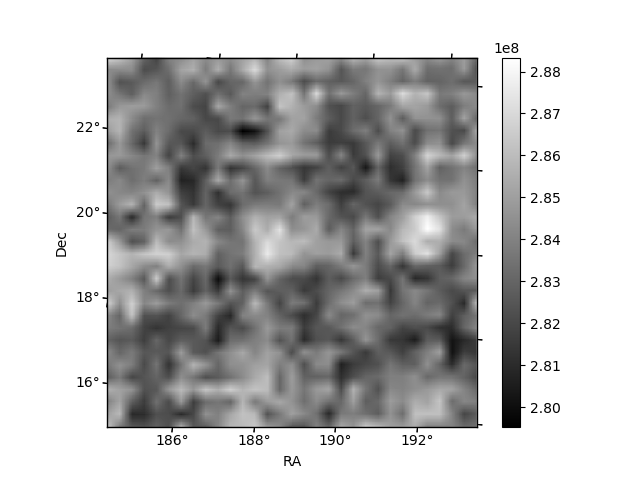
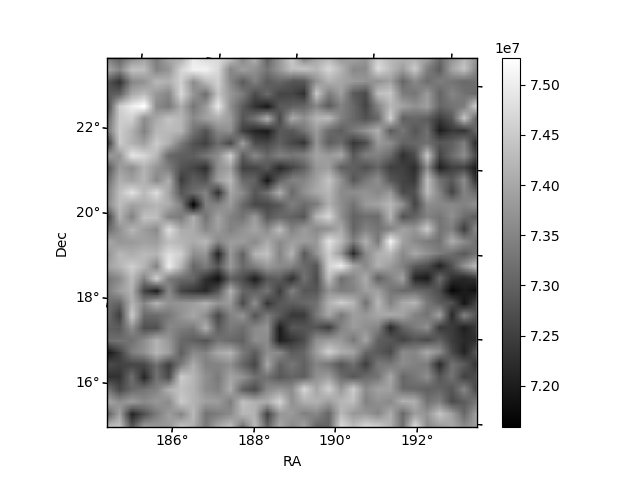
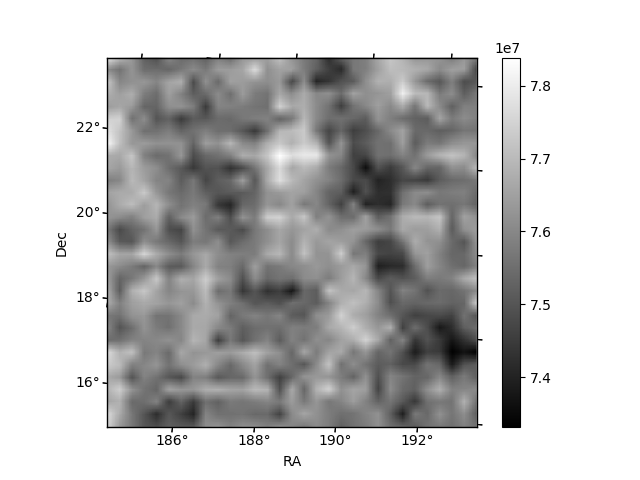
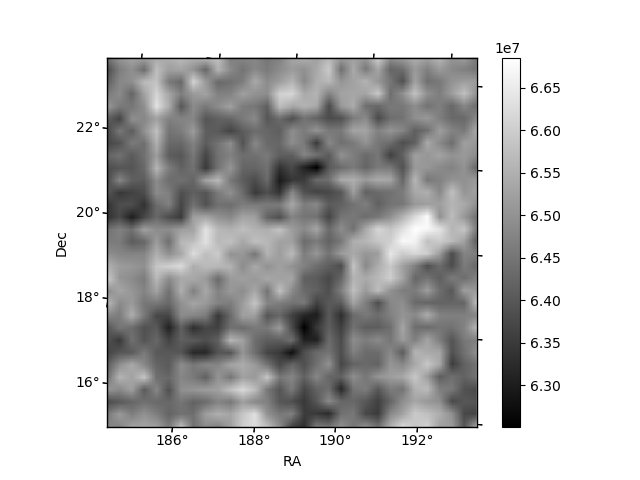
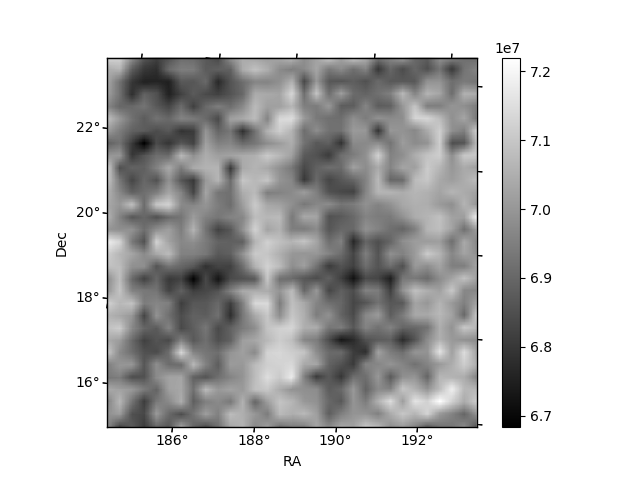
Histogram calculated using DETX and DETY for each event in the final _common_clean file
| Quadrant A | 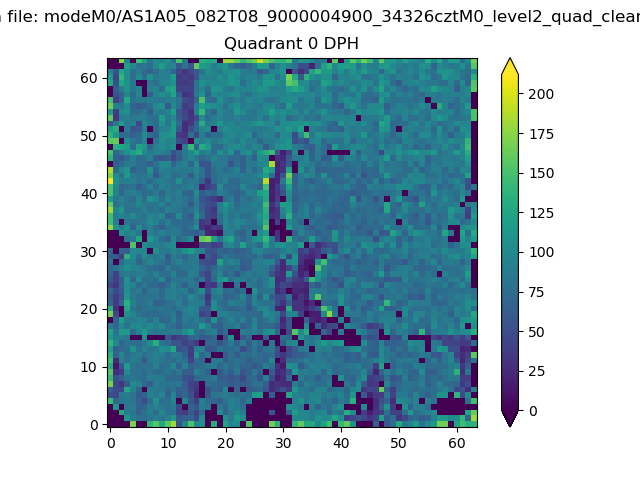 |
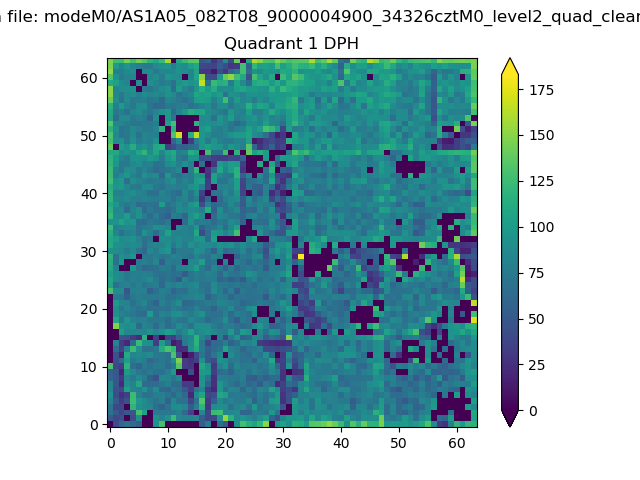 |
Quadrant B |
|---|---|---|---|
| Quadrant D | 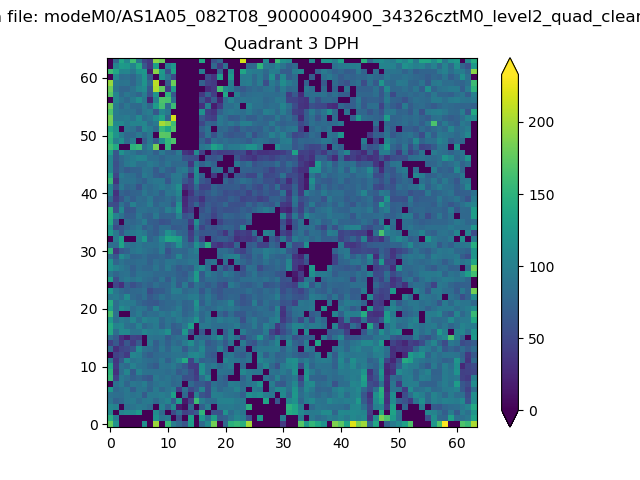 |
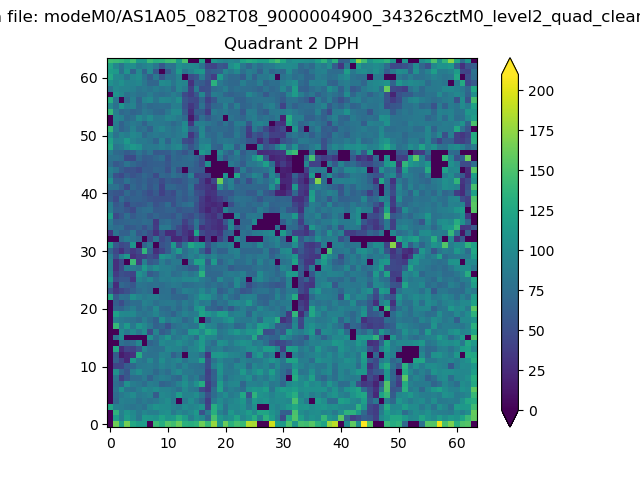 |
Quadrant C |
| Plot type | Count rate plots | Images |
|---|---|---|
| Comparison with Poisson distribution Blue bars denote a histogram of data divided into 1 sec bins. Red curve is a Poisson curve with rate = median count rate of data. |
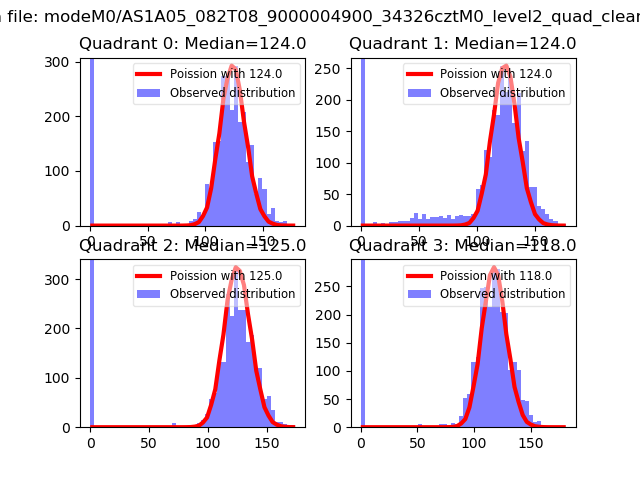 |
 |
| Quadrant-wise count rates Data is divided into 100 sec bins |
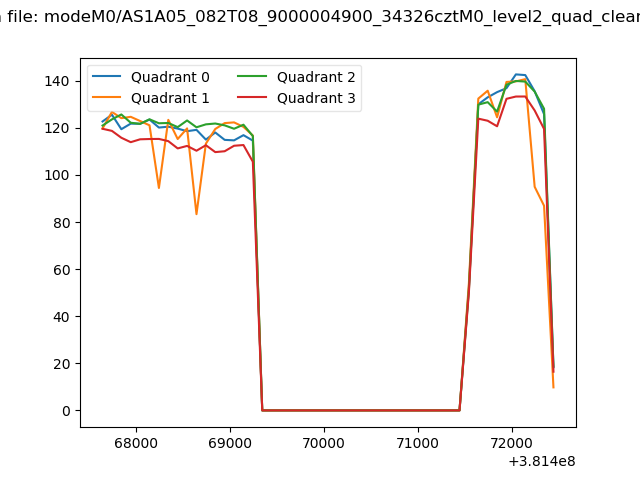 |
|
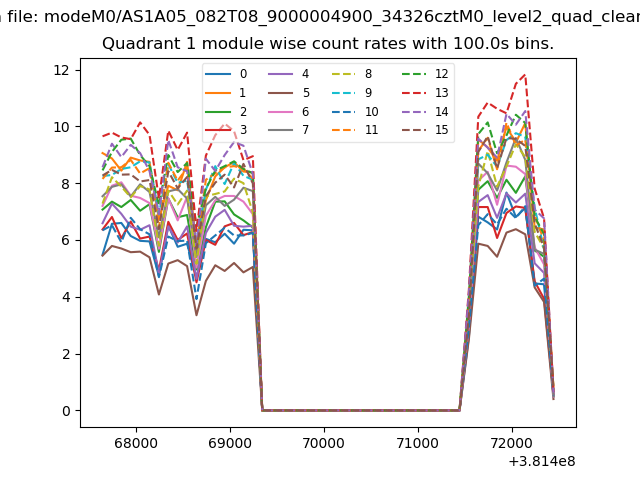
| Module-wise count rates for Quadrant A Data is divided into 100 sec bins |
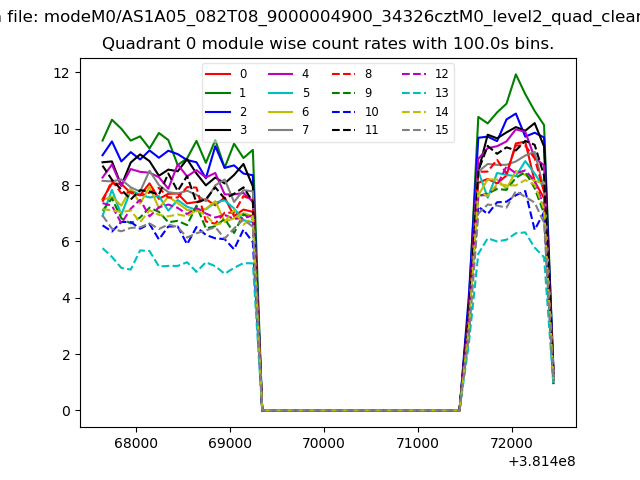 |
 |
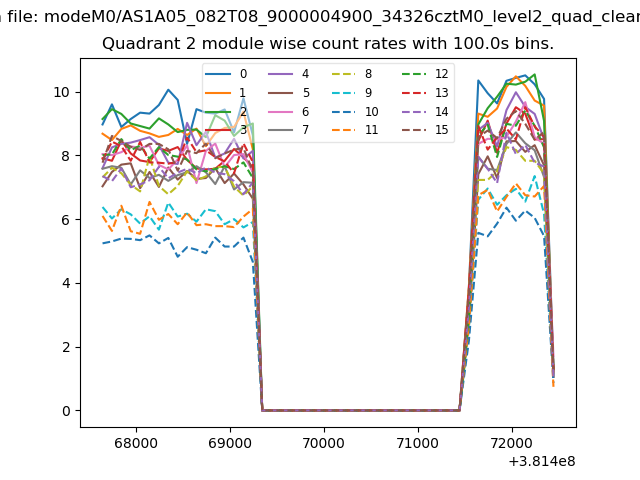
| Module-wise count rates for Quadrant B Data is divided into 100 sec bins |
 |
 |
| Module-wise count rates for Quadrant C Data is divided into 100 sec bins |
 |
 |
| Module-wise count rates for Quadrant D Data is divided into 100 sec bins |
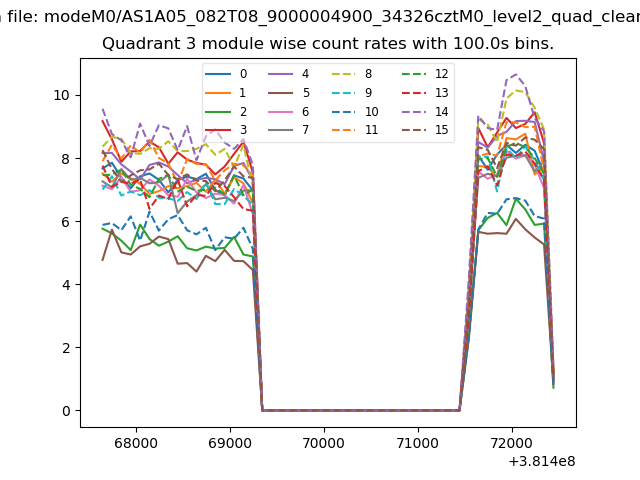 |
 |
| Parameter | Plot |
|---|---|
| CZT HV Monitor | 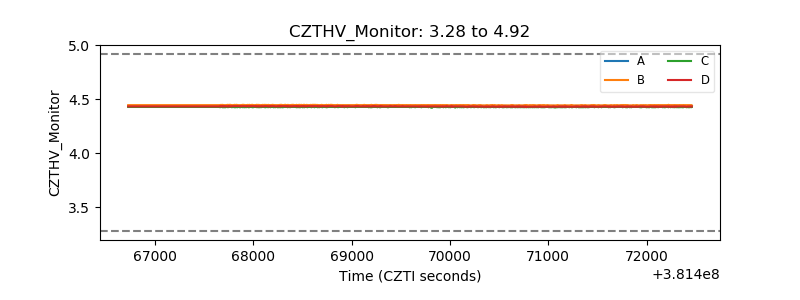 |
| D_VDD | 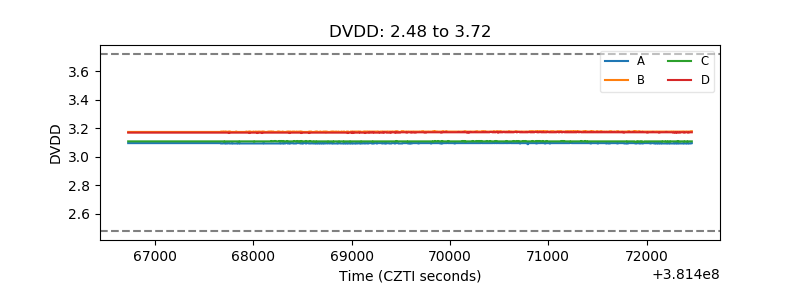 |
| Temperature 1 | 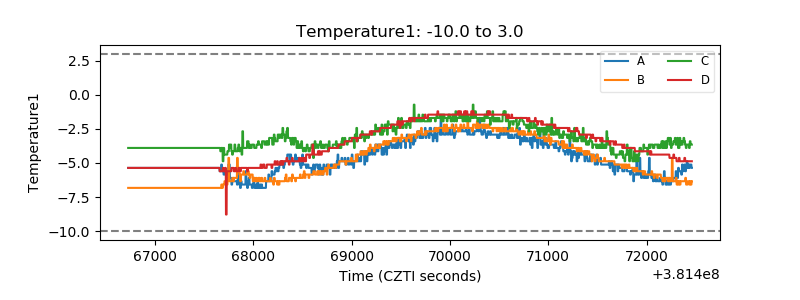 |
| Veto HV Monitor | 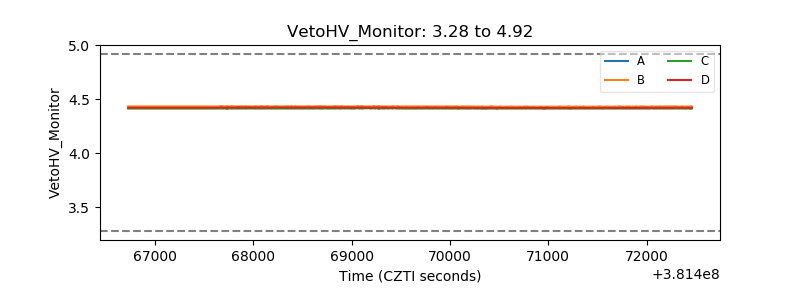 |
| Veto LLD | 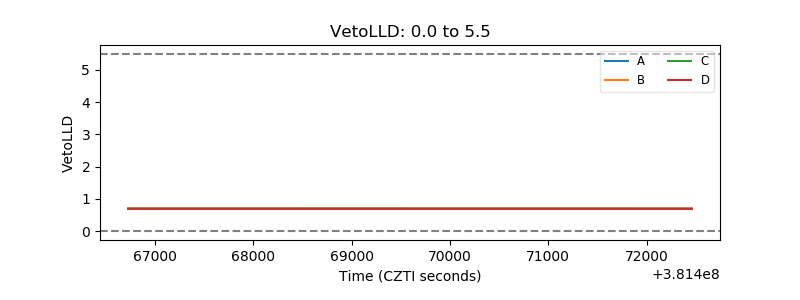 |
| Alpha Counter | 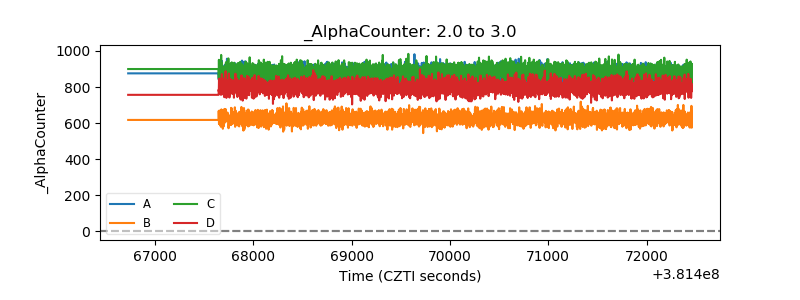 |
| _CPM_Rate | 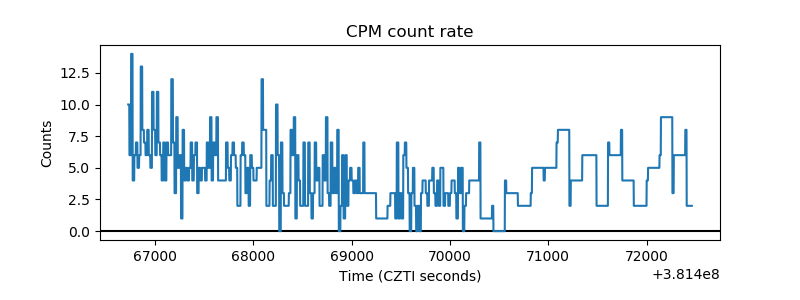 |
| CZT Counter | 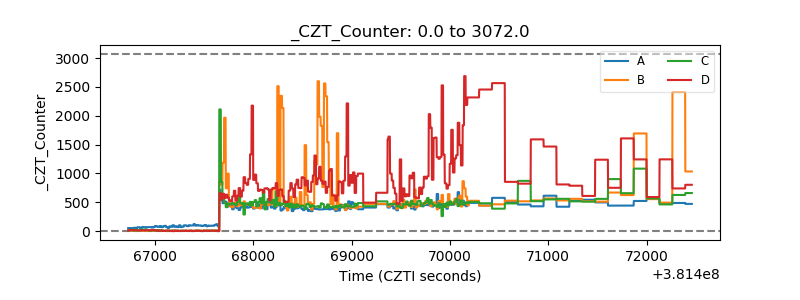 |
| +2.5 Volts monitor | 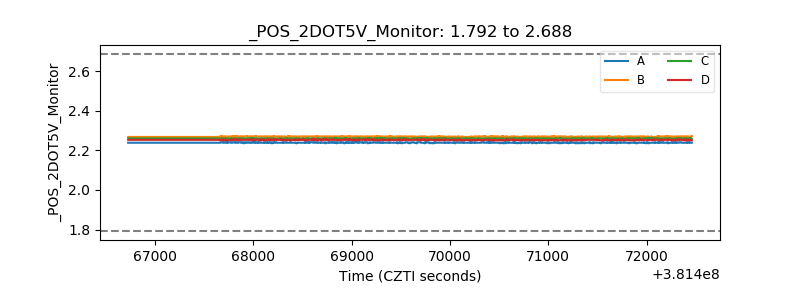 |
| +5 Volts monitor | 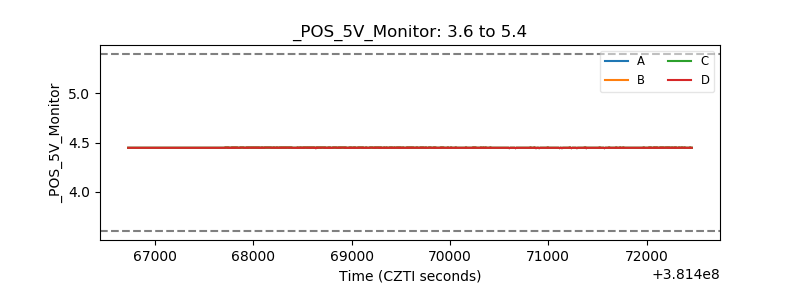 |
| _ROLL_ROT | 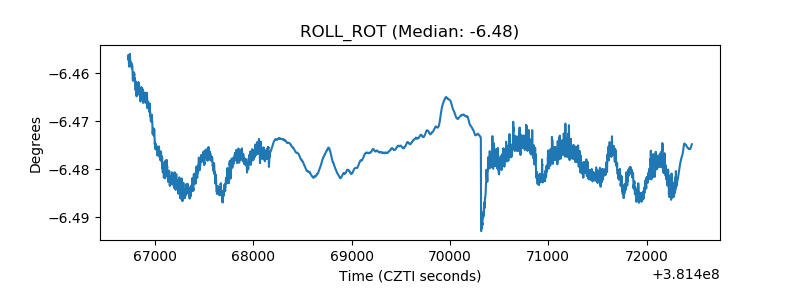 |
| _Roll_DEC | 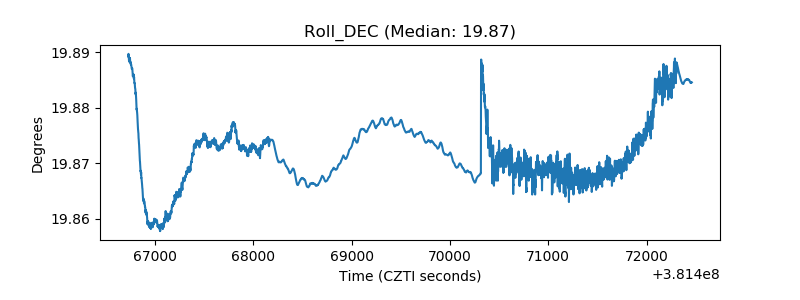 |
| _Roll_RA | 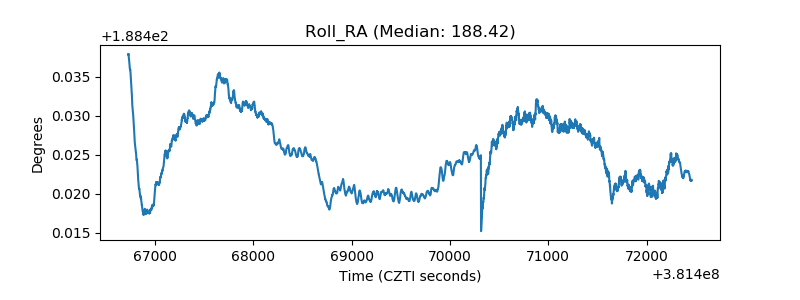 |
| Veto Counter | 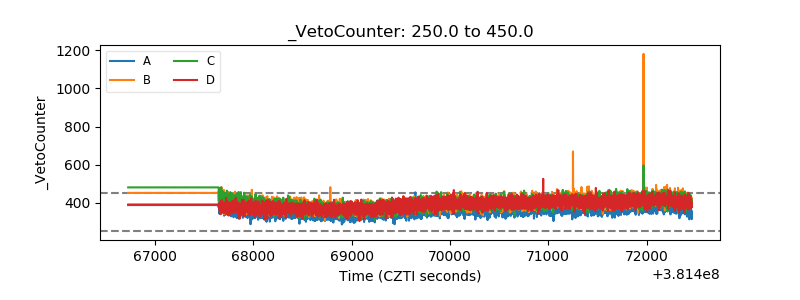 |