| Param | Original file | Final file |
|---|---|---|
| Filename | modeM0/AS1A05_082T08_9000004900_34322cztM0_level2.evt | modeM0/AS1A05_082T08_9000004900_34322cztM0_level2_quad_clean.evt |
| Size (bytes) | 446,976,000 | 88,329,600 |
| Size | 426.3 MB | 84.2 MB |
| Events in quadrant A | 2,361,869 | 587,290 |
| Events in quadrant B | 2,878,756 | 606,777 |
| Events in quadrant C | 3,595,924 | 583,195 |
| Events in quadrant D | 4,366,886 | 553,011 |
| Mode M9 | |||
|---|---|---|---|
| Quadrant | BADHDUFLAG | Total packets | Discarded packets |
| A | 0 | 41 | 0 |
| B | 0 | 41 | 0 |
| C | 0 | 41 | 0 |
| D | 0 | 42 | 0 |
| Mode SS | |||
|---|---|---|---|
| Quadrant | BADHDUFLAG | Total packets | Discarded packets |
| A | 0 | 98 | 0 |
| B | 0 | 98 | 0 |
| C | 0 | 98 | 0 |
| D | 0 | 98 | 0 |
| Mode M0 | |||
|---|---|---|---|
| Quadrant | BADHDUFLAG | Total packets | Discarded packets |
| A | 0 | 10096 | 3 |
| B | 0 | 11671 | 2 |
| C | 0 | 13756 | 2 |
| D | 0 | 16358 | 2 |
| Quadrant | Total seconds | Saturated seconds | Saturation percentage |
|---|---|---|---|
| A | 4921 | 5 | 0.101605% |
| B | 4921 | 85 | 1.727291% |
| C | 4921 | 201 | 4.084536% |
| D | 4921 | 163 | 3.312335% |
Noise dominated data is calculated using 1-second bins in cleaned event files. If a bin has >2000 counts, and if more than 50% of those come from <1% of pixels, then it is considered to be noise-dominated and hence unusable.
| Quadrant | # 1 sec bins | Bins with >0 counts | Bins with >2000 counts | High rate bins dominated by noise | Noise dominated (total time) | Noise dominated (detector-on time) | Marked lightcurve |
|---|---|---|---|---|---|---|---|
| A | 7042 | 4922 | 1 | 1 | 0.01% | 0.02% | 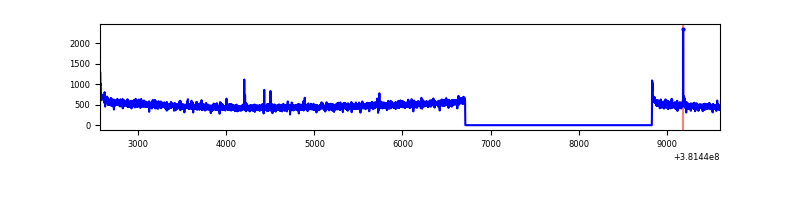 |
| B | 7042 | 4922 | 48 | 48 | 0.68% | 0.98% | 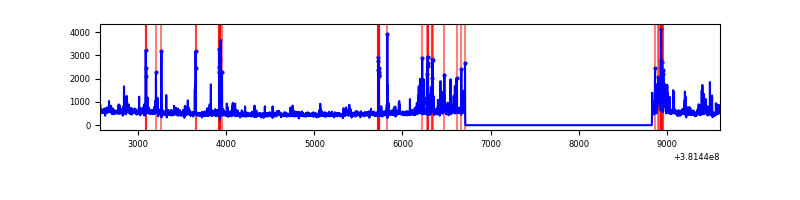 |
| C | 7042 | 4922 | 177 | 177 | 2.51% | 3.60% | 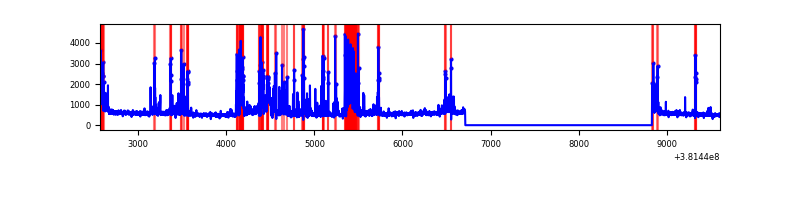 |
| D | 7042 | 4922 | 125 | 125 | 1.78% | 2.54% | 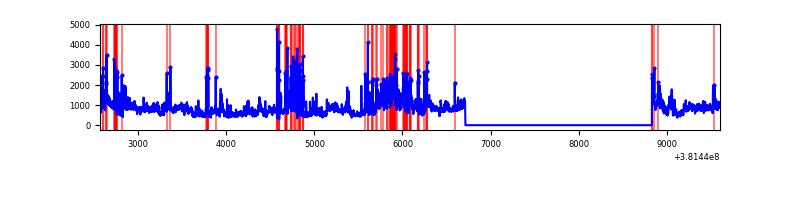 |
Top three noisy pixels from each quadrant. If the there are fewer than three noisy pixels in the level2.evt file, extra rows are filled as -1
| Pixel properties | Quadrant properties | ||||||
|---|---|---|---|---|---|---|---|
| Quadrant | DetID | PixID | Counts | Sigma | Mean | Median | Sigma |
| A | 10 | 83 | 28216 | 229.45 | 601 | 591 | 120.4 |
| A | 13 | 254 | 8309 | 64.11 | 601 | 591 | 120.4 |
| A | 13 | 6 | 7445 | 56.93 | 601 | 591 | 120.4 |
| B | 5 | 172 | 212218 | 1840.67 | 605 | 592 | 115.0 |
| B | 4 | 171 | 84436 | 729.25 | 605 | 592 | 115.0 |
| B | 5 | 31 | 68210 | 588.12 | 605 | 592 | 115.0 |
| C | 14 | 254 | 936969 | 6891.5 | 588 | 594 | 135.9 |
| C | 15 | 214 | 204921 | 1503.8 | 588 | 594 | 135.9 |
| C | 0 | 10 | 105993 | 775.71 | 588 | 594 | 135.9 |
| D | 8 | 195 | 961310 | 6698.6 | 584 | 570 | 143.4 |
| D | 12 | 235 | 454234 | 3163.1 | 584 | 570 | 143.4 |
| D | 2 | 249 | 264054 | 1837.1 | 584 | 570 | 143.4 |
Histogram calculated using DETX and DETY for each event in the final _common_clean file
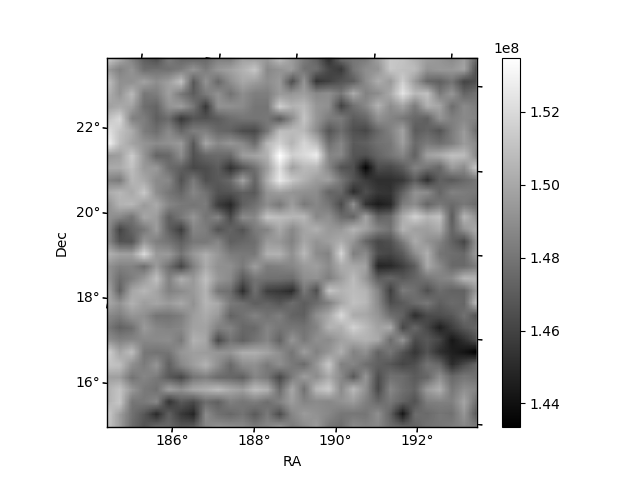
| Quadrant A | 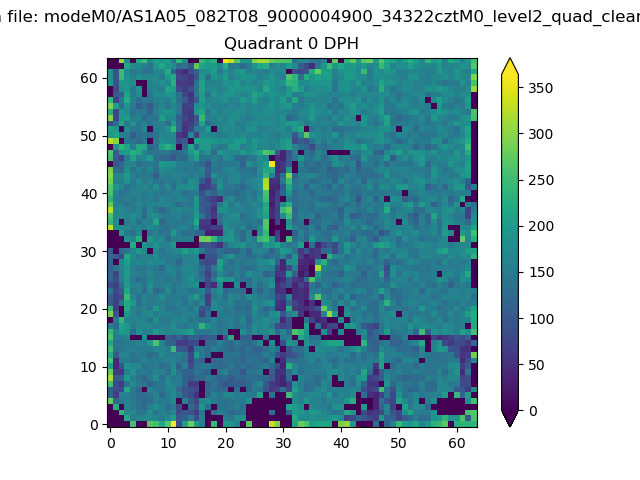 |
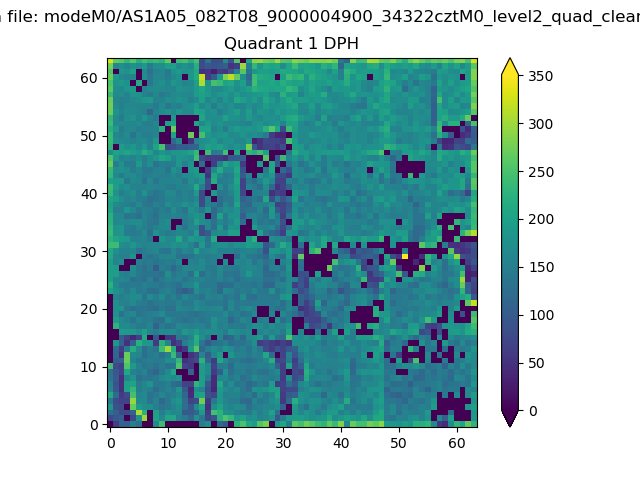 |
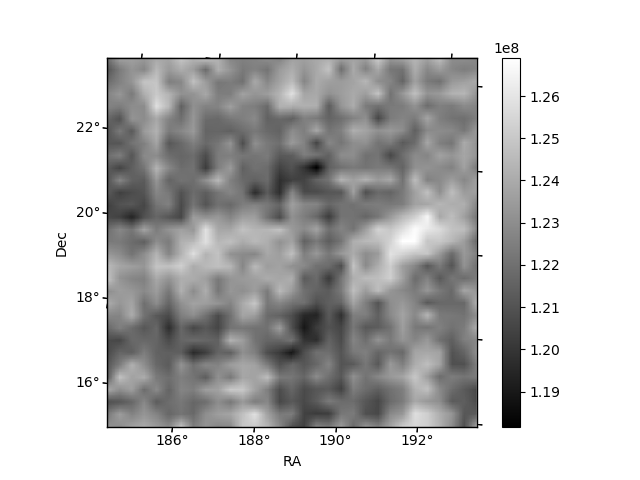
Quadrant B |
|---|---|---|---|
| Quadrant D | 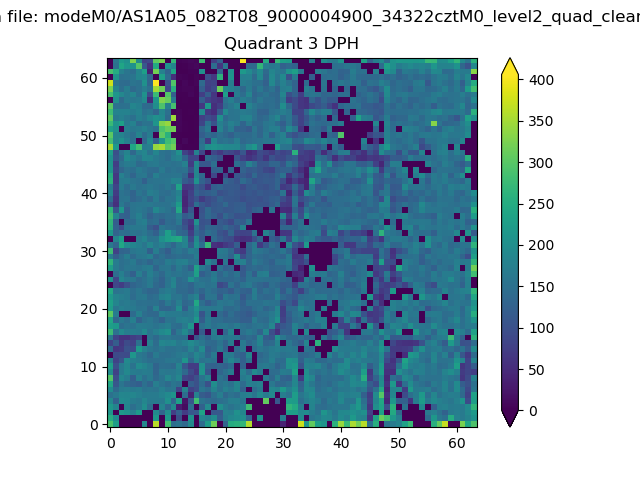 |
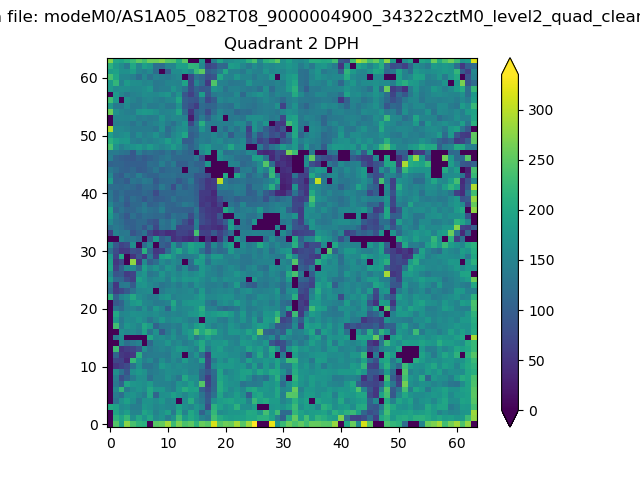 |
Quadrant C |
| Plot type | Count rate plots | Images |
|---|---|---|
| Comparison with Poisson distribution Blue bars denote a histogram of data divided into 1 sec bins. Red curve is a Poisson curve with rate = median count rate of data. |
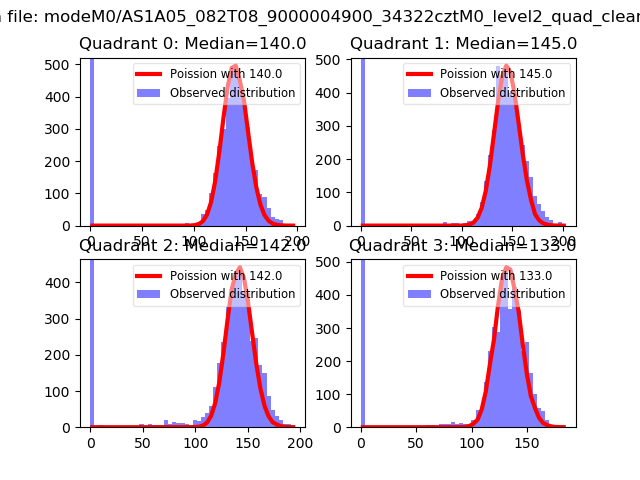 |
 |
| Quadrant-wise count rates Data is divided into 100 sec bins |
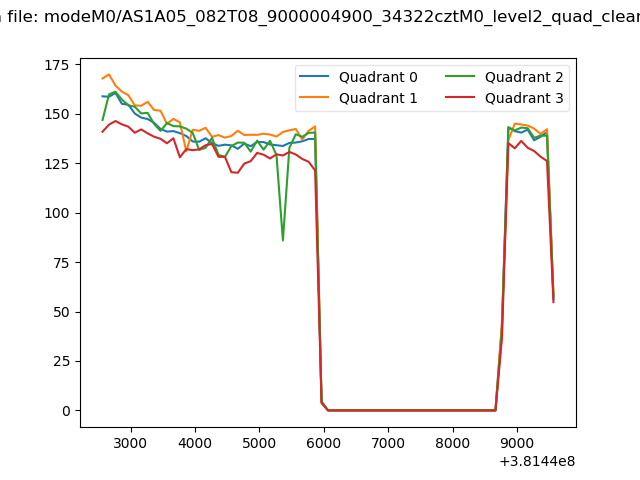 |
|
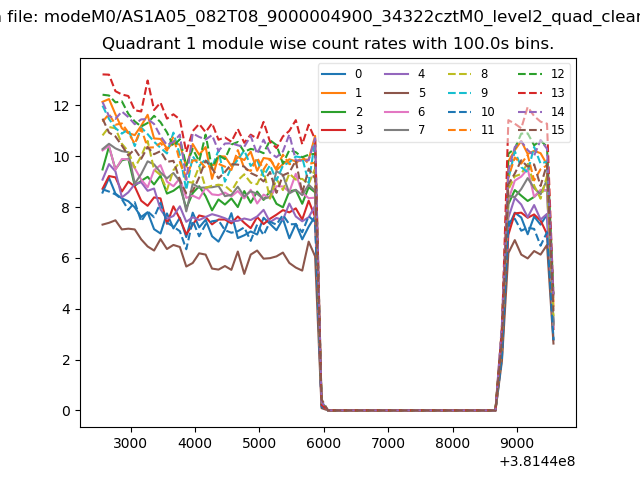
| Module-wise count rates for Quadrant A Data is divided into 100 sec bins |
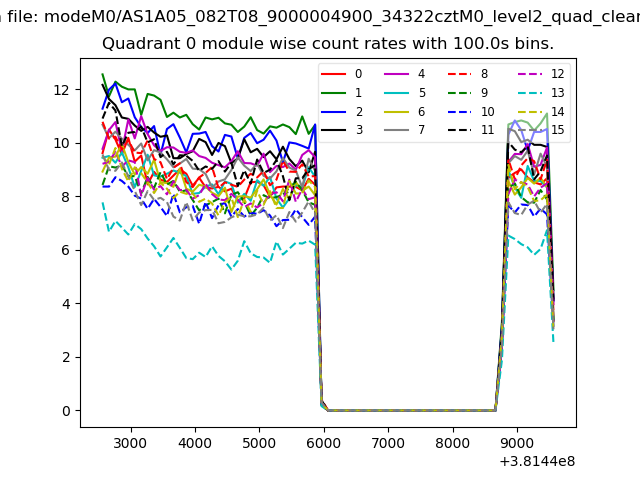 |
 |
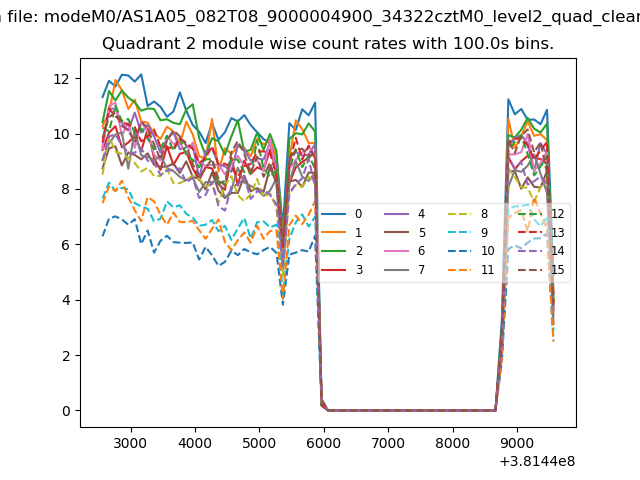
| Module-wise count rates for Quadrant B Data is divided into 100 sec bins |
 |
 |
| Module-wise count rates for Quadrant C Data is divided into 100 sec bins |
 |
 |
| Module-wise count rates for Quadrant D Data is divided into 100 sec bins |
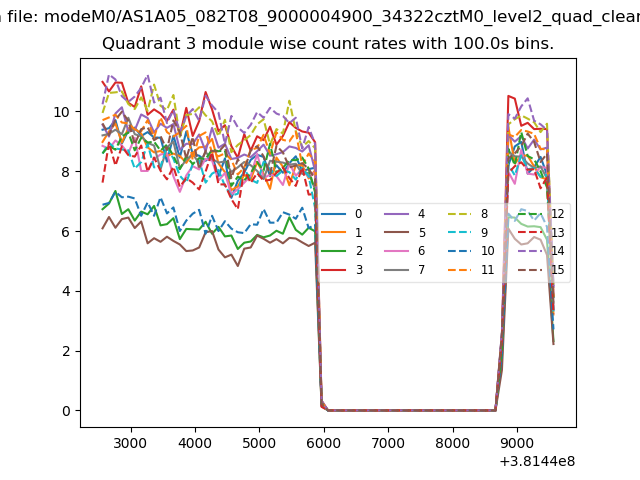 |
 |
| Parameter | Plot |
|---|---|
| CZT HV Monitor | 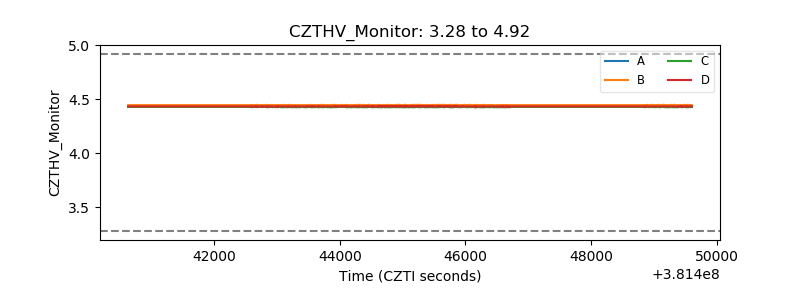 |
| D_VDD | 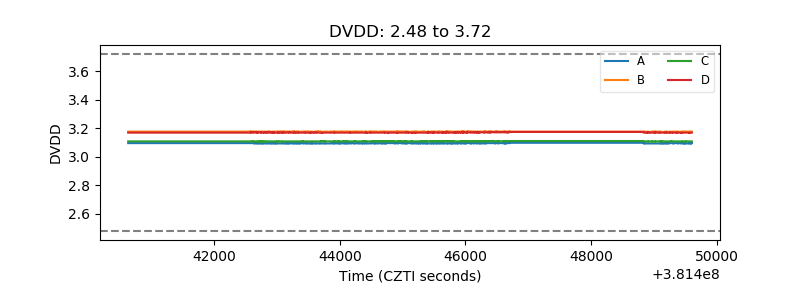 |
| Temperature 1 | 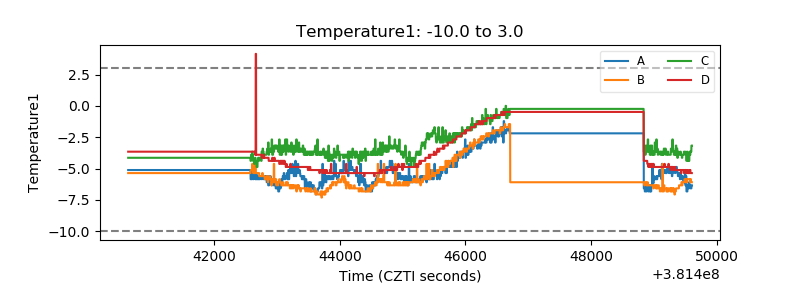 |
| Veto HV Monitor | 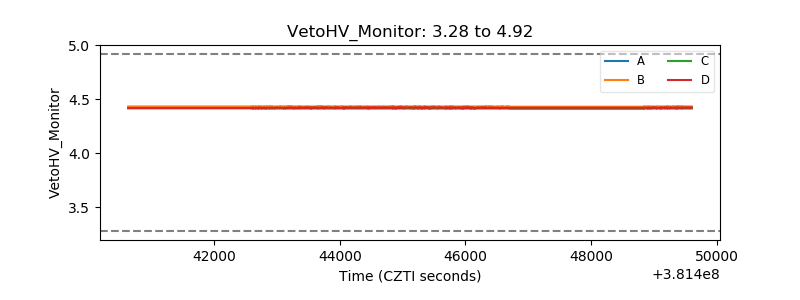 |
| Veto LLD | 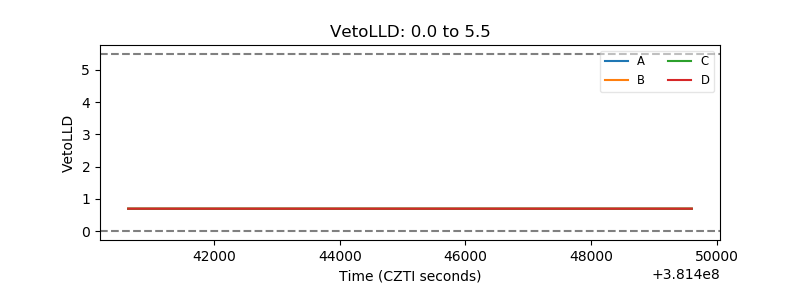 |
| Alpha Counter | 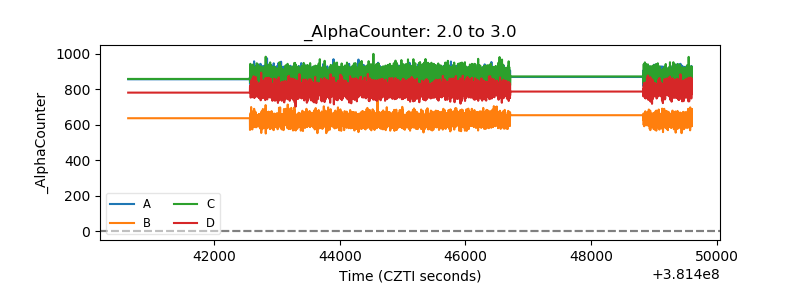 |
| _CPM_Rate | 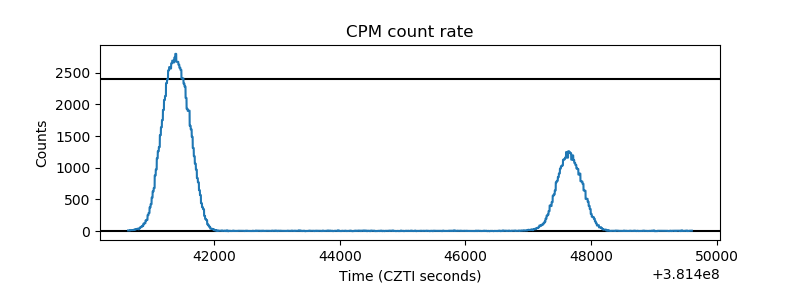 |
| CZT Counter | 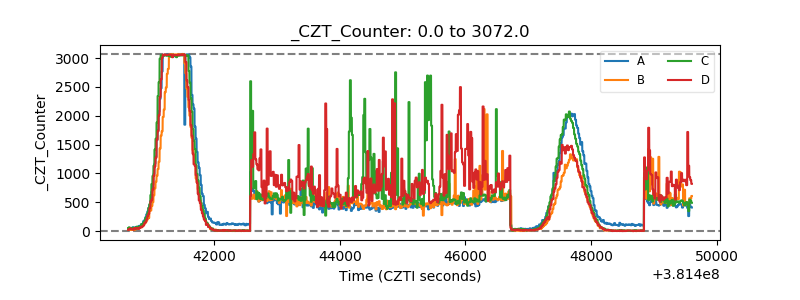 |
| +2.5 Volts monitor | 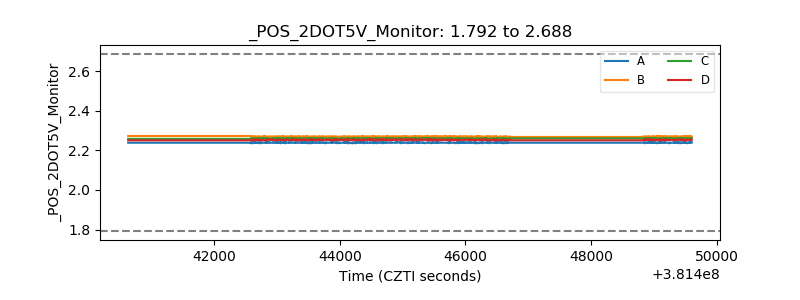 |
| +5 Volts monitor | 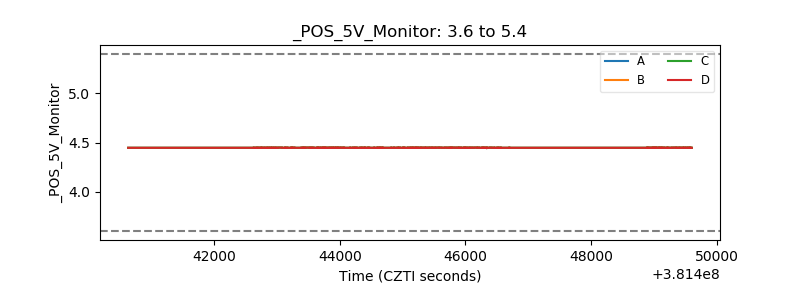 |
| _ROLL_ROT | 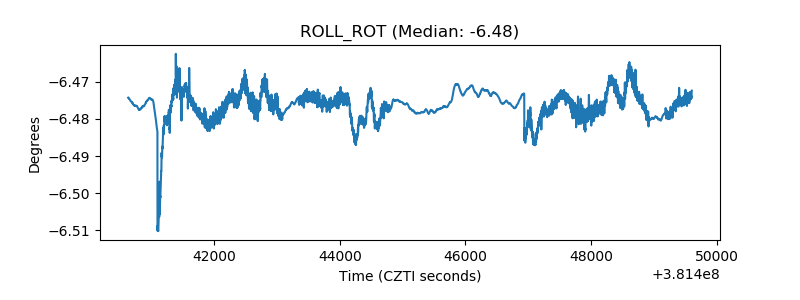 |
| _Roll_DEC | 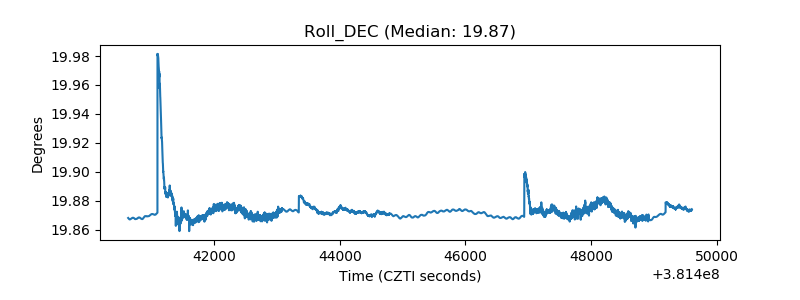 |
| _Roll_RA | 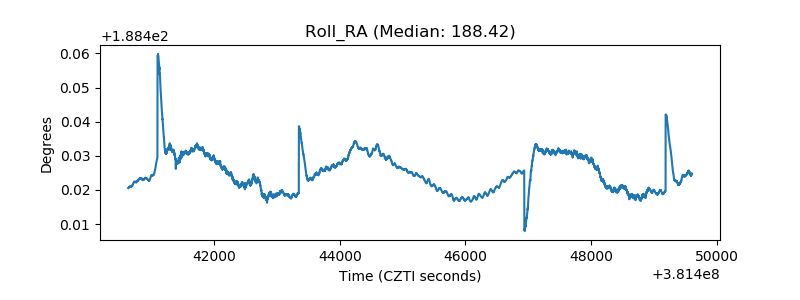 |
| Veto Counter | 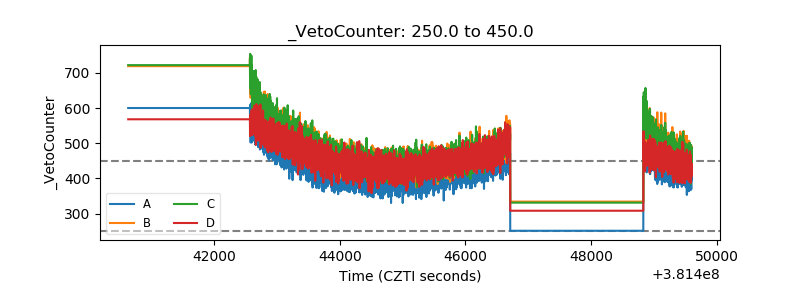 |