| Param | Original file | Final file |
|---|---|---|
| Filename | modeM0/AS1A05_082T08_9000004900_34321cztM0_level2.evt | modeM0/AS1A05_082T08_9000004900_34321cztM0_level2_quad_clean.evt |
| Size (bytes) | 211,538,880 | 40,389,120 |
| Size | 201.7 MB | 38.5 MB |
| Events in quadrant A | 1,115,417 | 267,482 |
| Events in quadrant B | 1,255,554 | 277,696 |
| Events in quadrant C | 1,338,596 | 273,070 |
| Events in quadrant D | 2,547,998 | 247,774 |
| Mode M9 | |||
|---|---|---|---|
| Quadrant | BADHDUFLAG | Total packets | Discarded packets |
| A | 0 | 21 | 0 |
| B | 0 | 21 | 0 |
| C | 0 | 21 | 0 |
| D | 0 | 21 | 0 |
| Mode SS | |||
|---|---|---|---|
| Quadrant | BADHDUFLAG | Total packets | Discarded packets |
| A | 0 | 44 | 0 |
| B | 0 | 44 | 0 |
| C | 0 | 44 | 0 |
| D | 0 | 44 | 0 |
| Mode M0 | |||
|---|---|---|---|
| Quadrant | BADHDUFLAG | Total packets | Discarded packets |
| A | 0 | 4548 | 2 |
| B | 0 | 5047 | 1 |
| C | 0 | 5270 | 1 |
| D | 0 | 9090 | 1 |
| Quadrant | Total seconds | Saturated seconds | Saturation percentage |
|---|---|---|---|
| A | 2172 | 4 | 0.184162% |
| B | 2172 | 23 | 1.058932% |
| C | 2172 | 23 | 1.058932% |
| D | 2172 | 180 | 8.287293% |
Noise dominated data is calculated using 1-second bins in cleaned event files. If a bin has >2000 counts, and if more than 50% of those come from <1% of pixels, then it is considered to be noise-dominated and hence unusable.
| Quadrant | # 1 sec bins | Bins with >0 counts | Bins with >2000 counts | High rate bins dominated by noise | Noise dominated (total time) | Noise dominated (detector-on time) | Marked lightcurve |
|---|---|---|---|---|---|---|---|
| A | 4264 | 2173 | 0 | 0 | 0.00% | 0.00% | 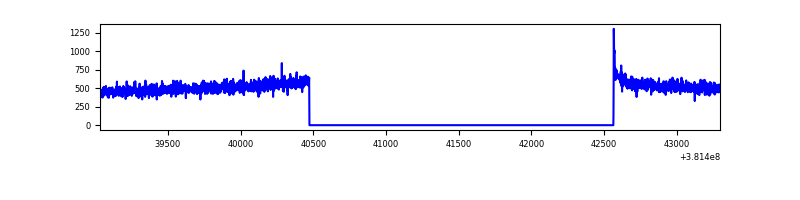 |
| B | 4264 | 2173 | 11 | 11 | 0.26% | 0.51% | 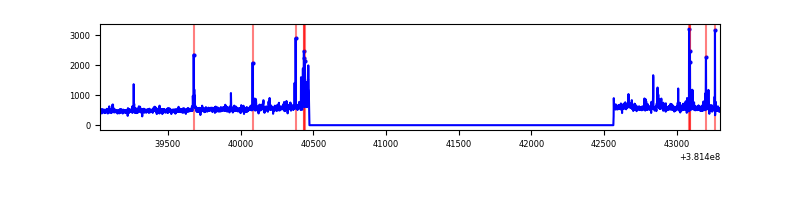 |
| C | 4264 | 2173 | 17 | 17 | 0.40% | 0.78% | 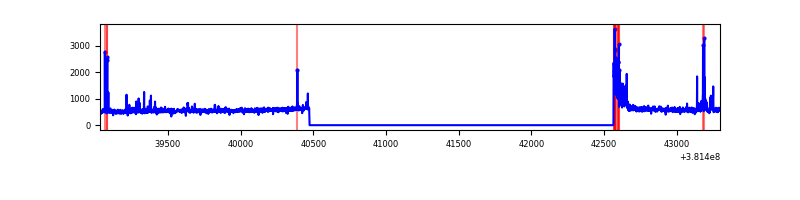 |
| D | 4264 | 2173 | 170 | 170 | 3.99% | 7.82% | 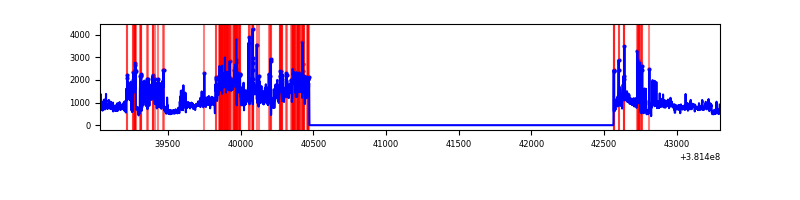 |
Top three noisy pixels from each quadrant. If the there are fewer than three noisy pixels in the level2.evt file, extra rows are filled as -1
| Pixel properties | Quadrant properties | ||||||
|---|---|---|---|---|---|---|---|
| Quadrant | DetID | PixID | Counts | Sigma | Mean | Median | Sigma |
| A | 10 | 83 | 13946 | 233.17 | 284 | 279 | 58.6 |
| A | 13 | 254 | 3448 | 54.07 | 284 | 279 | 58.6 |
| A | 13 | 6 | 3030 | 46.93 | 284 | 279 | 58.6 |
| B | 5 | 172 | 76873 | 1361.81 | 284 | 278 | 56.2 |
| B | 4 | 232 | 19654 | 344.49 | 284 | 278 | 56.2 |
| B | 4 | 251 | 16344 | 285.64 | 284 | 278 | 56.2 |
| C | 15 | 214 | 91867 | 1387.42 | 280 | 283 | 66.0 |
| C | 0 | 10 | 67176 | 1013.37 | 280 | 283 | 66.0 |
| C | 14 | 254 | 61763 | 931.37 | 280 | 283 | 66.0 |
| D | 8 | 195 | 485438 | 6784.58 | 273 | 267 | 71.5 |
| D | 12 | 227 | 444631 | 6213.94 | 273 | 267 | 71.5 |
| D | 12 | 235 | 213422 | 2980.74 | 273 | 267 | 71.5 |
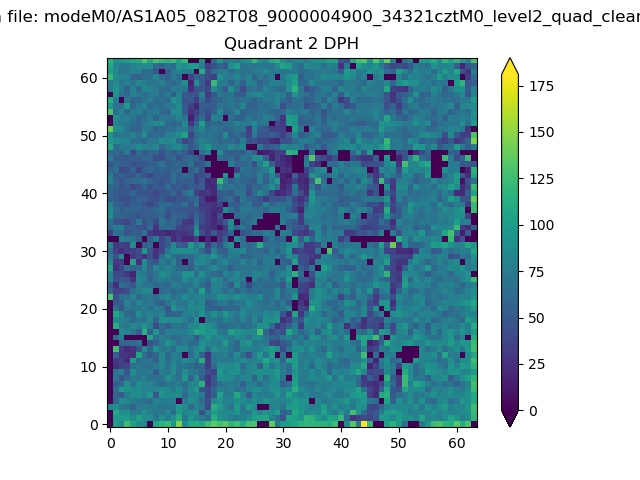
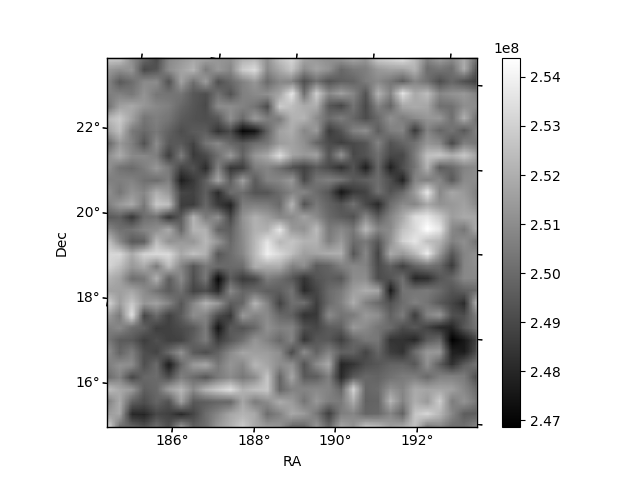
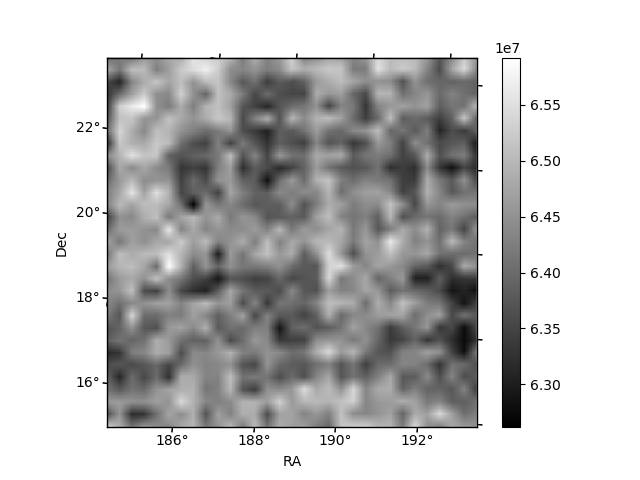
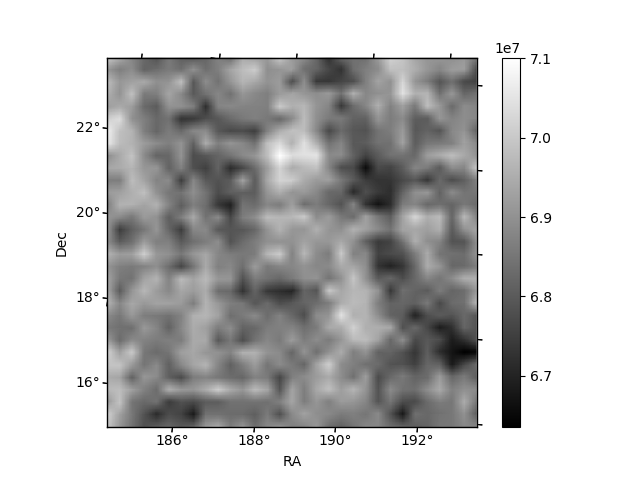
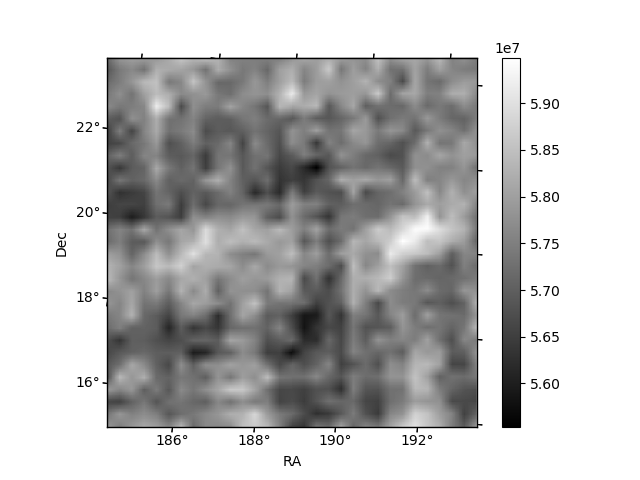
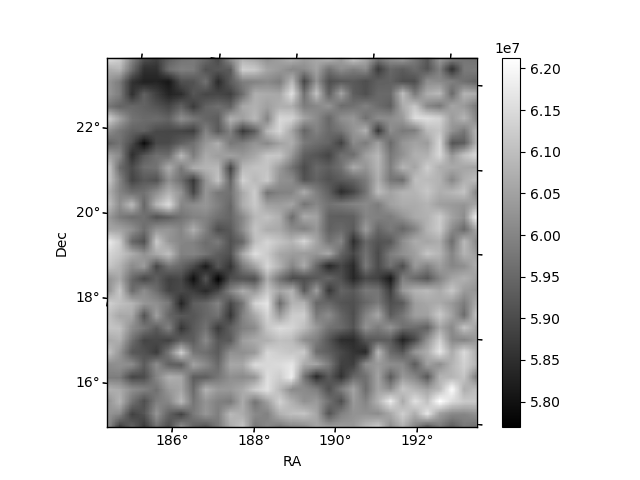
Histogram calculated using DETX and DETY for each event in the final _common_clean file
| Quadrant A | 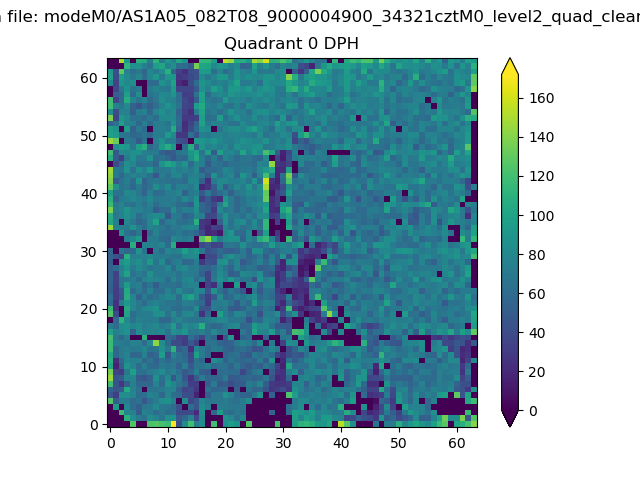 |
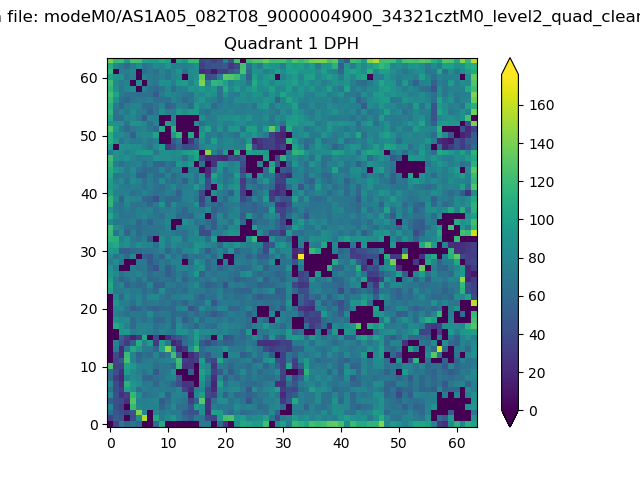 |
Quadrant B |
|---|---|---|---|
| Quadrant D | 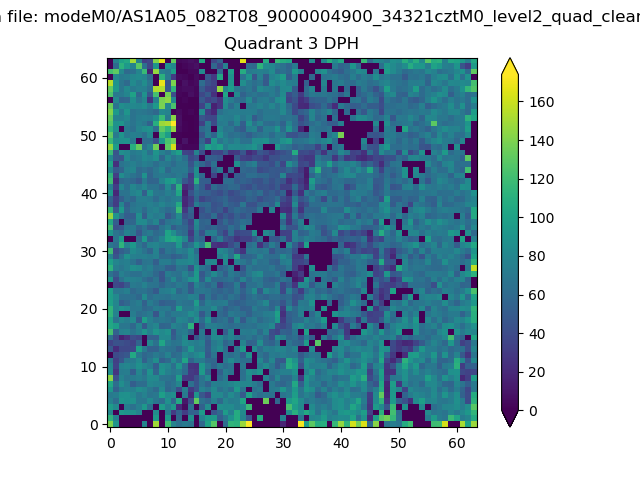 |
 |
Quadrant C |
| Plot type | Count rate plots | Images |
|---|---|---|
| Comparison with Poisson distribution Blue bars denote a histogram of data divided into 1 sec bins. Red curve is a Poisson curve with rate = median count rate of data. |
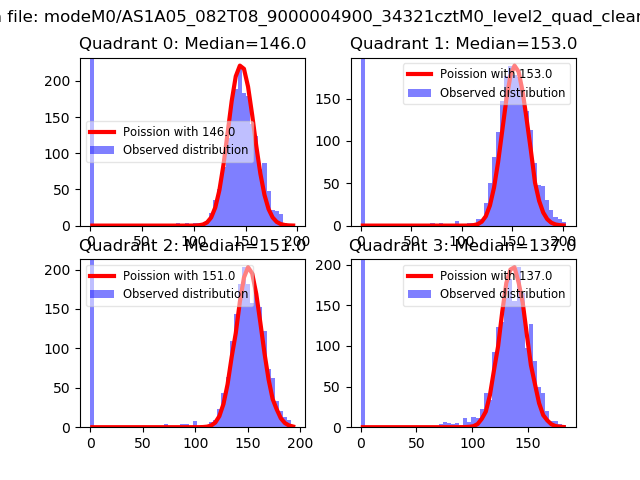 |
 |
| Quadrant-wise count rates Data is divided into 100 sec bins |
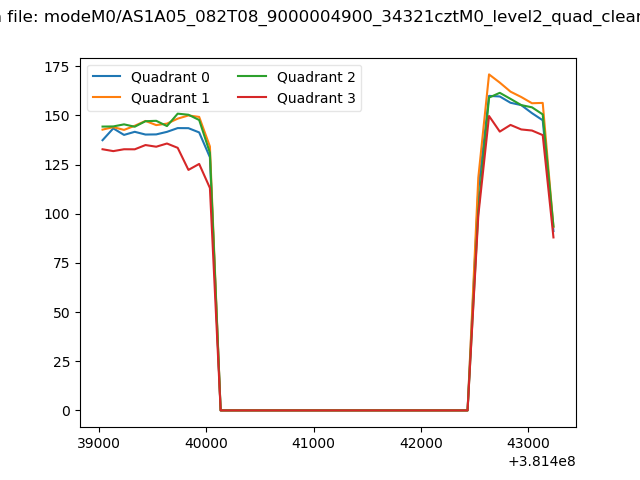 |
|
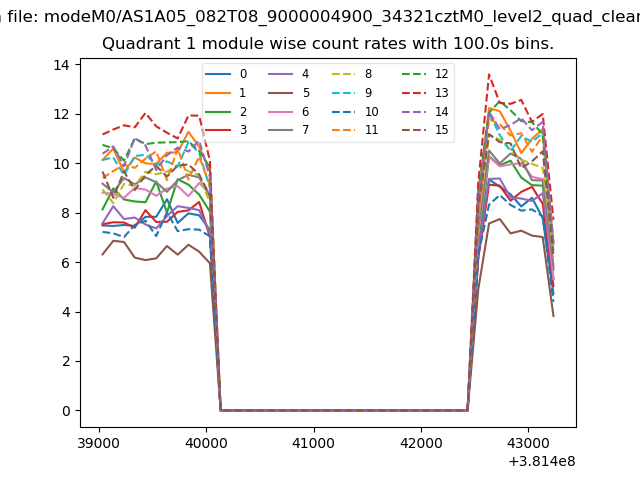
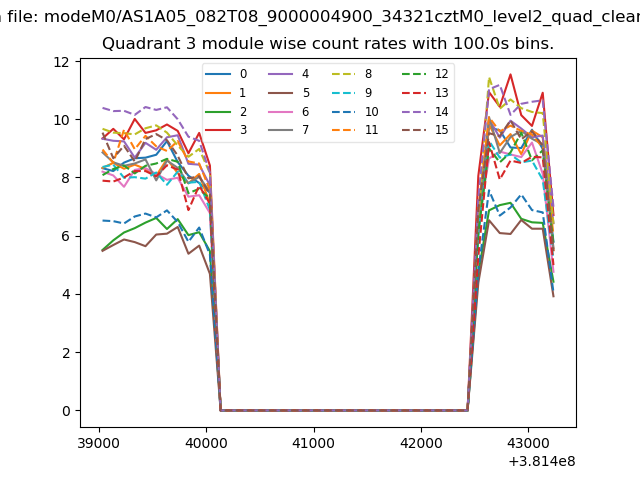
| Module-wise count rates for Quadrant A Data is divided into 100 sec bins |
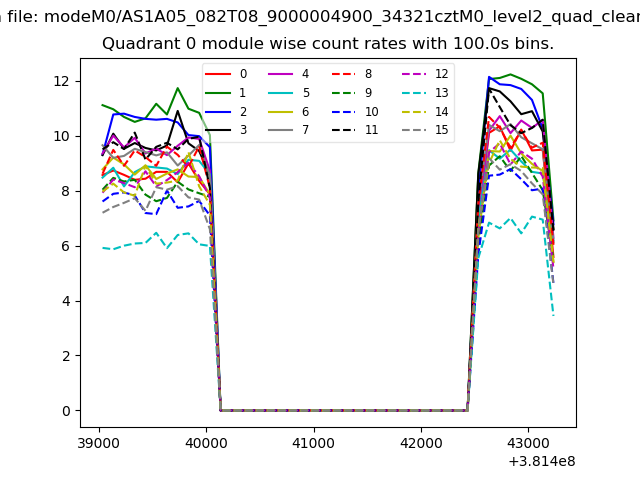 |
 |
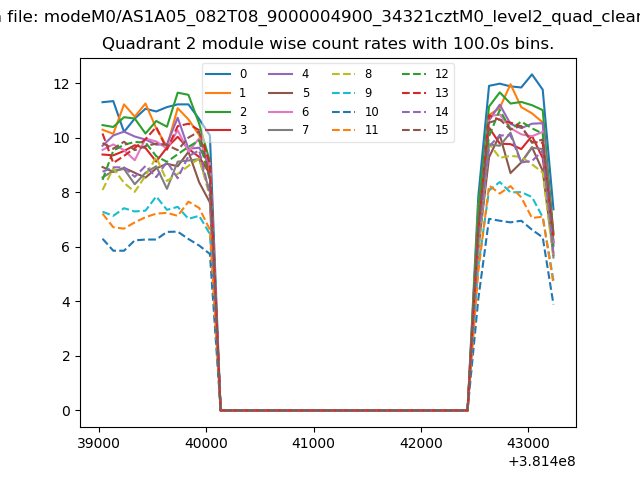
| Module-wise count rates for Quadrant B Data is divided into 100 sec bins |
 |
 |
| Module-wise count rates for Quadrant C Data is divided into 100 sec bins |
 |
 |
| Module-wise count rates for Quadrant D Data is divided into 100 sec bins |
 |
 |
| Parameter | Plot |
|---|---|
| CZT HV Monitor |  |
| D_VDD | 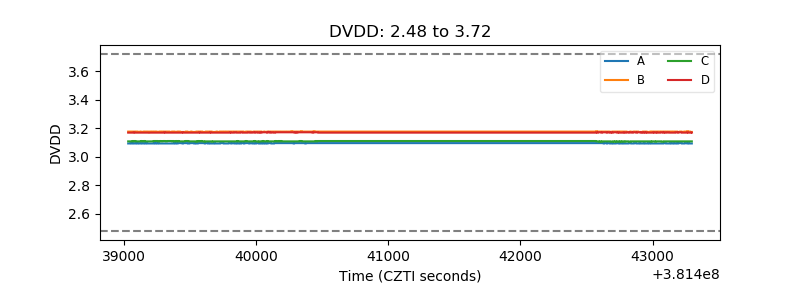 |
| Temperature 1 | 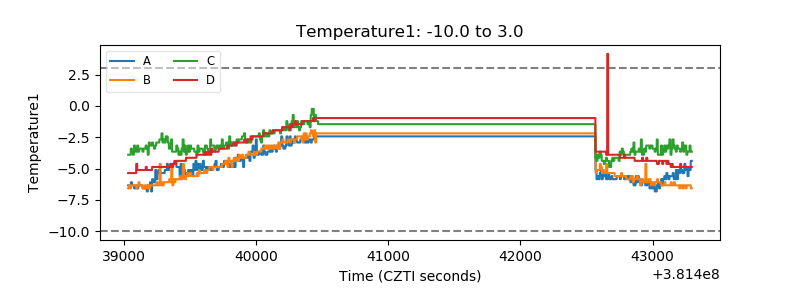 |
| Veto HV Monitor | 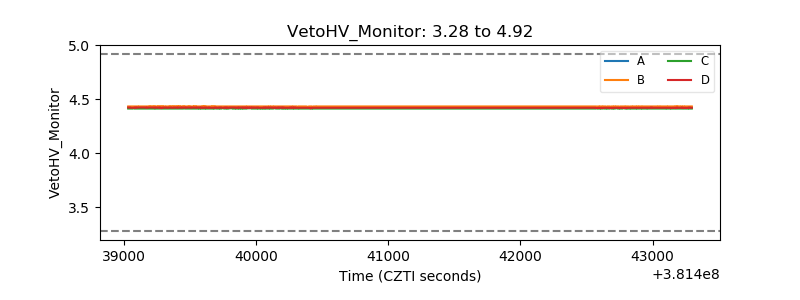 |
| Veto LLD | 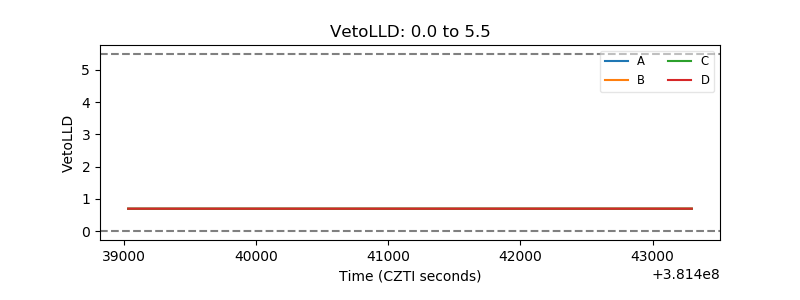 |
| Alpha Counter | 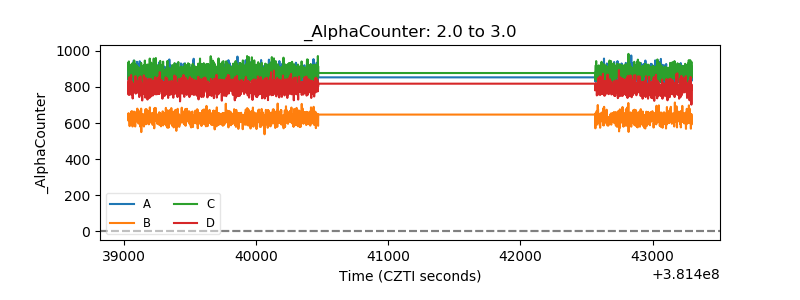 |
| _CPM_Rate | 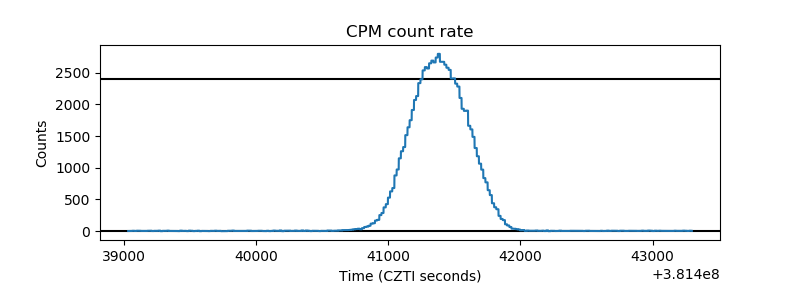 |
| CZT Counter | 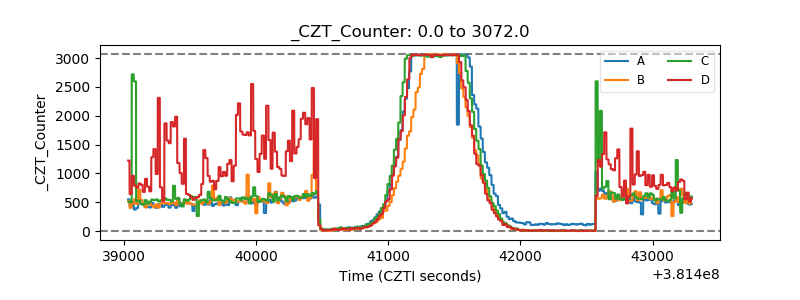 |
| +2.5 Volts monitor | 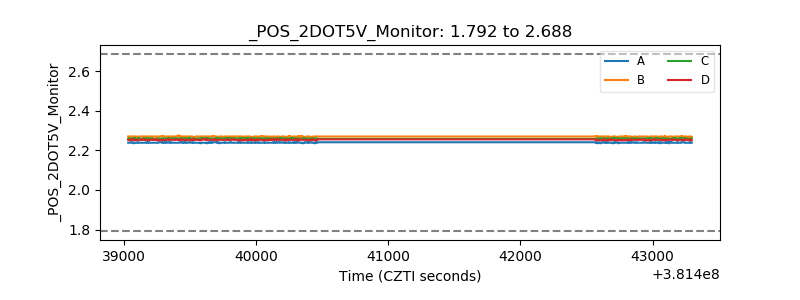 |
| +5 Volts monitor | 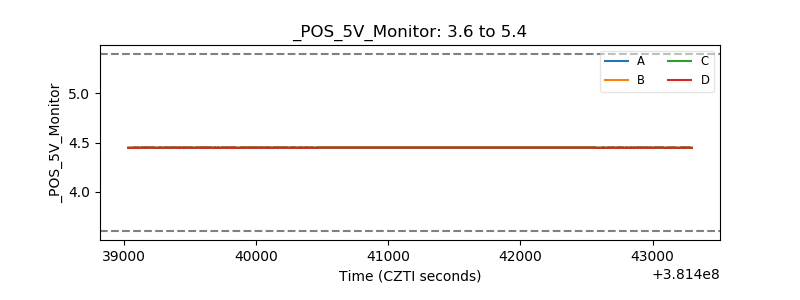 |
| _ROLL_ROT | 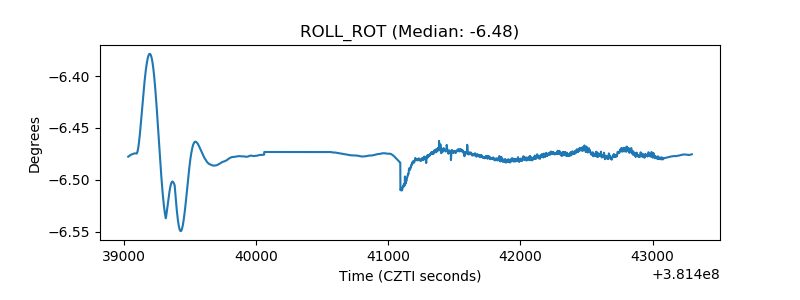 |
| _Roll_DEC | 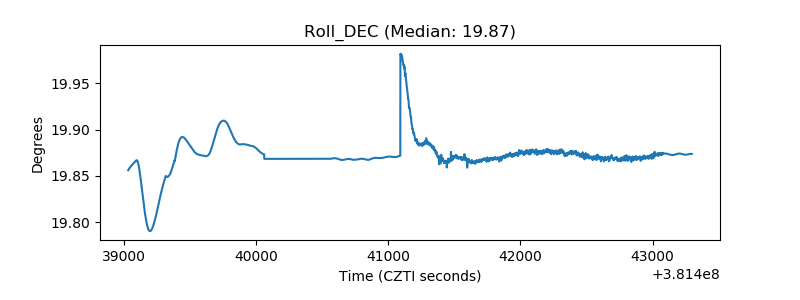 |
| _Roll_RA | 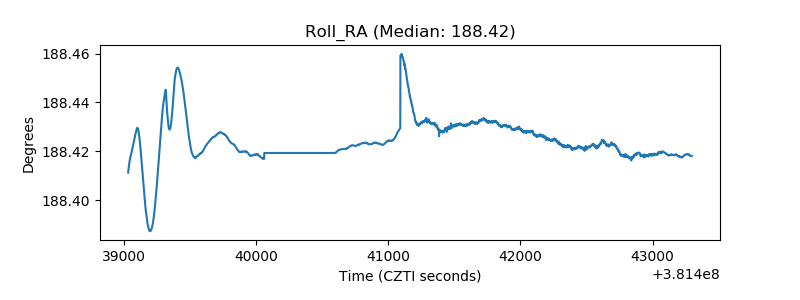 |
| Veto Counter | 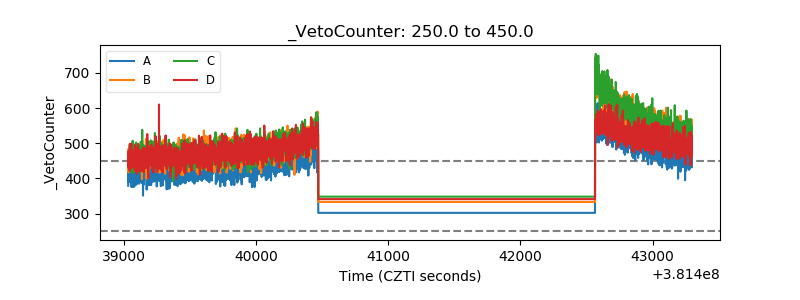 |