| Param | Original file | Final file |
|---|---|---|
| Filename | modeM0/AS1A11_047T07_9000004892_34308cztM0_level2.evt | modeM0/AS1A11_047T07_9000004892_34308cztM0_level2_quad_clean.evt |
| Size (bytes) | 437,688,000 | 92,580,480 |
| Size | 417.4 MB | 88.3 MB |
| Events in quadrant A | 2,390,424 | 617,879 |
| Events in quadrant B | 3,562,472 | 618,278 |
| Events in quadrant C | 2,755,457 | 631,295 |
| Events in quadrant D | 4,210,857 | 588,814 |
| Mode M0 | |||
|---|---|---|---|
| Quadrant | BADHDUFLAG | Total packets | Discarded packets |
| A | 0 | 10245 | 3 |
| B | 0 | 13880 | 2 |
| C | 0 | 11037 | 2 |
| D | 0 | 16215 | 2 |
| Mode M9 | |||
|---|---|---|---|
| Quadrant | BADHDUFLAG | Total packets | Discarded packets |
| A | 0 | 42 | 0 |
| B | 0 | 42 | 0 |
| C | 0 | 42 | 0 |
| D | 0 | 42 | 0 |
| Mode SS | |||
|---|---|---|---|
| Quadrant | BADHDUFLAG | Total packets | Discarded packets |
| A | 0 | 104 | 0 |
| B | 0 | 104 | 0 |
| C | 0 | 104 | 0 |
| D | 0 | 104 | 0 |
| Quadrant | Total seconds | Saturated seconds | Saturation percentage |
|---|---|---|---|
| A | 4952 | 11 | 0.222132% |
| B | 4952 | 248 | 5.008078% |
| C | 4952 | 65 | 1.312601% |
| D | 4952 | 132 | 2.665590% |
Noise dominated data is calculated using 1-second bins in cleaned event files. If a bin has >2000 counts, and if more than 50% of those come from <1% of pixels, then it is considered to be noise-dominated and hence unusable.
| Quadrant | # 1 sec bins | Bins with >0 counts | Bins with >2000 counts | High rate bins dominated by noise | Noise dominated (total time) | Noise dominated (detector-on time) | Marked lightcurve |
|---|---|---|---|---|---|---|---|
| A | 9226 | 4954 | 2 | 2 | 0.02% | 0.04% | 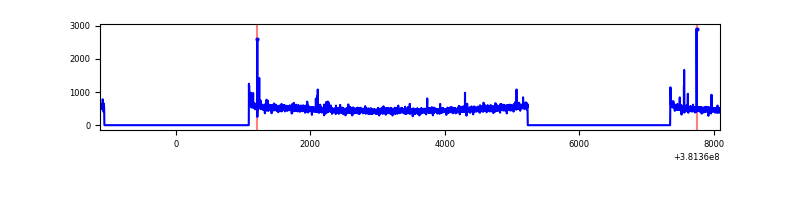 |
| B | 9226 | 4954 | 163 | 163 | 1.77% | 3.29% | 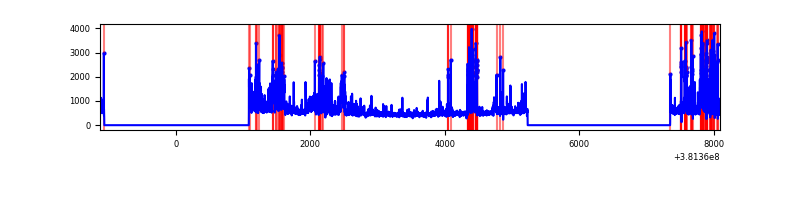 |
| C | 9226 | 4954 | 47 | 47 | 0.51% | 0.95% | 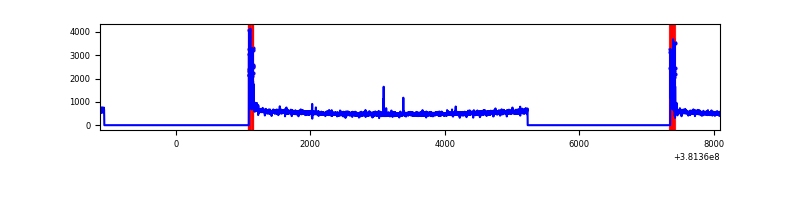 |
| D | 9226 | 4954 | 102 | 102 | 1.11% | 2.06% | 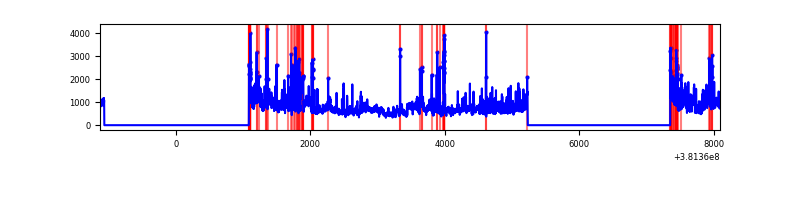 |
Top three noisy pixels from each quadrant. If the there are fewer than three noisy pixels in the level2.evt file, extra rows are filled as -1
| Pixel properties | Quadrant properties | ||||||
|---|---|---|---|---|---|---|---|
| Quadrant | DetID | PixID | Counts | Sigma | Mean | Median | Sigma |
| A | 10 | 83 | 28509 | 230.19 | 601 | 591 | 121.3 |
| A | 9 | 143 | 23305 | 187.28 | 601 | 591 | 121.3 |
| A | 13 | 6 | 13040 | 102.64 | 601 | 591 | 121.3 |
| B | 5 | 172 | 361767 | 3169.5 | 595 | 582 | 114.0 |
| B | 5 | 31 | 307454 | 2692.89 | 595 | 582 | 114.0 |
| B | 4 | 171 | 179155 | 1567.03 | 595 | 582 | 114.0 |
| C | 15 | 214 | 210308 | 1536.44 | 593 | 601 | 136.5 |
| C | 0 | 10 | 168645 | 1231.19 | 593 | 601 | 136.5 |
| C | 3 | 233 | 22414 | 159.82 | 593 | 601 | 136.5 |
| D | 8 | 195 | 675915 | 4452.7 | 580 | 567 | 151.7 |
| D | 12 | 235 | 459637 | 3026.74 | 580 | 567 | 151.7 |
| D | 7 | 223 | 242928 | 1597.93 | 580 | 567 | 151.7 |
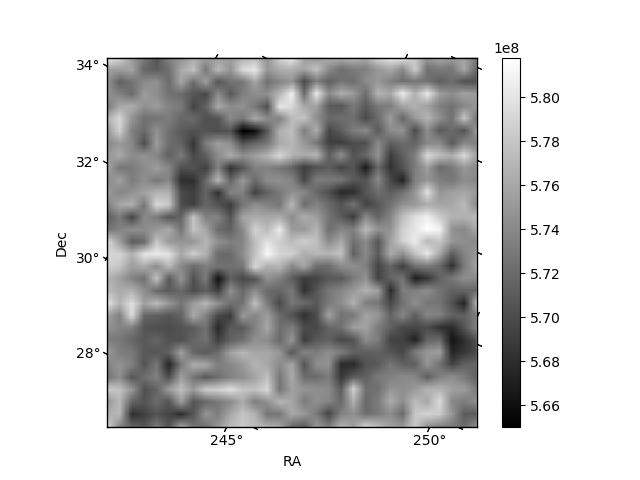
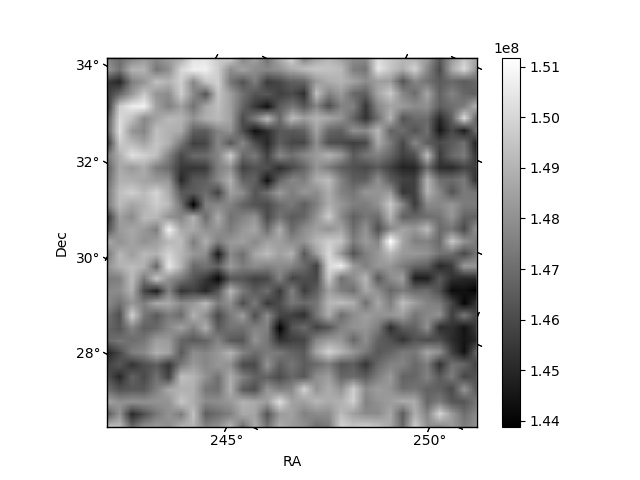
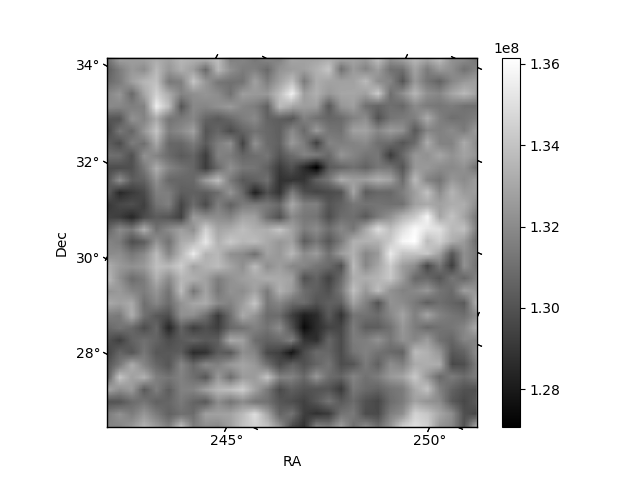
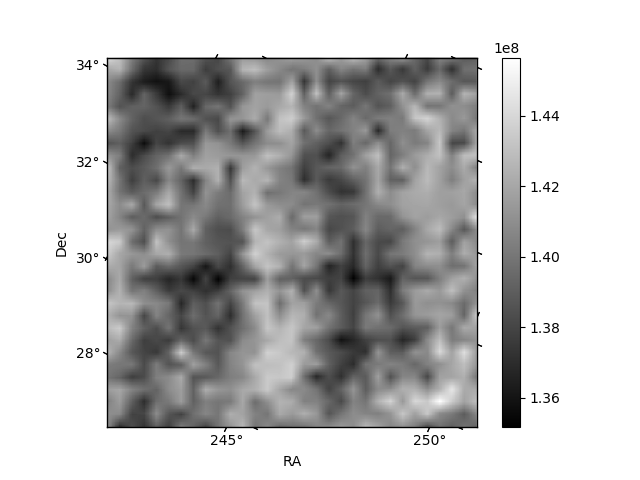
Histogram calculated using DETX and DETY for each event in the final _common_clean file
| Quadrant A | 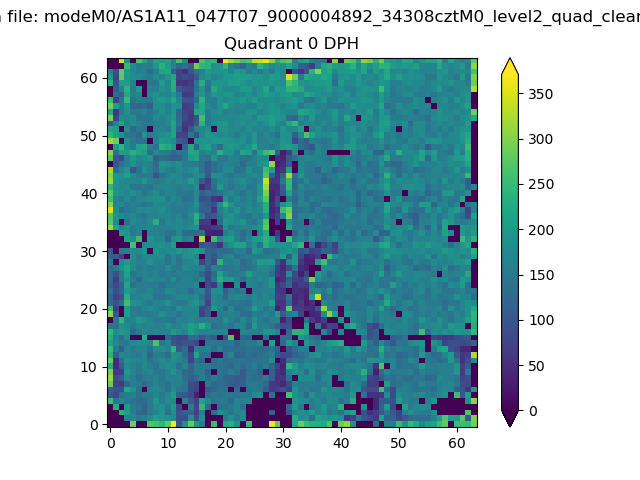 |
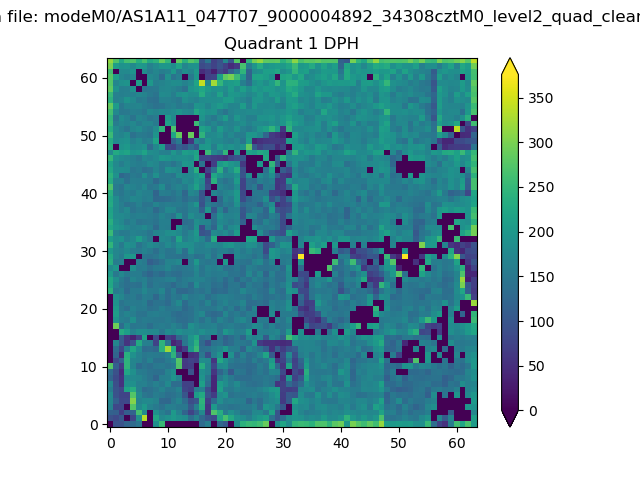 |
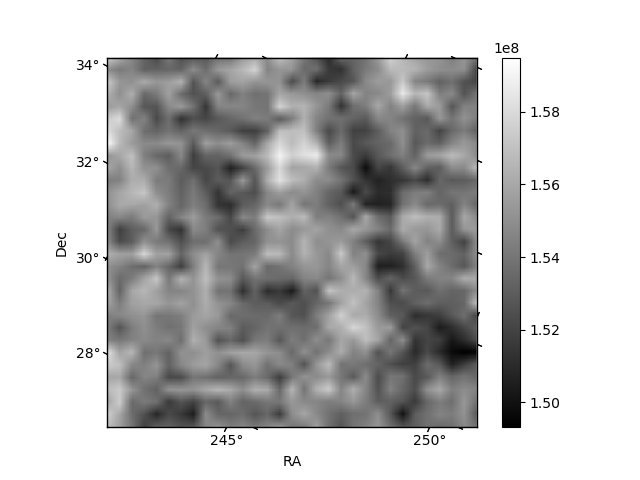
Quadrant B |
|---|---|---|---|
| Quadrant D | 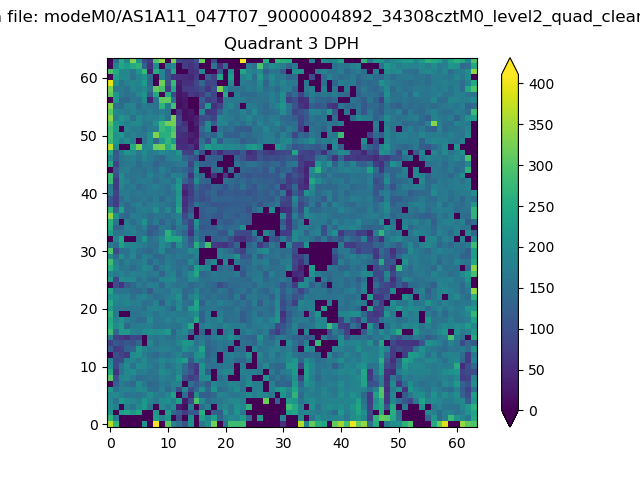 |
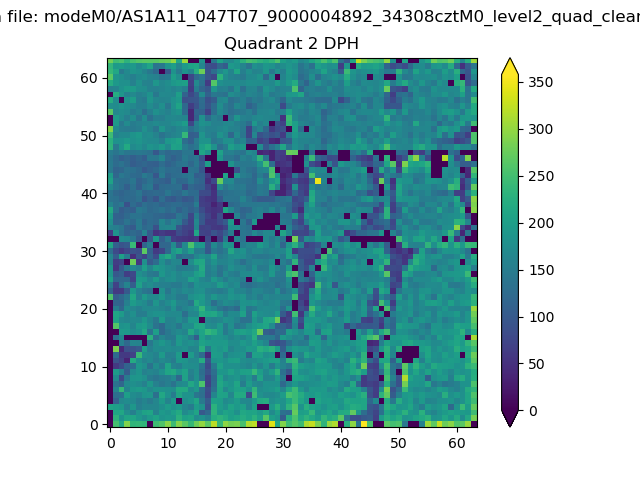 |
Quadrant C |
| Plot type | Count rate plots | Images |
|---|---|---|
| Comparison with Poisson distribution Blue bars denote a histogram of data divided into 1 sec bins. Red curve is a Poisson curve with rate = median count rate of data. |
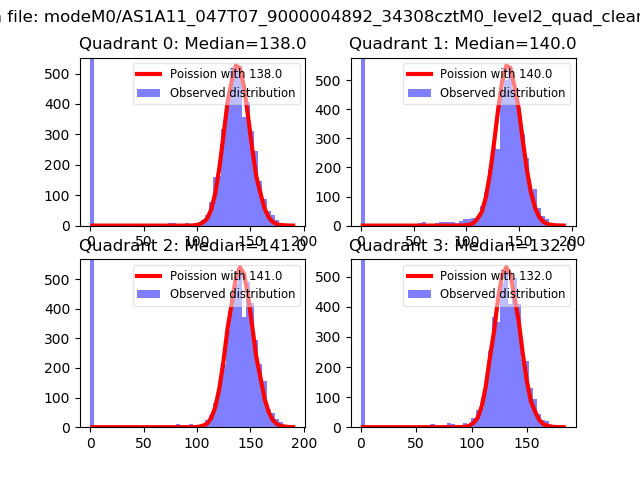 |
 |
| Quadrant-wise count rates Data is divided into 100 sec bins |
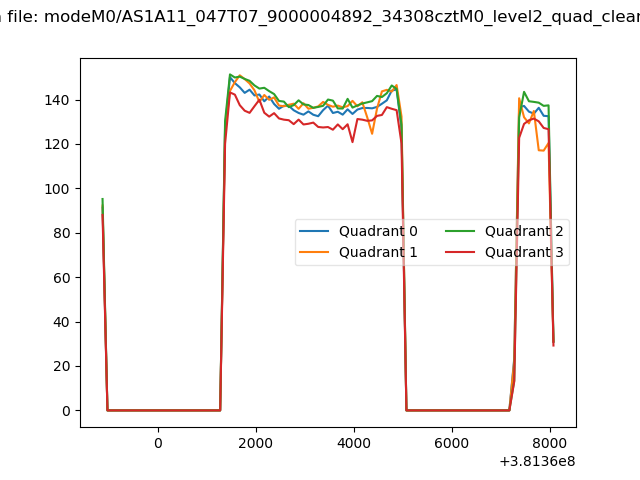 |
|
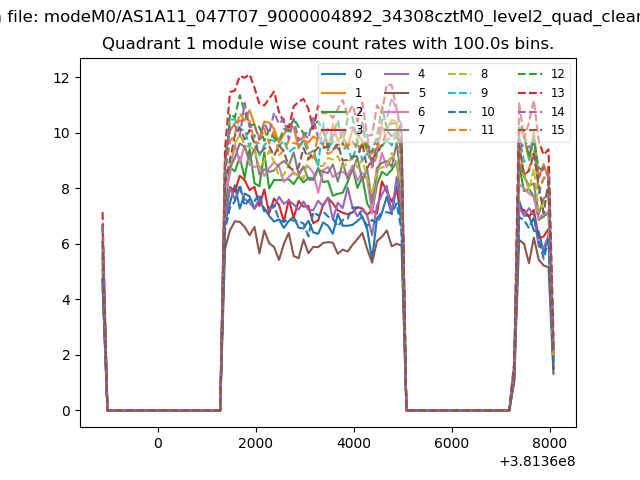
| Module-wise count rates for Quadrant A Data is divided into 100 sec bins |
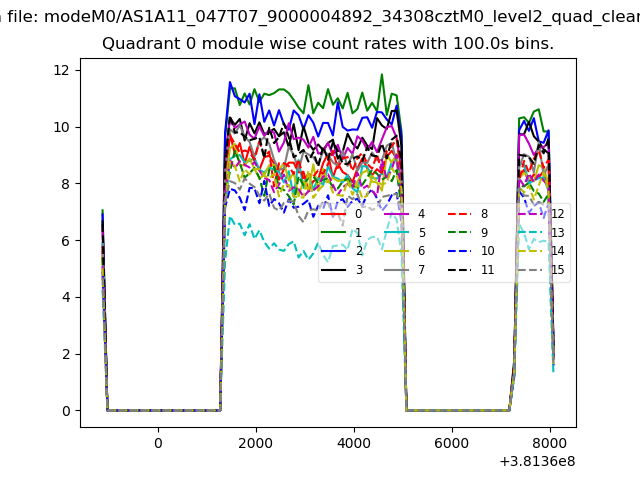 |
 |
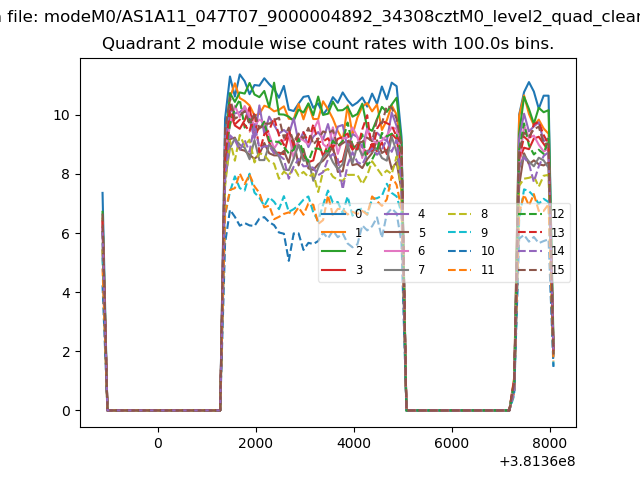
| Module-wise count rates for Quadrant B Data is divided into 100 sec bins |
 |
 |
| Module-wise count rates for Quadrant C Data is divided into 100 sec bins |
 |
 |
| Module-wise count rates for Quadrant D Data is divided into 100 sec bins |
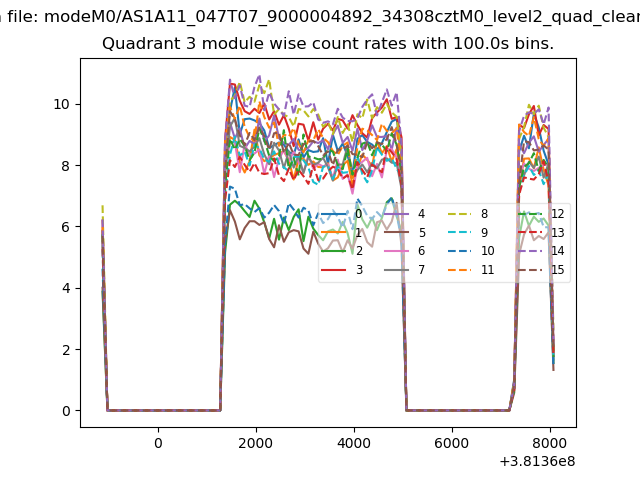 |
 |
| Parameter | Plot |
|---|---|
| CZT HV Monitor | 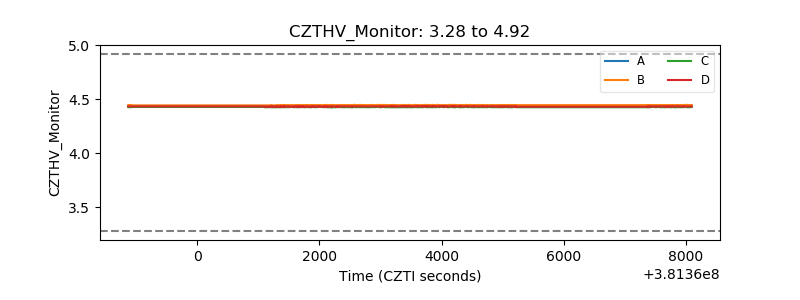 |
| D_VDD | 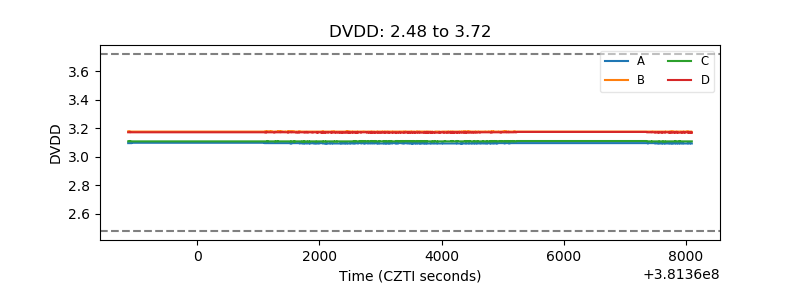 |
| Temperature 1 | 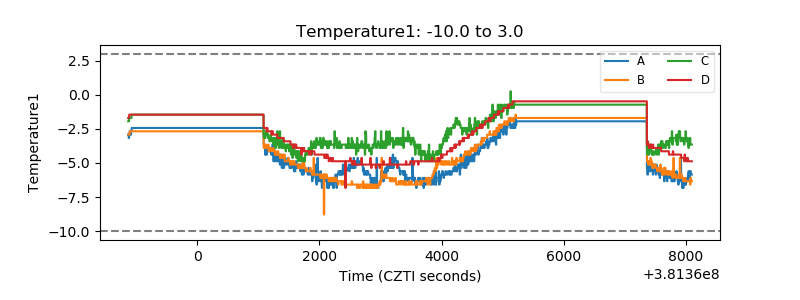 |
| Veto HV Monitor | 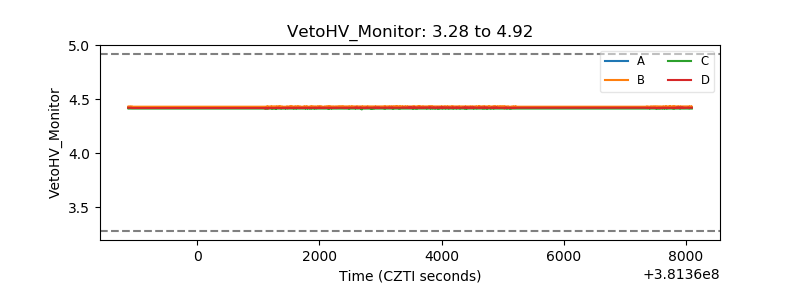 |
| Veto LLD | 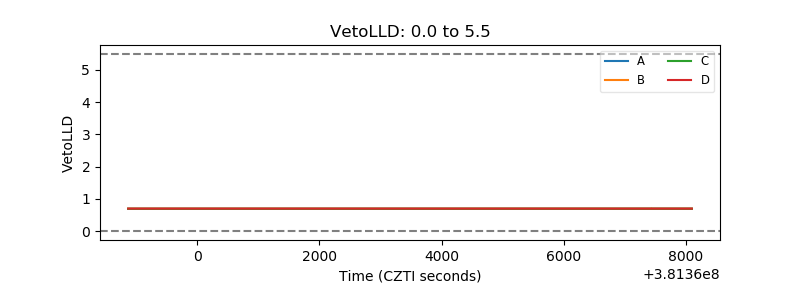 |
| Alpha Counter | 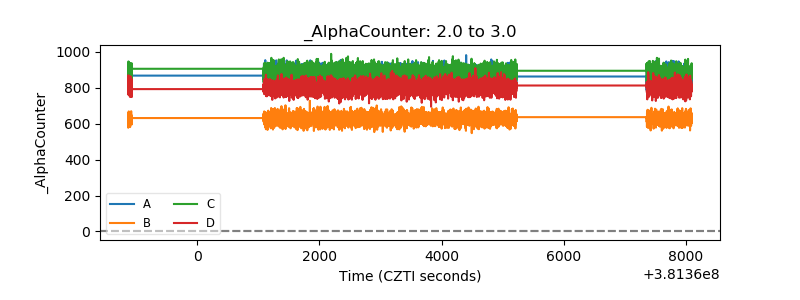 |
| _CPM_Rate | 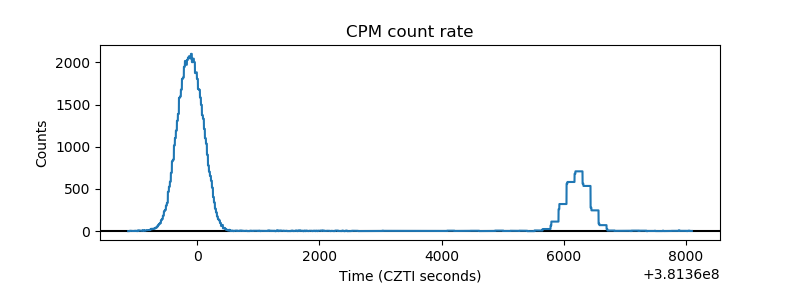 |
| CZT Counter | 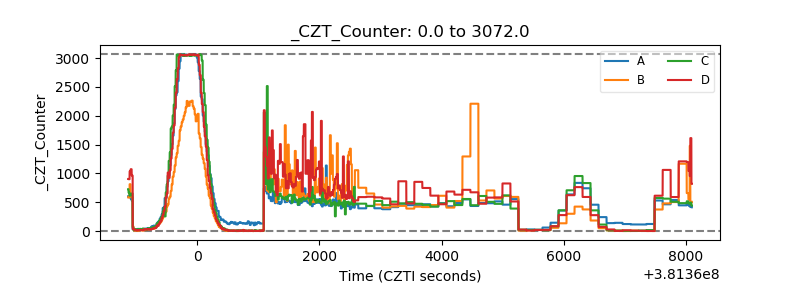 |
| +2.5 Volts monitor | 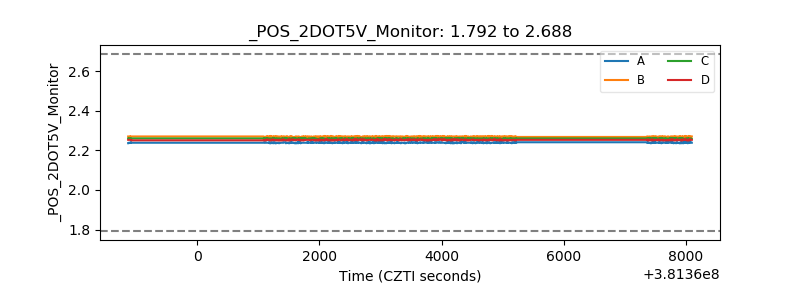 |
| +5 Volts monitor |  |
| _ROLL_ROT | 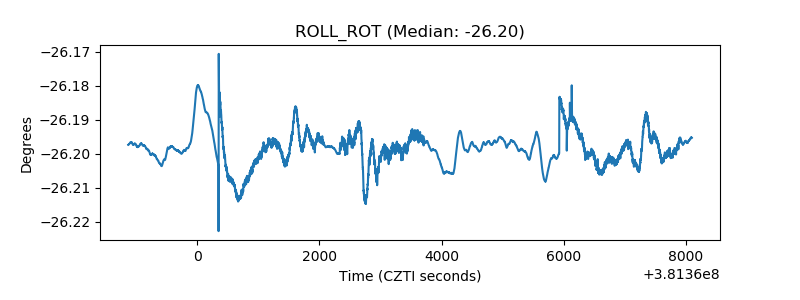 |
| _Roll_DEC | 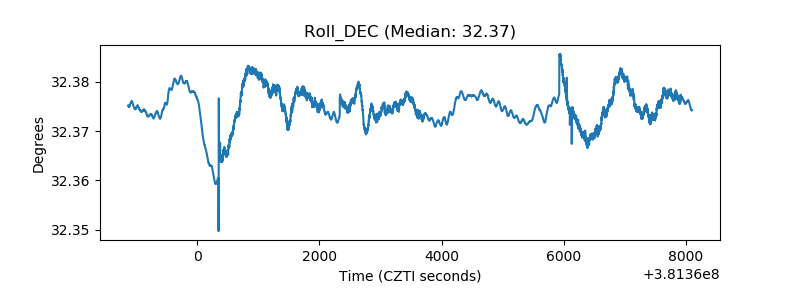 |
| _Roll_RA | 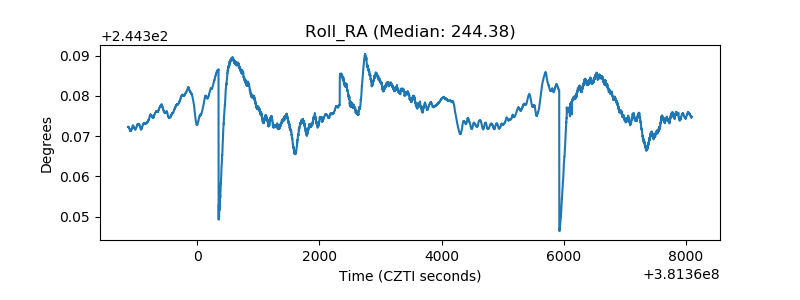 |
| Veto Counter | 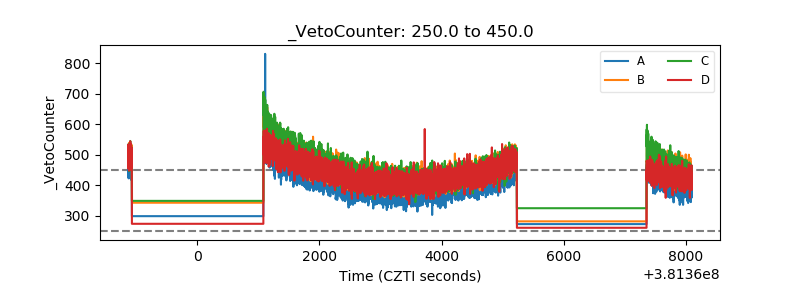 |