| Param | Original file | Final file |
|---|---|---|
| Filename | modeM0/AS1A11_047T07_9000004892_34307cztM0_level2.evt | modeM0/AS1A11_047T07_9000004892_34307cztM0_level2_quad_clean.evt |
| Size (bytes) | 455,699,520 | 82,722,240 |
| Size | 434.6 MB | 78.9 MB |
| Events in quadrant A | 2,445,511 | 543,760 |
| Events in quadrant B | 3,664,859 | 541,505 |
| Events in quadrant C | 2,744,589 | 562,033 |
| Events in quadrant D | 4,620,801 | 521,250 |
| Mode M0 | |||
|---|---|---|---|
| Quadrant | BADHDUFLAG | Total packets | Discarded packets |
| A | 0 | 10141 | 3 |
| B | 0 | 14162 | 2 |
| C | 0 | 11019 | 2 |
| D | 0 | 17052 | 2 |
| Mode M9 | |||
|---|---|---|---|
| Quadrant | BADHDUFLAG | Total packets | Discarded packets |
| A | 0 | 34 | 0 |
| B | 0 | 34 | 0 |
| C | 0 | 34 | 0 |
| D | 0 | 35 | 0 |
| Mode SS | |||
|---|---|---|---|
| Quadrant | BADHDUFLAG | Total packets | Discarded packets |
| A | 0 | 100 | 0 |
| B | 0 | 100 | 0 |
| C | 0 | 100 | 0 |
| D | 0 | 100 | 0 |
| Quadrant | Total seconds | Saturated seconds | Saturation percentage |
|---|---|---|---|
| A | 4787 | 9 | 0.188009% |
| B | 4787 | 227 | 4.742010% |
| C | 4787 | 45 | 0.940046% |
| D | 4787 | 385 | 8.042615% |
Noise dominated data is calculated using 1-second bins in cleaned event files. If a bin has >2000 counts, and if more than 50% of those come from <1% of pixels, then it is considered to be noise-dominated and hence unusable.
| Quadrant | # 1 sec bins | Bins with >0 counts | Bins with >2000 counts | High rate bins dominated by noise | Noise dominated (total time) | Noise dominated (detector-on time) | Marked lightcurve |
|---|---|---|---|---|---|---|---|
| A | 6939 | 4788 | 2 | 2 | 0.03% | 0.04% | 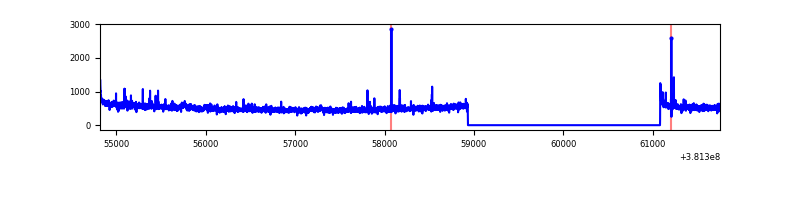 |
| B | 6939 | 4788 | 148 | 148 | 2.13% | 3.09% | 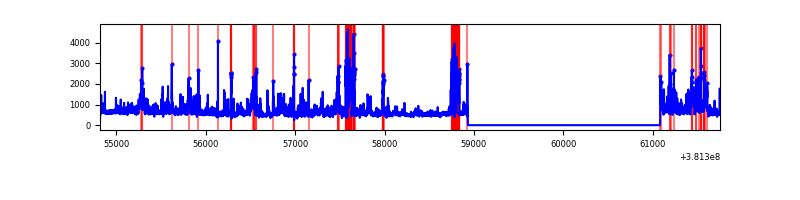 |
| C | 6939 | 4788 | 28 | 28 | 0.40% | 0.58% | 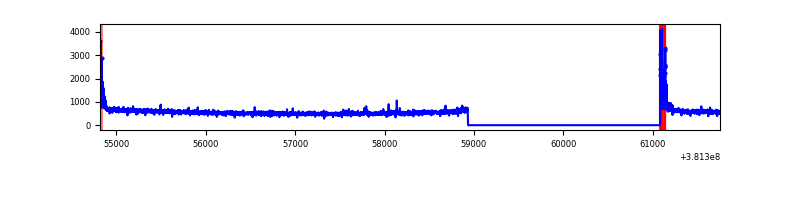 |
| D | 6939 | 4788 | 296 | 296 | 4.27% | 6.18% | 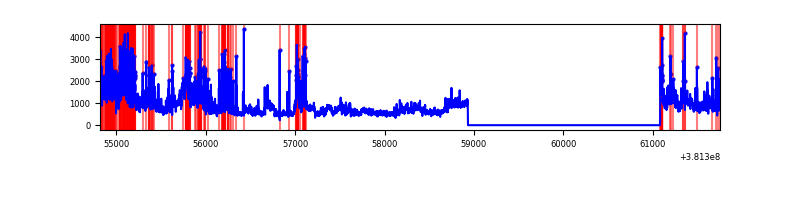 |
Top three noisy pixels from each quadrant. If the there are fewer than three noisy pixels in the level2.evt file, extra rows are filled as -1
| Pixel properties | Quadrant properties | ||||||
|---|---|---|---|---|---|---|---|
| Quadrant | DetID | PixID | Counts | Sigma | Mean | Median | Sigma |
| A | 10 | 83 | 29131 | 237.28 | 609 | 601 | 120.2 |
| A | 9 | 143 | 21283 | 172.01 | 609 | 601 | 120.2 |
| A | 0 | 127 | 15770 | 126.16 | 609 | 601 | 120.2 |
| B | 5 | 172 | 447094 | 3933.68 | 603 | 590 | 113.5 |
| B | 5 | 31 | 432878 | 3808.44 | 603 | 590 | 113.5 |
| B | 15 | 222 | 111945 | 981.03 | 603 | 590 | 113.5 |
| C | 15 | 214 | 204372 | 1467.59 | 606 | 615 | 138.8 |
| C | 0 | 10 | 117779 | 843.89 | 606 | 615 | 138.8 |
| C | 3 | 233 | 27546 | 193.97 | 606 | 615 | 138.8 |
| D | 12 | 235 | 876042 | 5894.12 | 582 | 570 | 148.5 |
| D | 8 | 195 | 599320 | 4031.09 | 582 | 570 | 148.5 |
| D | 10 | 118 | 436300 | 2933.56 | 582 | 570 | 148.5 |
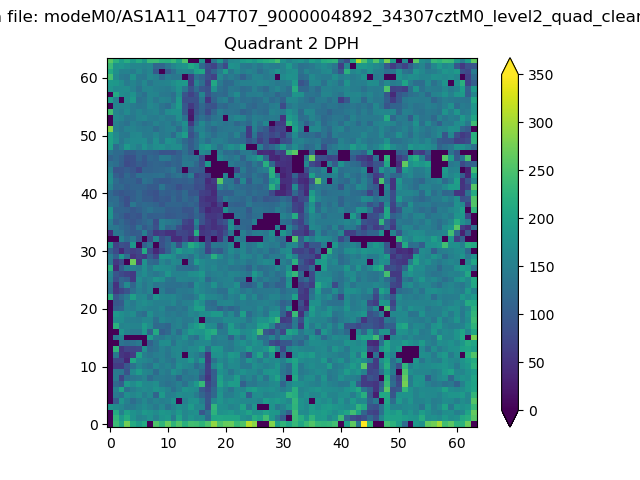
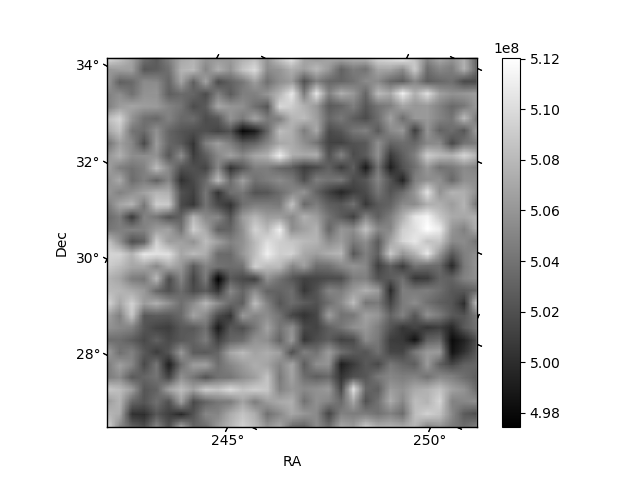
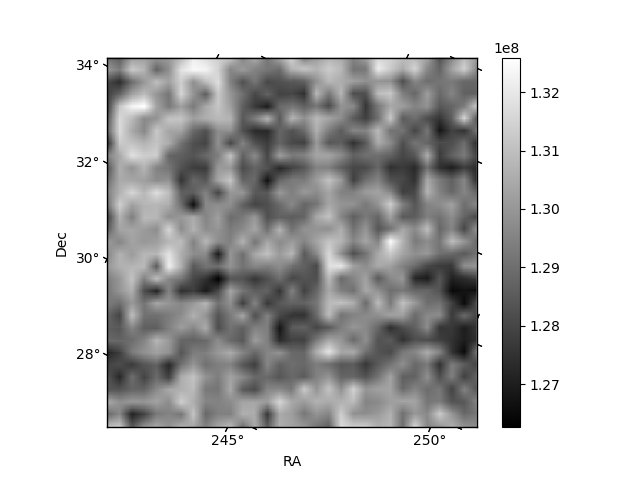
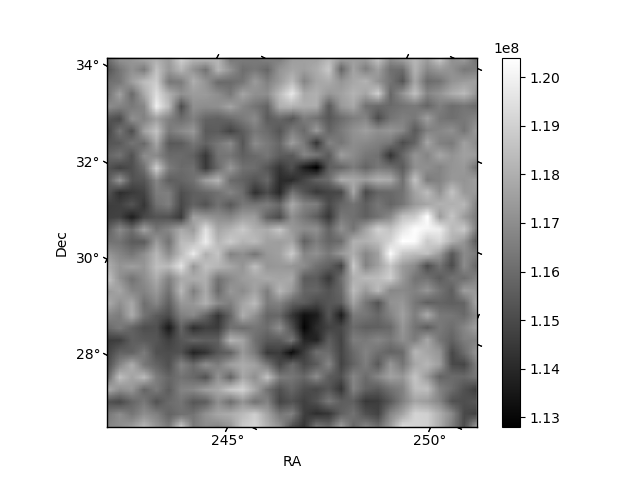
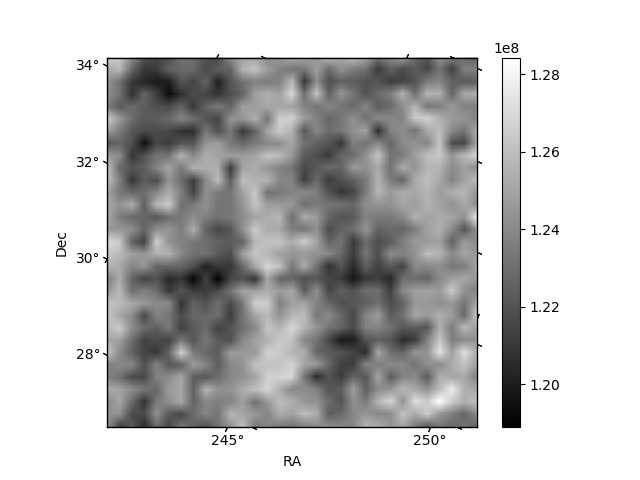
Histogram calculated using DETX and DETY for each event in the final _common_clean file
| Quadrant A | 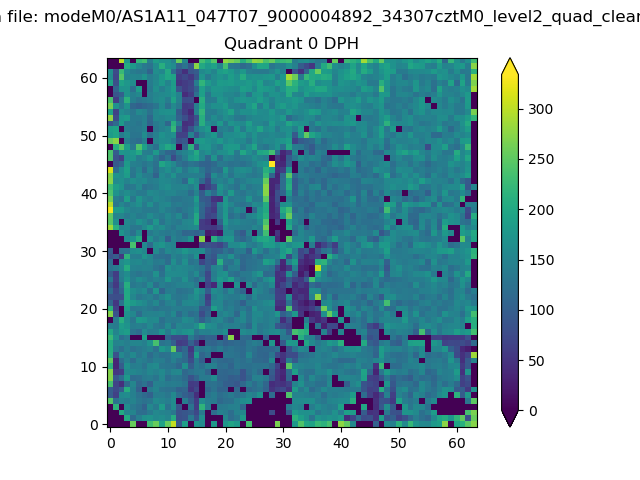 |
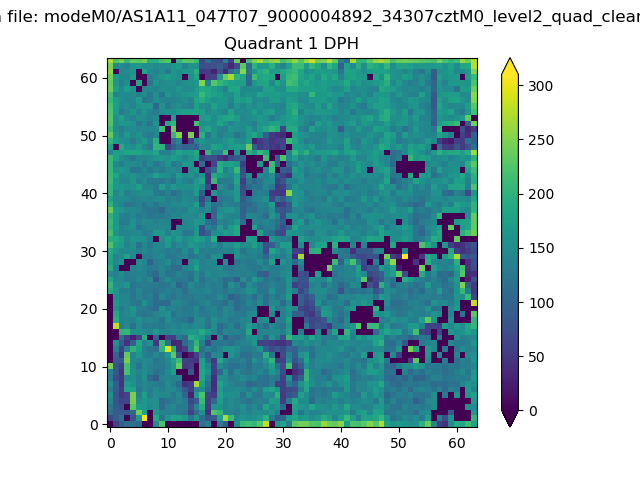 |
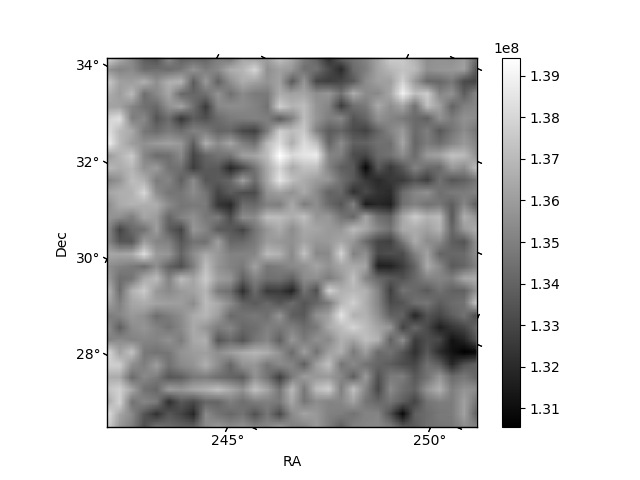
Quadrant B |
|---|---|---|---|
| Quadrant D | 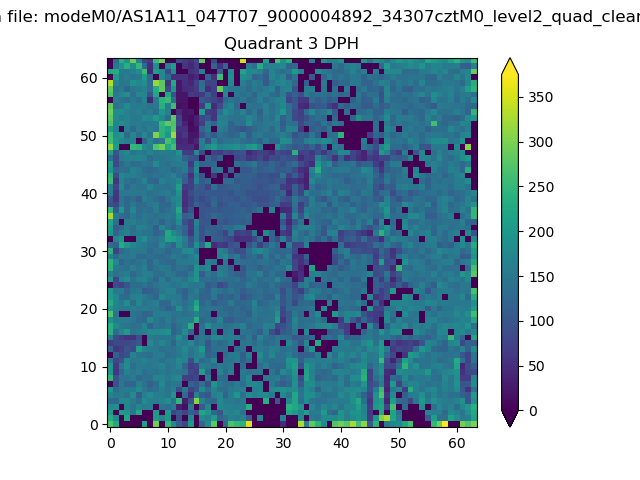 |
 |
Quadrant C |
| Plot type | Count rate plots | Images |
|---|---|---|
| Comparison with Poisson distribution Blue bars denote a histogram of data divided into 1 sec bins. Red curve is a Poisson curve with rate = median count rate of data. |
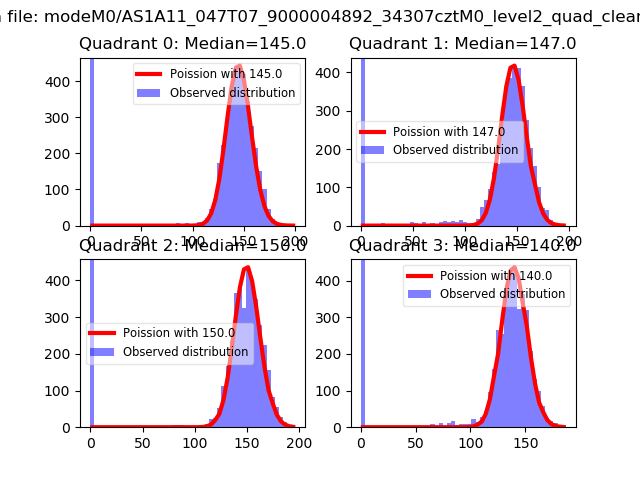 |
 |
| Quadrant-wise count rates Data is divided into 100 sec bins |
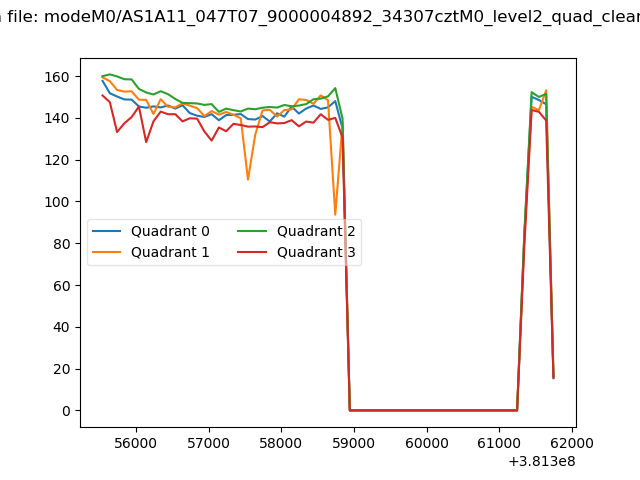 |
|
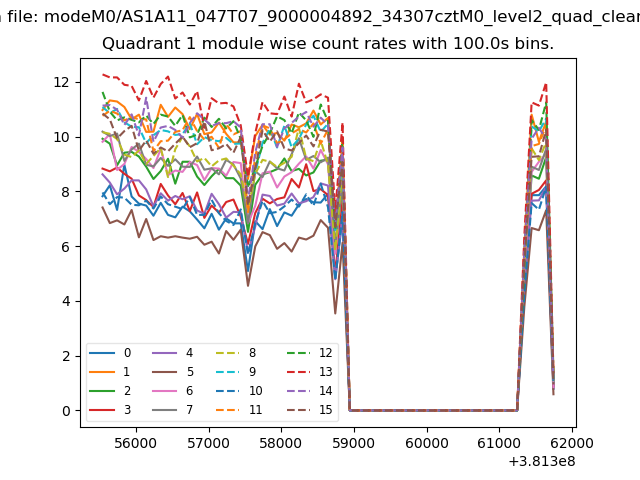
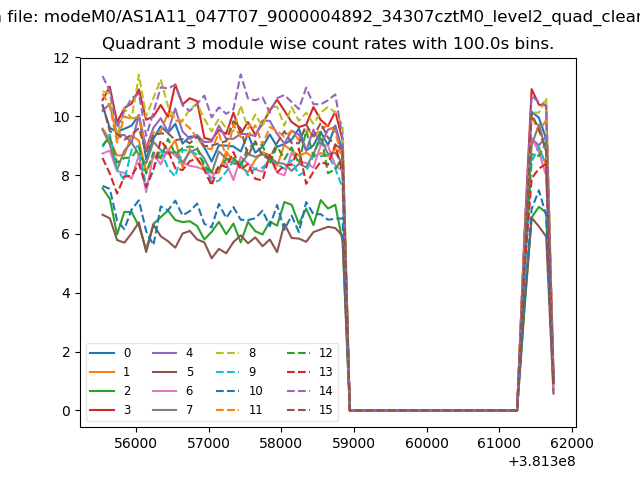
| Module-wise count rates for Quadrant A Data is divided into 100 sec bins |
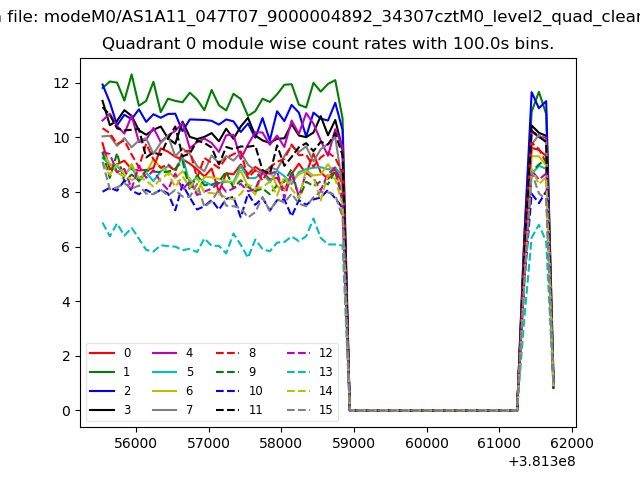 |
 |
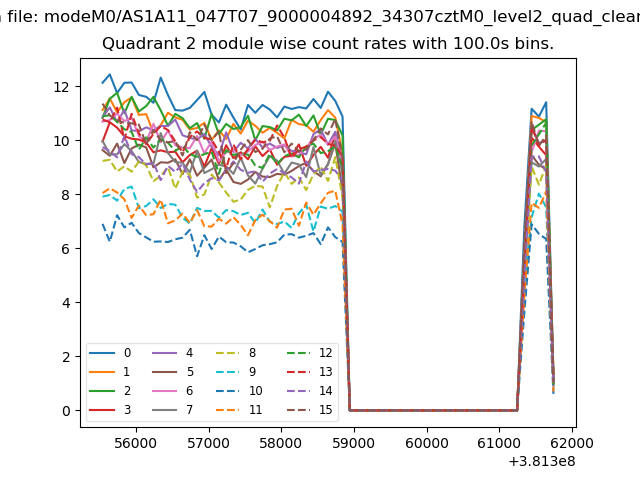
| Module-wise count rates for Quadrant B Data is divided into 100 sec bins |
 |
 |
| Module-wise count rates for Quadrant C Data is divided into 100 sec bins |
 |
 |
| Module-wise count rates for Quadrant D Data is divided into 100 sec bins |
 |
 |
| Parameter | Plot |
|---|---|
| CZT HV Monitor | 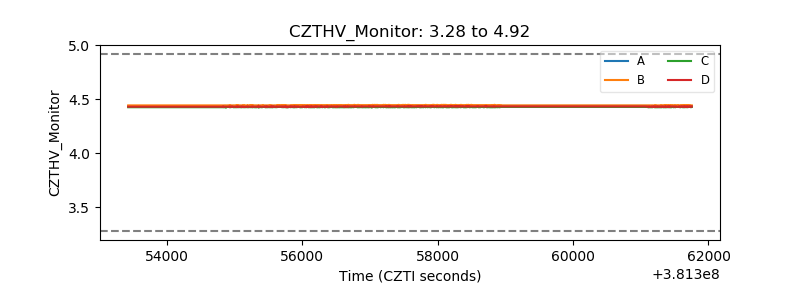 |
| D_VDD | 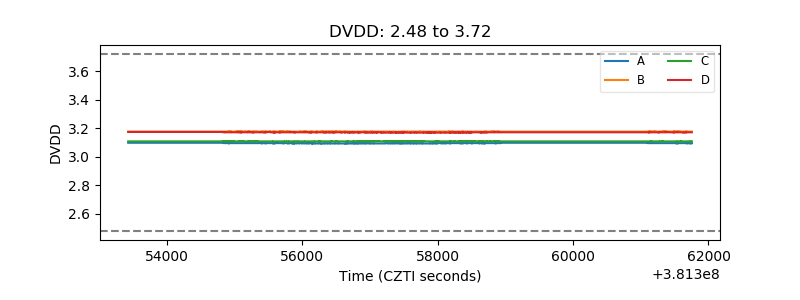 |
| Temperature 1 | 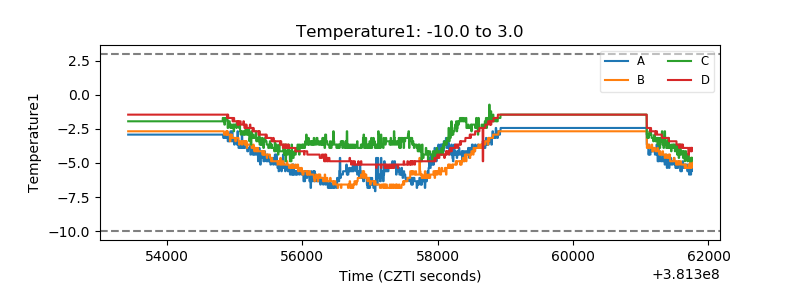 |
| Veto HV Monitor | 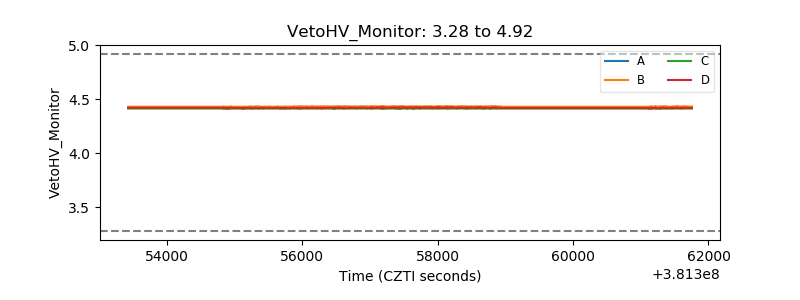 |
| Veto LLD | 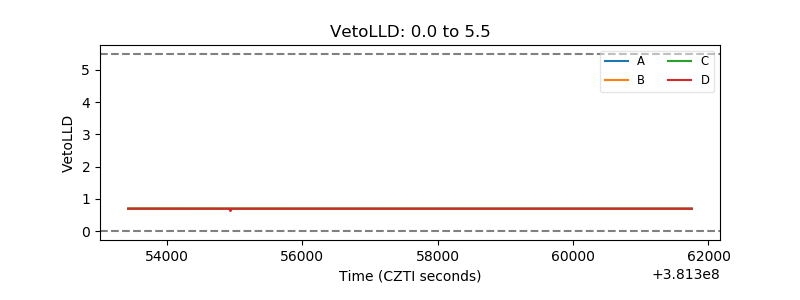 |
| Alpha Counter | 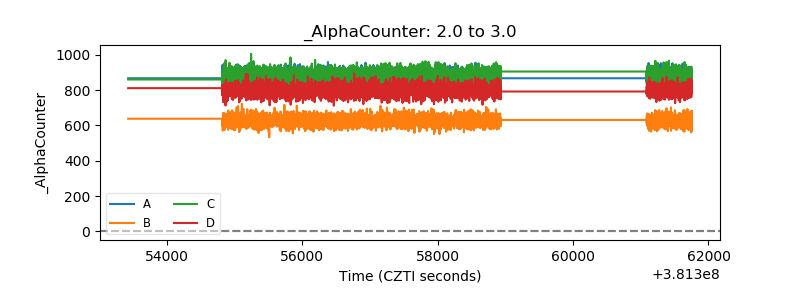 |
| _CPM_Rate | 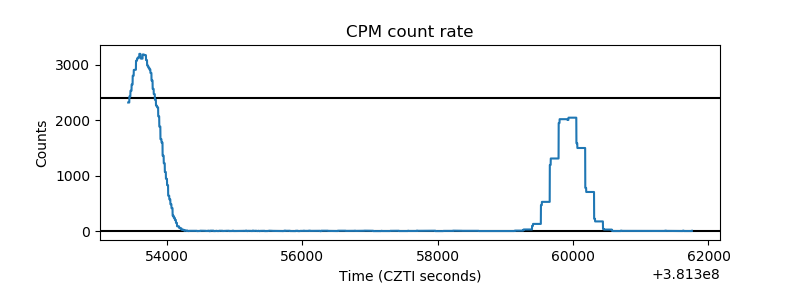 |
| CZT Counter | 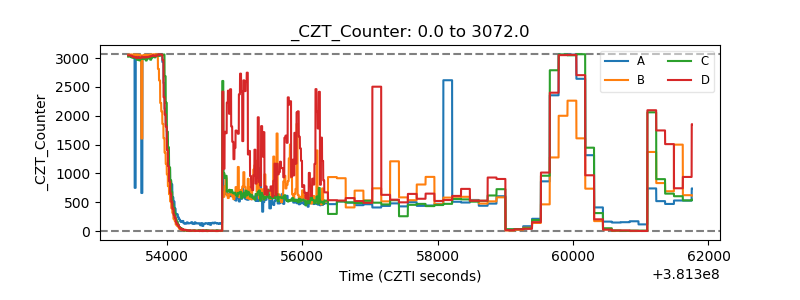 |
| +2.5 Volts monitor | 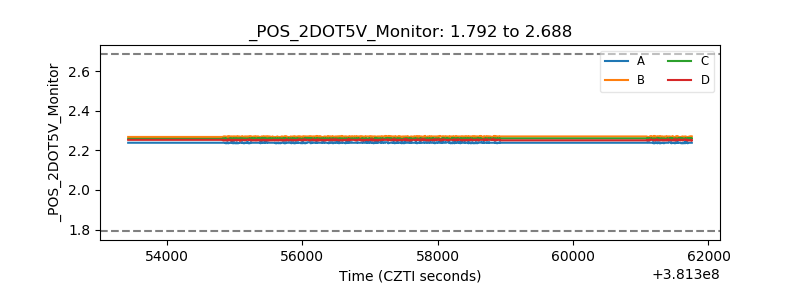 |
| +5 Volts monitor | 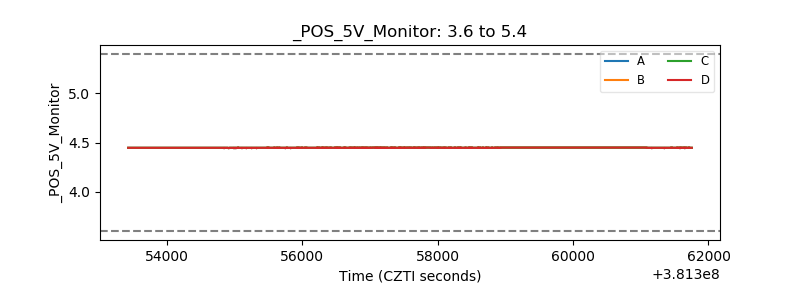 |
| _ROLL_ROT | 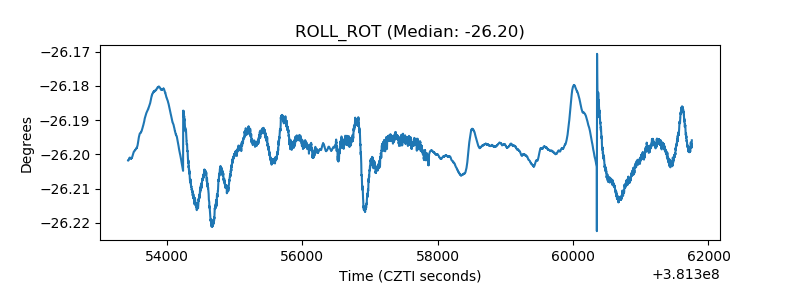 |
| _Roll_DEC | 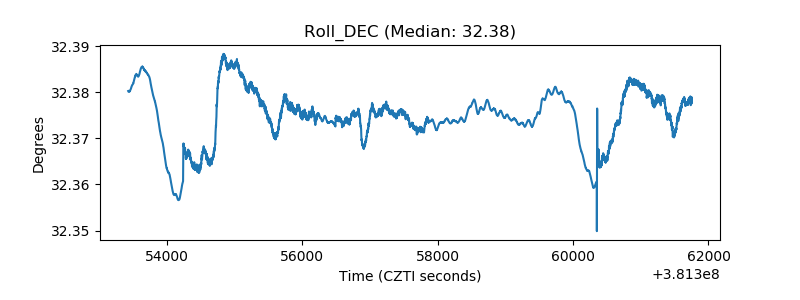 |
| _Roll_RA | 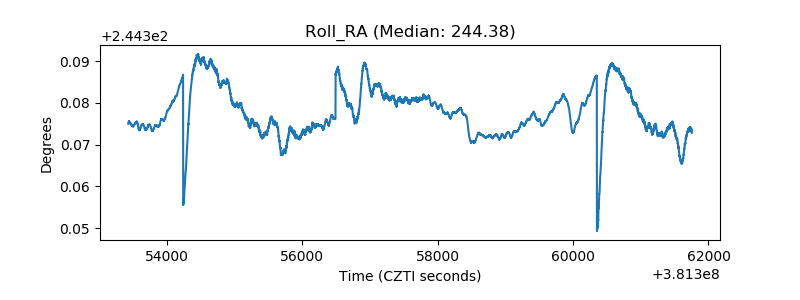 |
| Veto Counter | 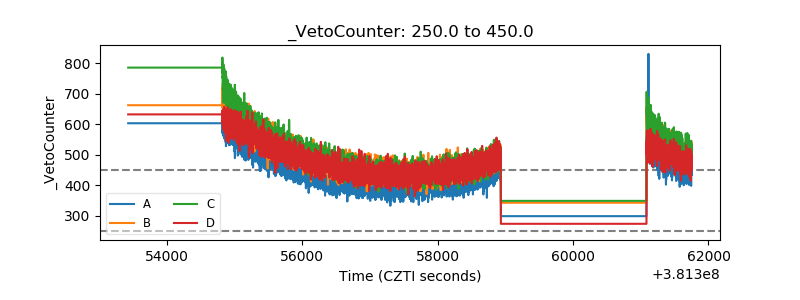 |