| Param | Original file | Final file |
|---|---|---|
| Filename | modeM0/AS1A11_047T07_9000004892_34306cztM0_level2.evt | modeM0/AS1A11_047T07_9000004892_34306cztM0_level2_quad_clean.evt |
| Size (bytes) | 498,962,880 | 69,001,920 |
| Size | 475.8 MB | 65.8 MB |
| Events in quadrant A | 2,618,315 | 441,403 |
| Events in quadrant B | 3,926,179 | 433,067 |
| Events in quadrant C | 2,817,645 | 454,131 |
| Events in quadrant D | 5,420,873 | 420,390 |
| Mode M0 | |||
|---|---|---|---|
| Quadrant | BADHDUFLAG | Total packets | Discarded packets |
| A | 0 | 10815 | 3 |
| B | 0 | 15128 | 2 |
| C | 0 | 11418 | 2 |
| D | 0 | 19539 | 2 |
| Mode M9 | |||
|---|---|---|---|
| Quadrant | BADHDUFLAG | Total packets | Discarded packets |
| A | 0 | 36 | 0 |
| B | 0 | 36 | 0 |
| C | 0 | 36 | 0 |
| D | 0 | 37 | 0 |
| Mode SS | |||
|---|---|---|---|
| Quadrant | BADHDUFLAG | Total packets | Discarded packets |
| A | 0 | 98 | 0 |
| B | 0 | 98 | 0 |
| C | 0 | 98 | 0 |
| D | 0 | 98 | 0 |
| Quadrant | Total seconds | Saturated seconds | Saturation percentage |
|---|---|---|---|
| A | 4853 | 22 | 0.453328% |
| B | 4853 | 254 | 5.233876% |
| C | 4853 | 23 | 0.473934% |
| D | 4853 | 410 | 8.448382% |
Noise dominated data is calculated using 1-second bins in cleaned event files. If a bin has >2000 counts, and if more than 50% of those come from <1% of pixels, then it is considered to be noise-dominated and hence unusable.
| Quadrant | # 1 sec bins | Bins with >0 counts | Bins with >2000 counts | High rate bins dominated by noise | Noise dominated (total time) | Noise dominated (detector-on time) | Marked lightcurve |
|---|---|---|---|---|---|---|---|
| A | 6947 | 4854 | 6 | 6 | 0.09% | 0.12% | 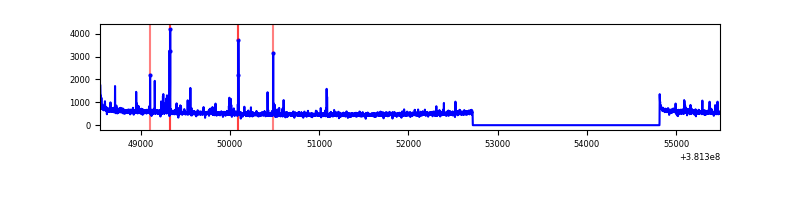 |
| B | 6947 | 4854 | 173 | 173 | 2.49% | 3.56% | 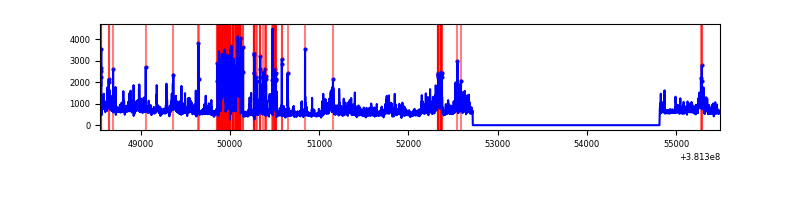 |
| C | 6947 | 4854 | 7 | 7 | 0.10% | 0.14% | 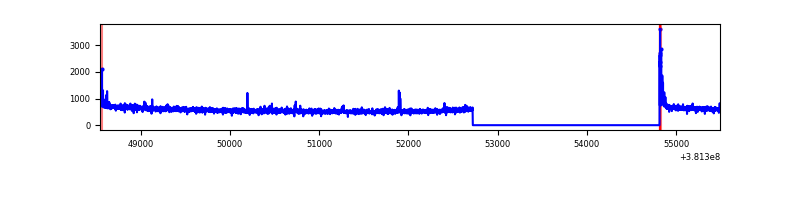 |
| D | 6947 | 4854 | 309 | 309 | 4.45% | 6.37% | 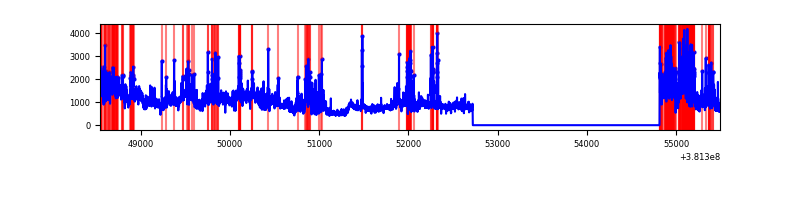 |
Top three noisy pixels from each quadrant. If the there are fewer than three noisy pixels in the level2.evt file, extra rows are filled as -1
| Pixel properties | Quadrant properties | ||||||
|---|---|---|---|---|---|---|---|
| Quadrant | DetID | PixID | Counts | Sigma | Mean | Median | Sigma |
| A | 9 | 143 | 52041 | 401.61 | 641 | 632 | 128.0 |
| A | 7 | 16 | 47486 | 366.02 | 641 | 632 | 128.0 |
| A | 10 | 83 | 29804 | 227.89 | 641 | 632 | 128.0 |
| B | 5 | 172 | 608426 | 5124.52 | 633 | 617 | 118.6 |
| B | 5 | 31 | 424415 | 3573.1 | 633 | 617 | 118.6 |
| B | 0 | 229 | 160536 | 1348.3 | 633 | 617 | 118.6 |
| C | 15 | 214 | 207060 | 1420.69 | 639 | 646 | 145.3 |
| C | 0 | 10 | 65800 | 448.44 | 639 | 646 | 145.3 |
| C | 3 | 233 | 13570 | 88.95 | 639 | 646 | 145.3 |
| D | 8 | 195 | 981932 | 6440.11 | 615 | 603 | 152.4 |
| D | 12 | 235 | 864806 | 5671.45 | 615 | 603 | 152.4 |
| D | 10 | 118 | 472315 | 3095.68 | 615 | 603 | 152.4 |
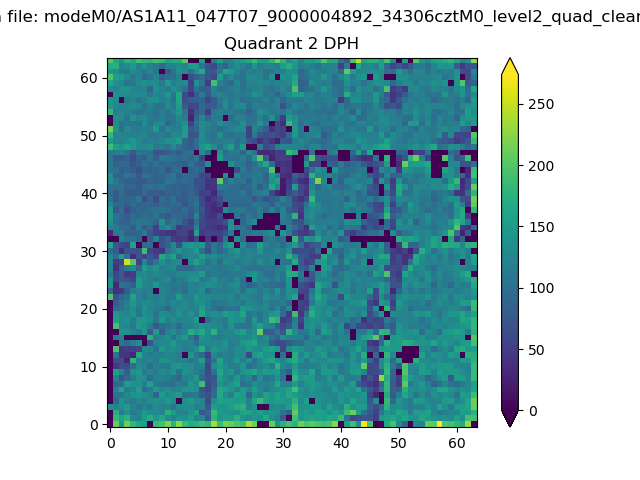
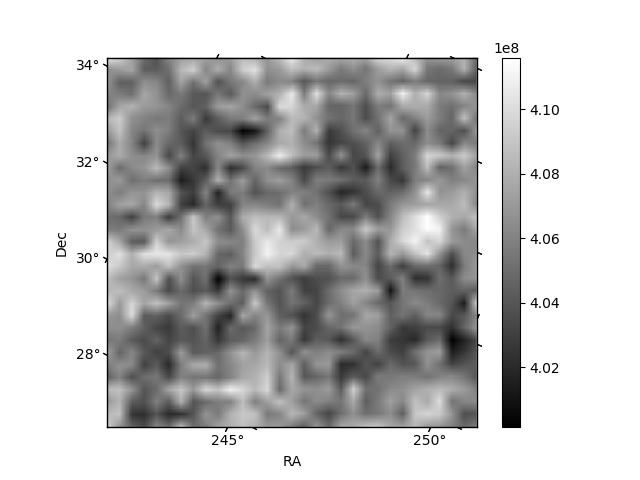
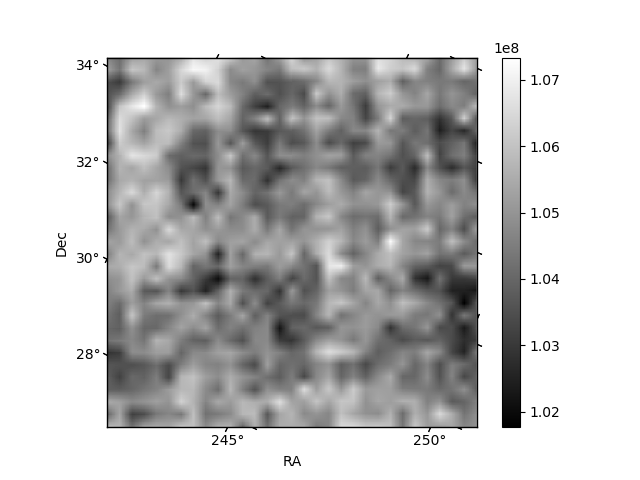
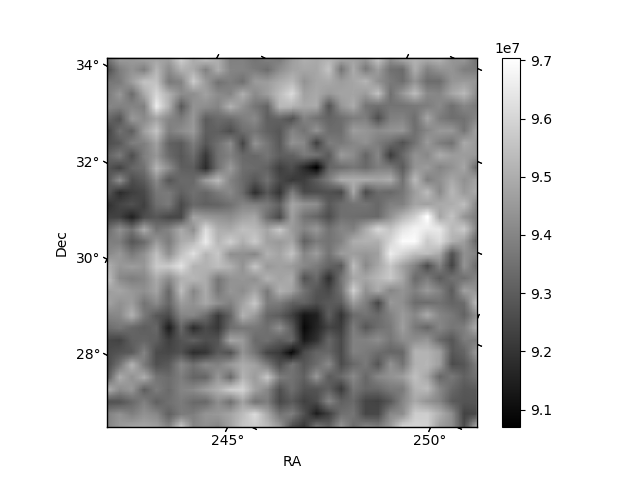
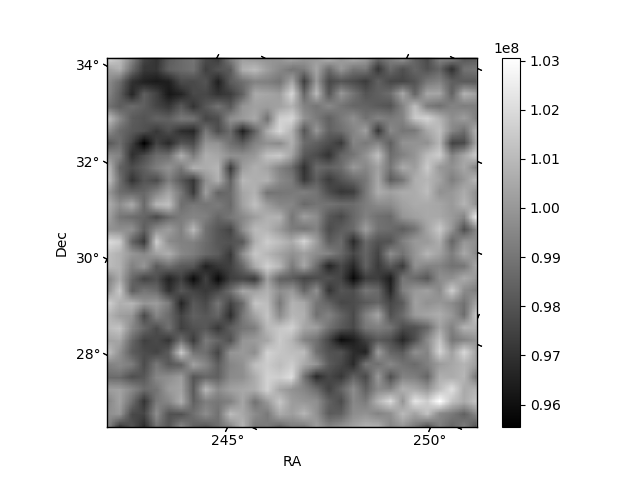
Histogram calculated using DETX and DETY for each event in the final _common_clean file
| Quadrant A | 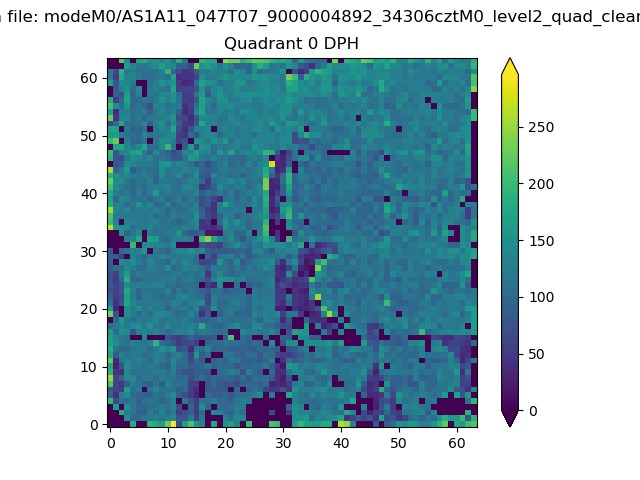 |
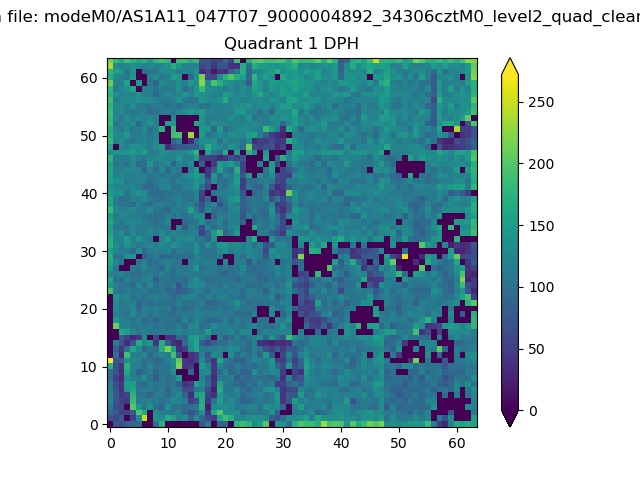 |
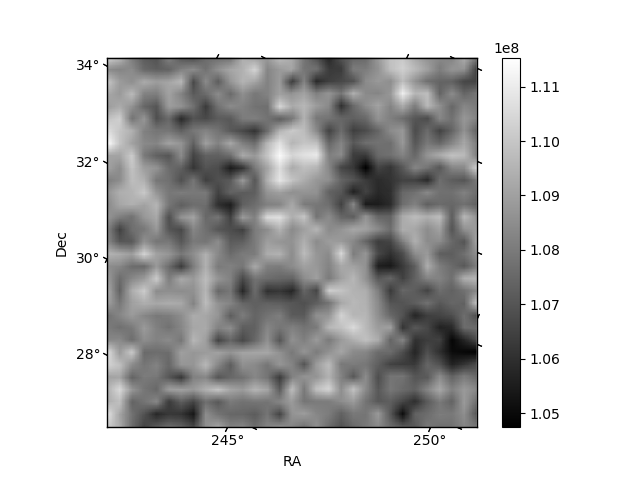
Quadrant B |
|---|---|---|---|
| Quadrant D | 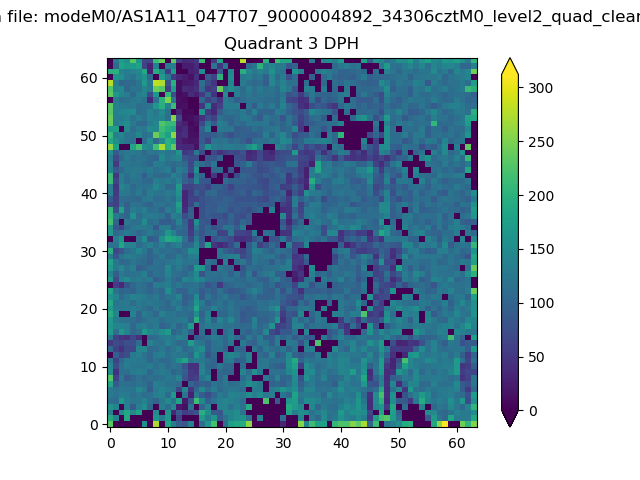 |
 |
Quadrant C |
| Plot type | Count rate plots | Images |
|---|---|---|
| Comparison with Poisson distribution Blue bars denote a histogram of data divided into 1 sec bins. Red curve is a Poisson curve with rate = median count rate of data. |
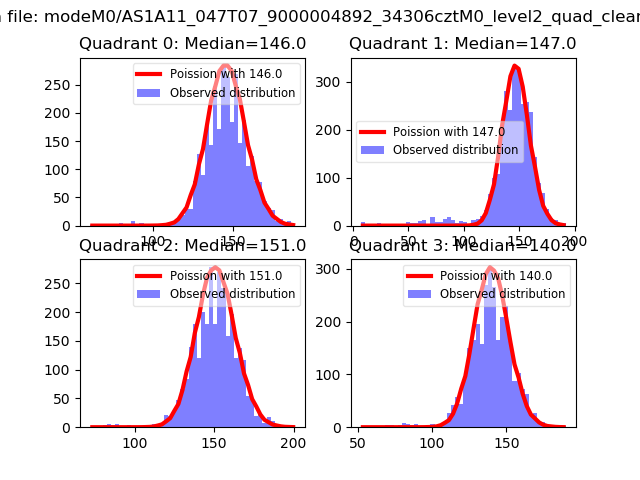 |
 |
| Quadrant-wise count rates Data is divided into 100 sec bins |
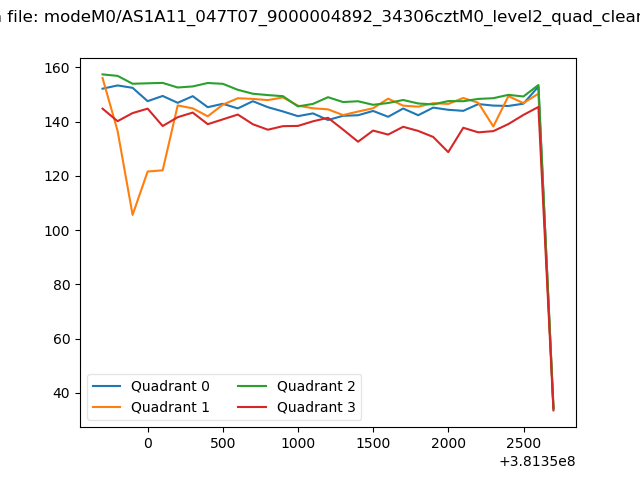 |
|
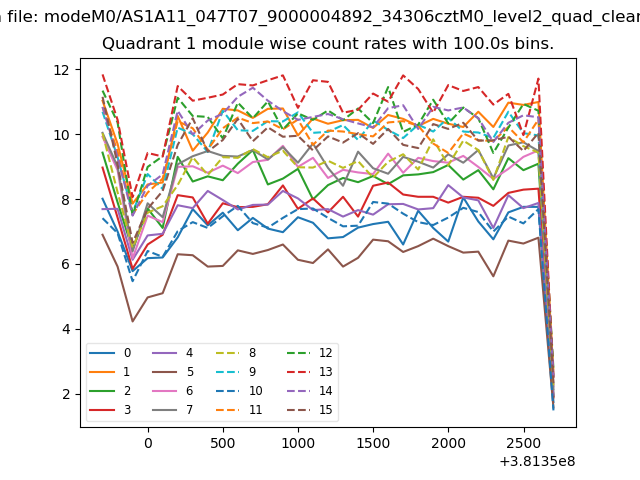
| Module-wise count rates for Quadrant A Data is divided into 100 sec bins |
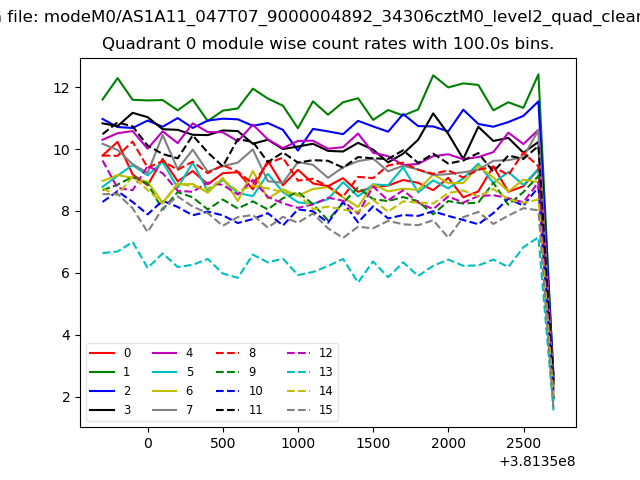 |
 |
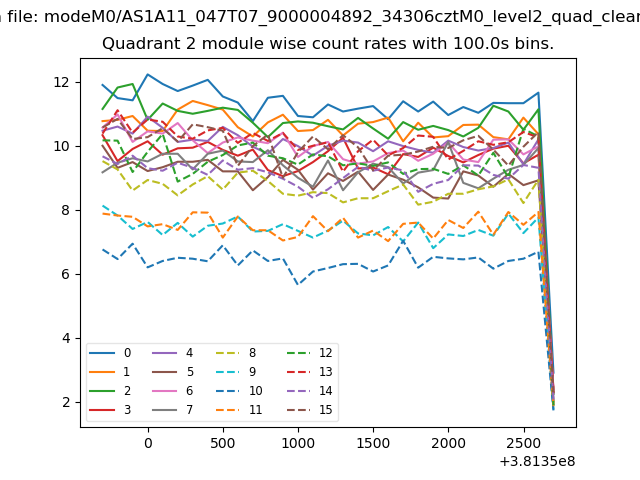
| Module-wise count rates for Quadrant B Data is divided into 100 sec bins |
 |
 |
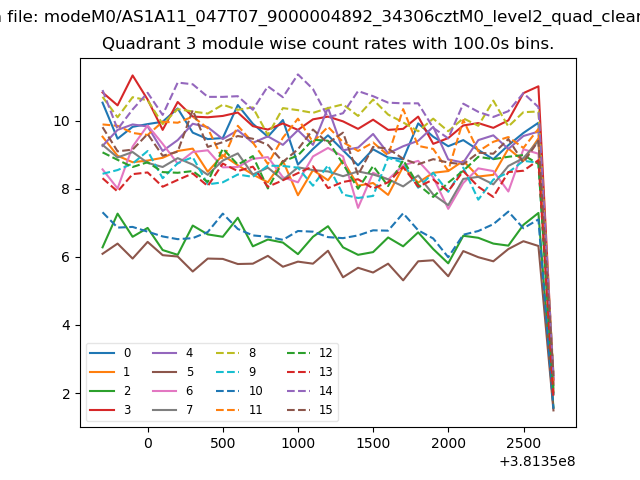
| Module-wise count rates for Quadrant C Data is divided into 100 sec bins |
 |
 |
| Module-wise count rates for Quadrant D Data is divided into 100 sec bins |
 |
 |
| Parameter | Plot |
|---|---|
| CZT HV Monitor |  |
| D_VDD | 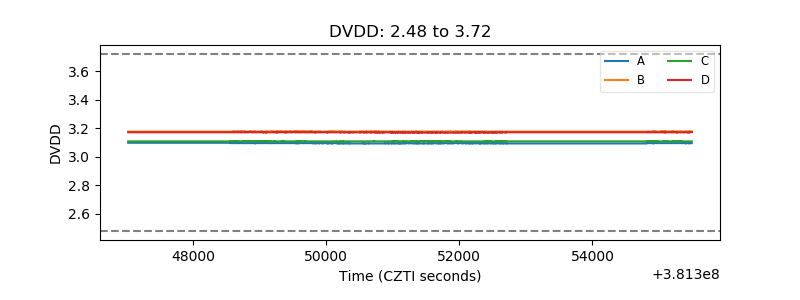 |
| Temperature 1 | 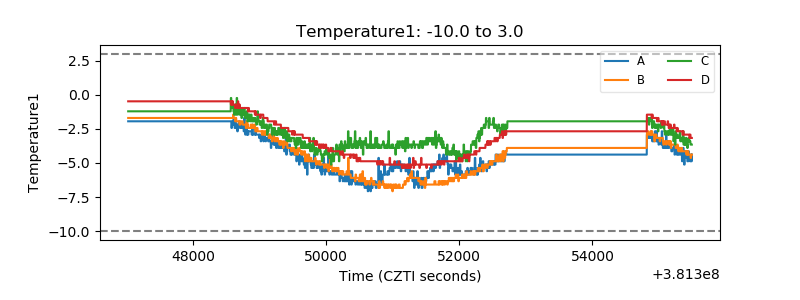 |
| Veto HV Monitor | 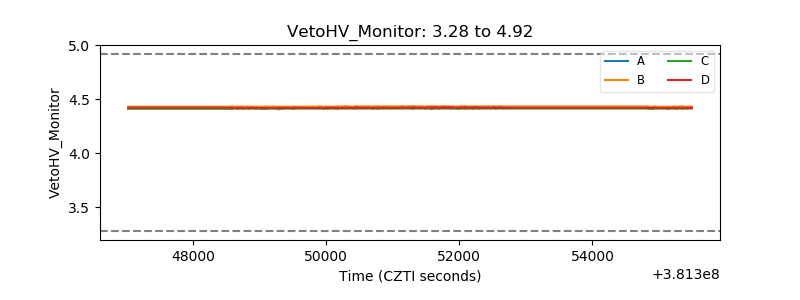 |
| Veto LLD | 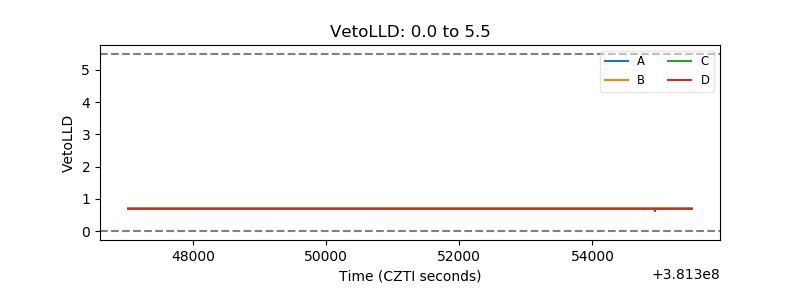 |
| Alpha Counter | 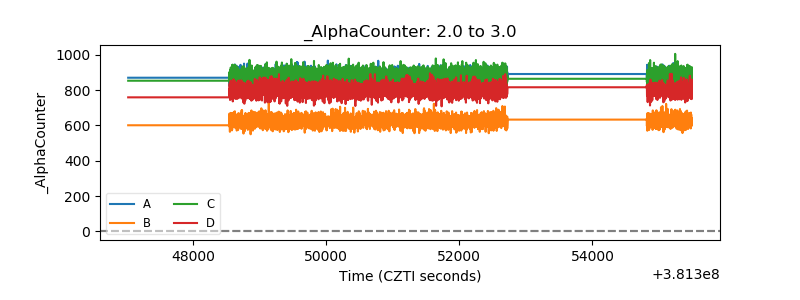 |
| _CPM_Rate | 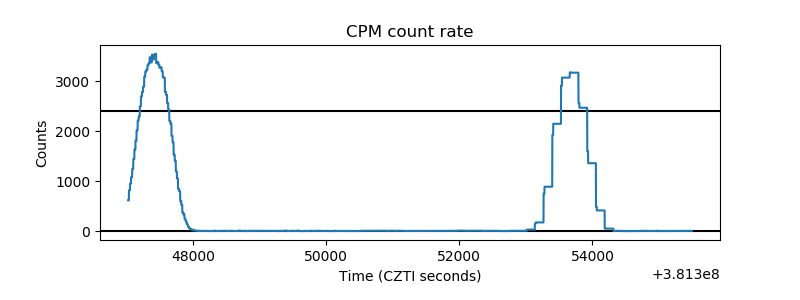 |
| CZT Counter | 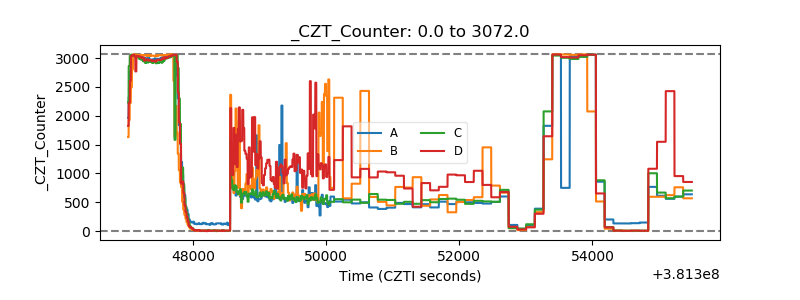 |
| +2.5 Volts monitor | 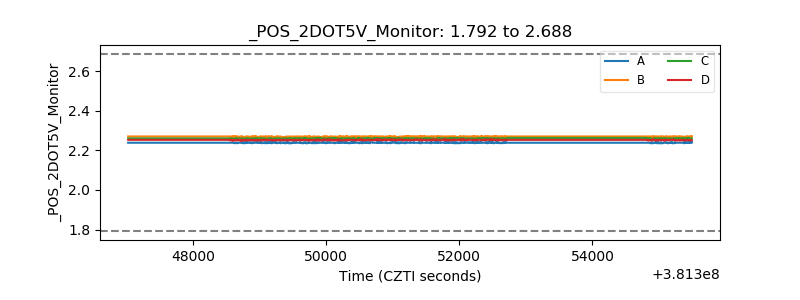 |
| +5 Volts monitor | 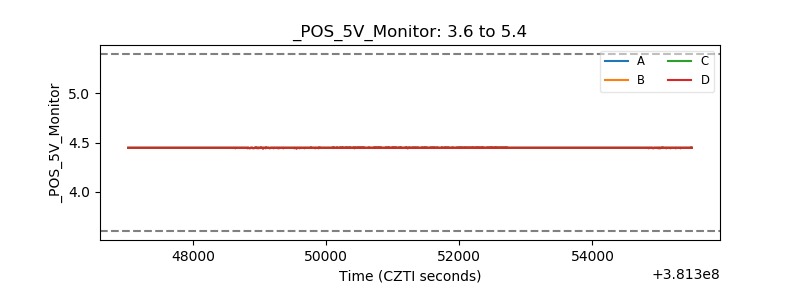 |
| _ROLL_ROT | 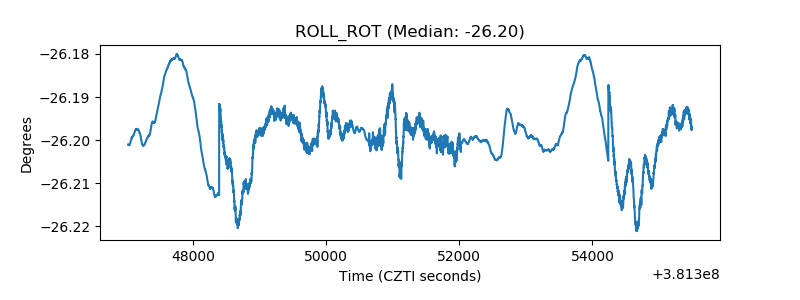 |
| _Roll_DEC | 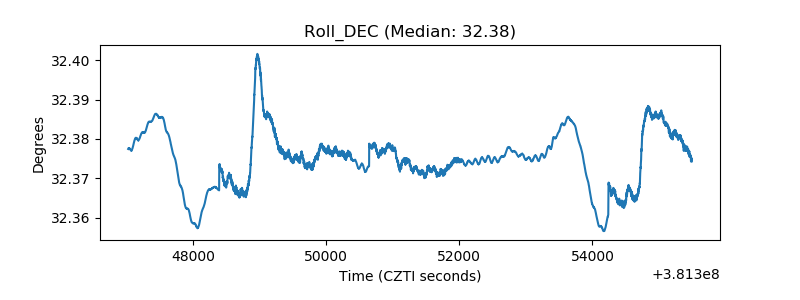 |
| _Roll_RA | 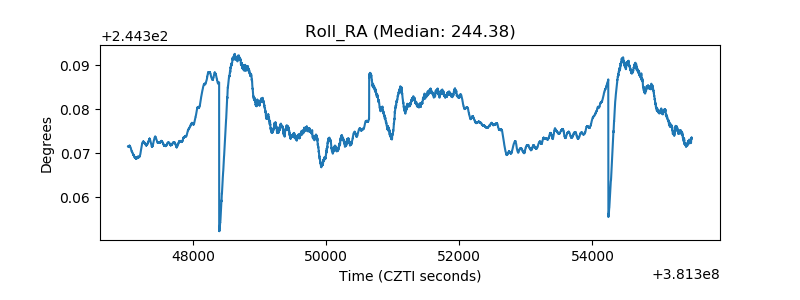 |
| Veto Counter | 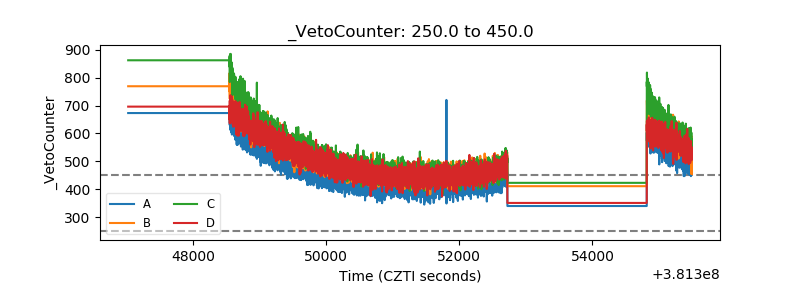 |