| Param | Original file | Final file |
|---|---|---|
| Filename | modeM0/AS1T04_086T01_9000004890_34291cztM0_level2.evt | modeM0/AS1T04_086T01_9000004890_34291cztM0_level2_quad_clean.evt |
| Size (bytes) | 453,617,280 | 70,364,160 |
| Size | 432.6 MB | 67.1 MB |
| Events in quadrant A | 2,494,659 | 446,448 |
| Events in quadrant B | 3,246,009 | 457,070 |
| Events in quadrant C | 2,808,065 | 454,813 |
| Events in quadrant D | 4,849,235 | 420,737 |
| Mode M0 | |||
|---|---|---|---|
| Quadrant | BADHDUFLAG | Total packets | Discarded packets |
| A | 0 | 10450 | 3 |
| B | 0 | 12792 | 2 |
| C | 0 | 11141 | 2 |
| D | 0 | 17981 | 2 |
| Mode SS | |||
|---|---|---|---|
| Quadrant | BADHDUFLAG | Total packets | Discarded packets |
| A | 0 | 100 | 0 |
| B | 0 | 100 | 0 |
| C | 0 | 100 | 0 |
| D | 0 | 100 | 0 |
| Mode M9 | |||
|---|---|---|---|
| Quadrant | BADHDUFLAG | Total packets | Discarded packets |
| A | 0 | 31 | 0 |
| B | 0 | 31 | 0 |
| C | 0 | 31 | 0 |
| D | 0 | 32 | 0 |
| Quadrant | Total seconds | Saturated seconds | Saturation percentage |
|---|---|---|---|
| A | 5022 | 14 | 0.278773% |
| B | 5022 | 88 | 1.752290% |
| C | 5022 | 40 | 0.796495% |
| D | 5022 | 210 | 4.181601% |
Noise dominated data is calculated using 1-second bins in cleaned event files. If a bin has >2000 counts, and if more than 50% of those come from <1% of pixels, then it is considered to be noise-dominated and hence unusable.
| Quadrant | # 1 sec bins | Bins with >0 counts | Bins with >2000 counts | High rate bins dominated by noise | Noise dominated (total time) | Noise dominated (detector-on time) | Marked lightcurve |
|---|---|---|---|---|---|---|---|
| A | 7056 | 5023 | 5 | 5 | 0.07% | 0.10% | 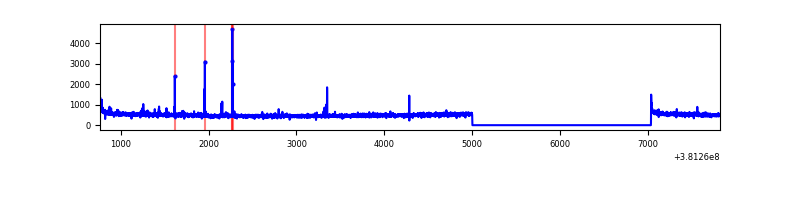 |
| B | 7056 | 5023 | 65 | 65 | 0.92% | 1.29% | 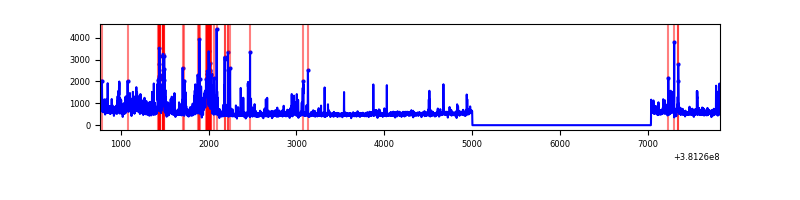 |
| C | 7056 | 5023 | 28 | 28 | 0.40% | 0.56% | 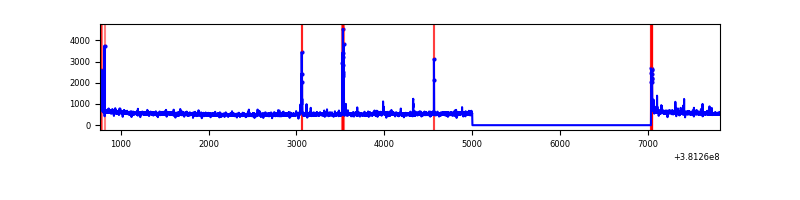 |
| D | 7056 | 5023 | 203 | 203 | 2.88% | 4.04% | 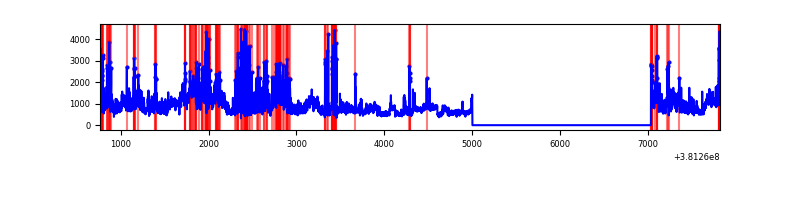 |
Top three noisy pixels from each quadrant. If the there are fewer than three noisy pixels in the level2.evt file, extra rows are filled as -1
| Pixel properties | Quadrant properties | ||||||
|---|---|---|---|---|---|---|---|
| Quadrant | DetID | PixID | Counts | Sigma | Mean | Median | Sigma |
| A | 9 | 143 | 31220 | 247.36 | 622 | 612 | 123.7 |
| A | 10 | 83 | 28559 | 225.86 | 622 | 612 | 123.7 |
| A | 7 | 16 | 12760 | 98.18 | 622 | 612 | 123.7 |
| B | 5 | 172 | 369975 | 3179.62 | 627 | 613 | 116.2 |
| B | 4 | 251 | 147255 | 1262.35 | 627 | 613 | 116.2 |
| B | 15 | 222 | 95271 | 814.85 | 627 | 613 | 116.2 |
| C | 15 | 214 | 220625 | 1542.01 | 623 | 629 | 142.7 |
| C | 15 | 159 | 70487 | 489.65 | 623 | 629 | 142.7 |
| C | 0 | 10 | 60520 | 419.79 | 623 | 629 | 142.7 |
| D | 8 | 195 | 898957 | 5757.72 | 607 | 597 | 156.0 |
| D | 7 | 223 | 869704 | 5570.23 | 607 | 597 | 156.0 |
| D | 12 | 235 | 412238 | 2638.27 | 607 | 597 | 156.0 |
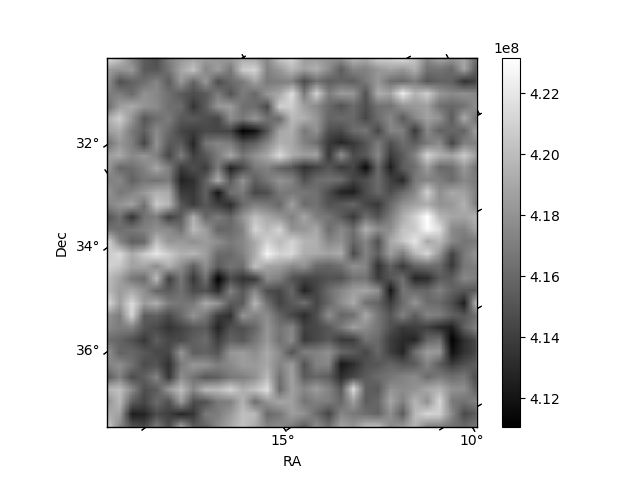
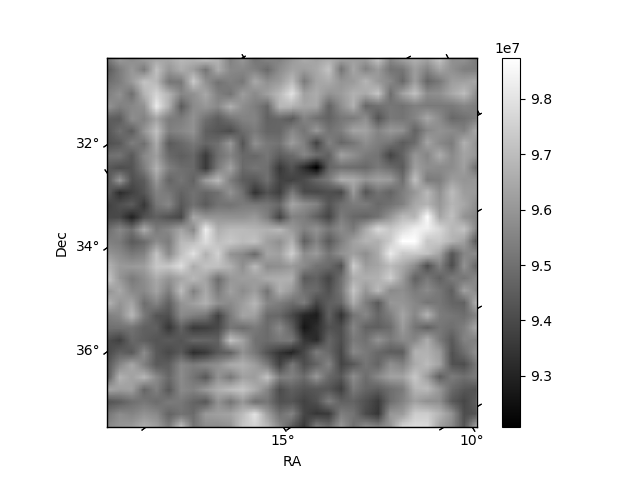
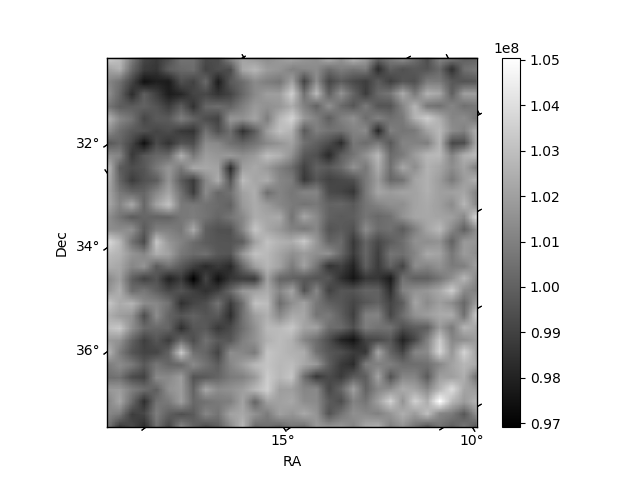
Histogram calculated using DETX and DETY for each event in the final _common_clean file
| Quadrant A | 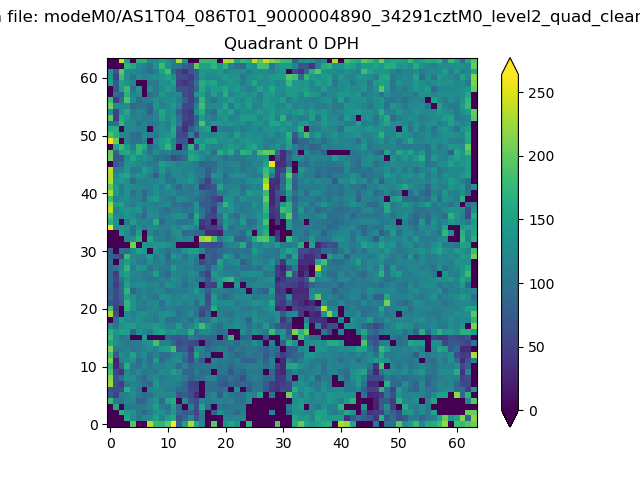 |
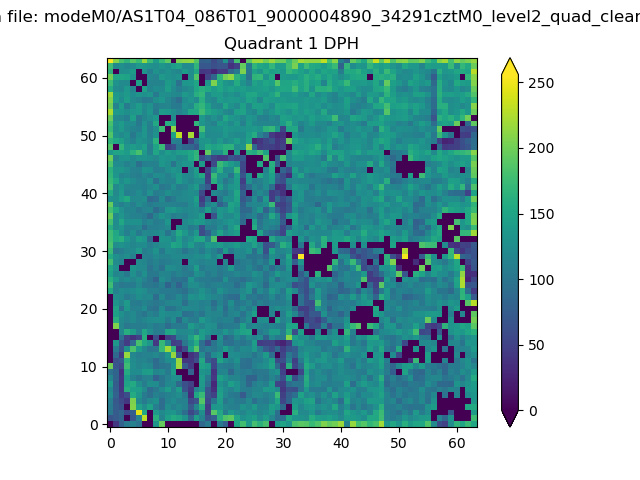 |
Quadrant B |
|---|---|---|---|
| Quadrant D | 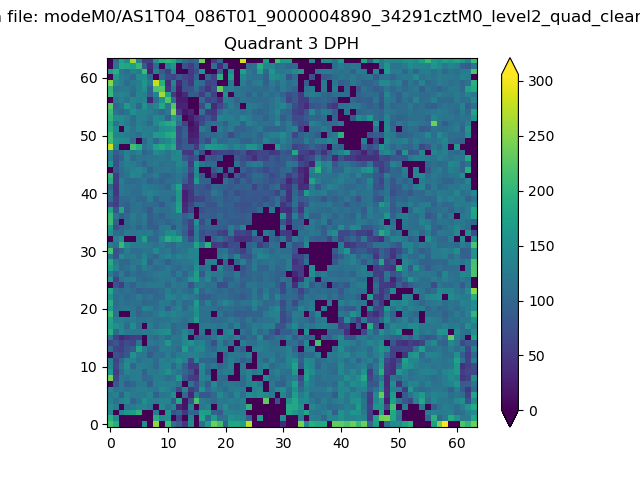 |
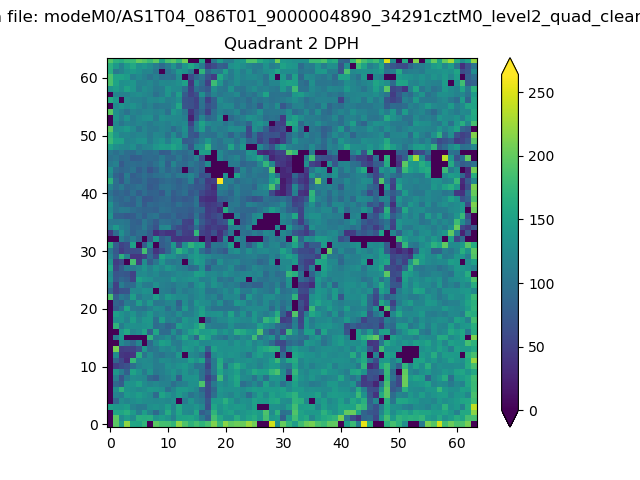 |
Quadrant C |
| Plot type | Count rate plots | Images |
|---|---|---|
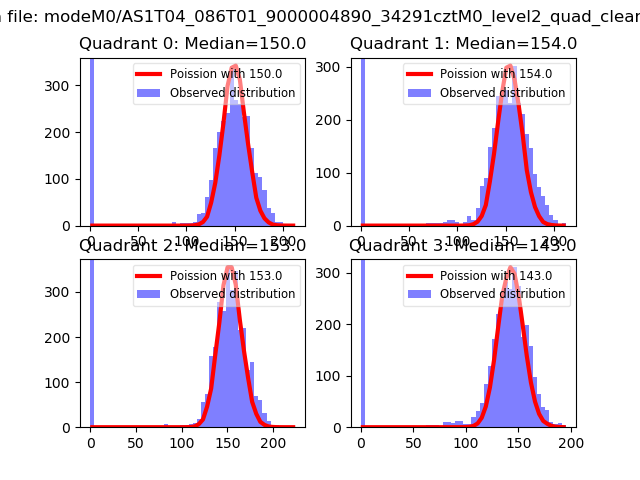
| Comparison with Poisson distribution Blue bars denote a histogram of data divided into 1 sec bins. Red curve is a Poisson curve with rate = median count rate of data. |
 |
 |
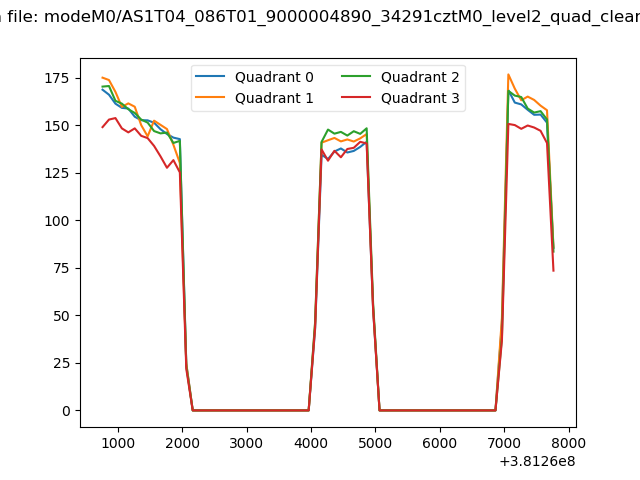
| Quadrant-wise count rates Data is divided into 100 sec bins |
 |
|
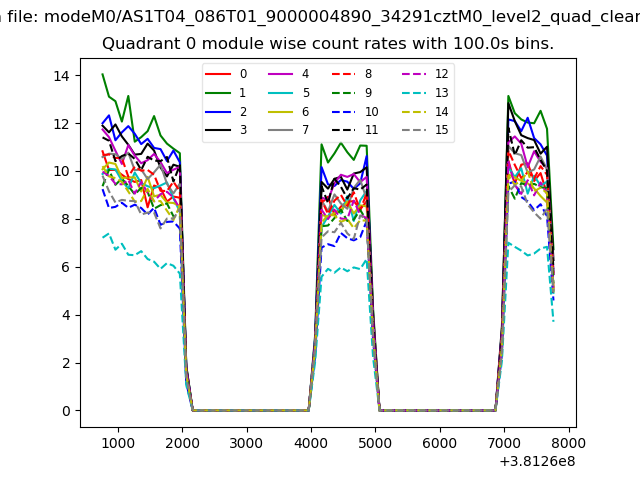
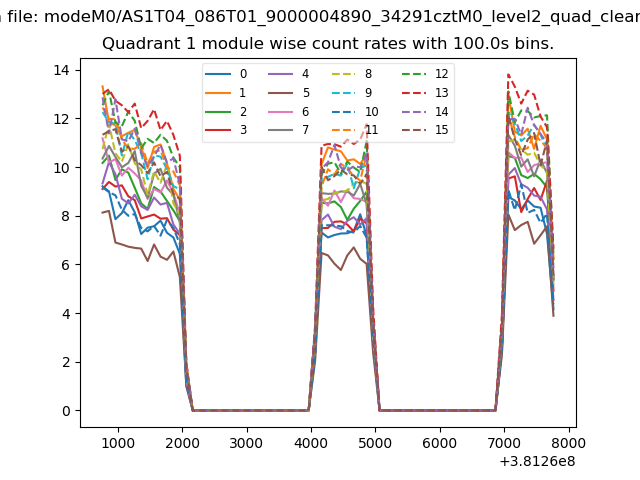
| Module-wise count rates for Quadrant A Data is divided into 100 sec bins |
 |
 |
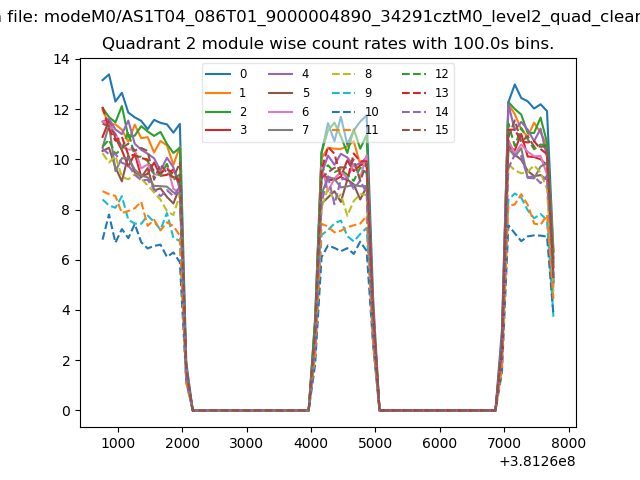
| Module-wise count rates for Quadrant B Data is divided into 100 sec bins |
 |
 |
| Module-wise count rates for Quadrant C Data is divided into 100 sec bins |
 |
 |
| Module-wise count rates for Quadrant D Data is divided into 100 sec bins |
 |
 |
| Parameter | Plot |
|---|---|
| CZT HV Monitor | 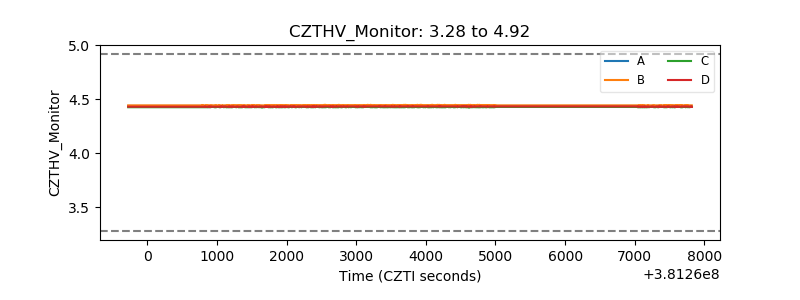 |
| D_VDD | 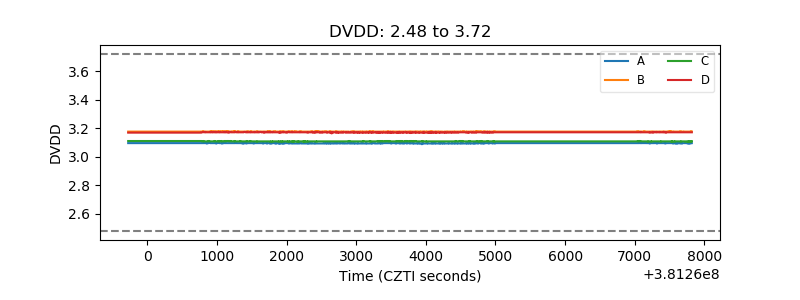 |
| Temperature 1 | 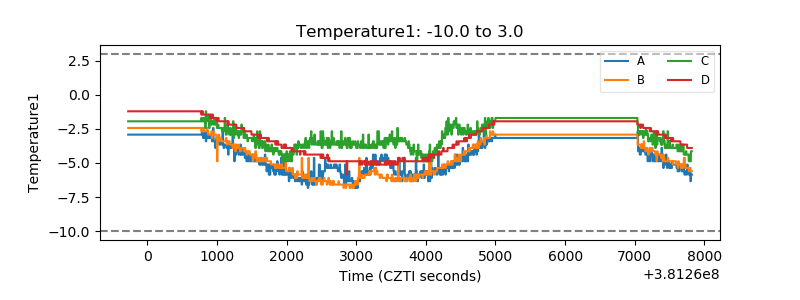 |
| Veto HV Monitor | 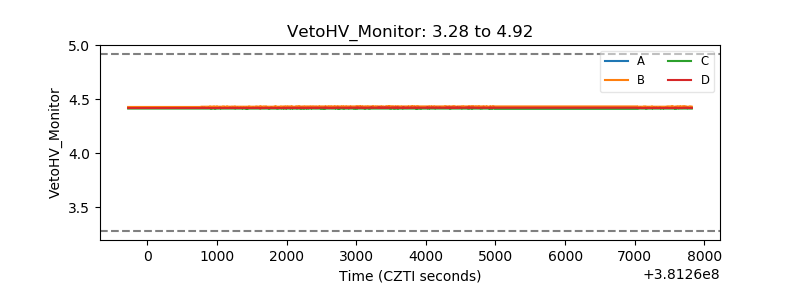 |
| Veto LLD | 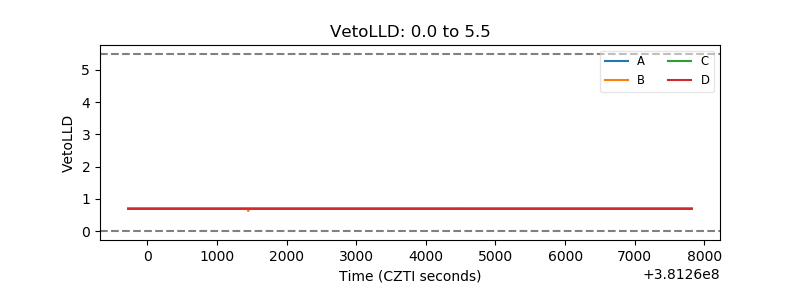 |
| Alpha Counter | 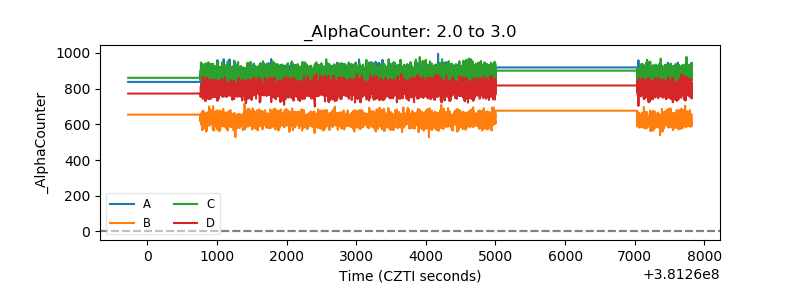 |
| _CPM_Rate | 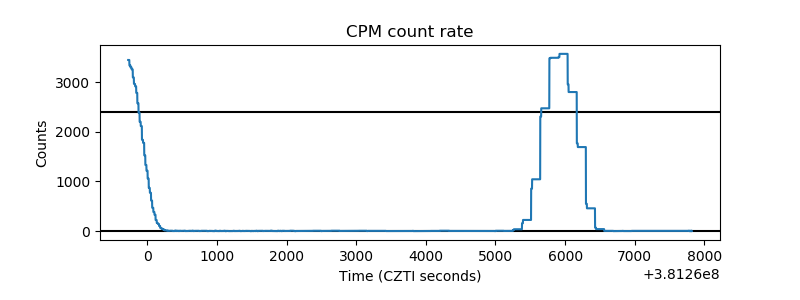 |
| CZT Counter | 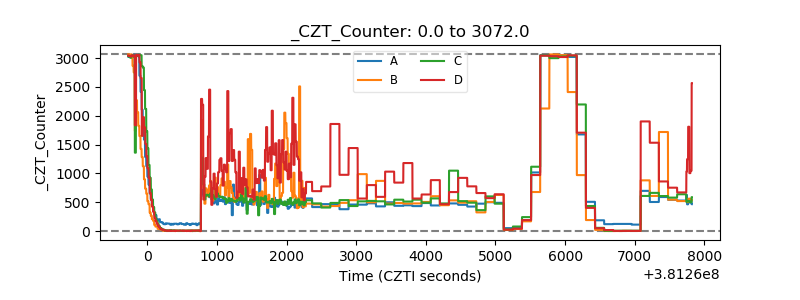 |
| +2.5 Volts monitor | 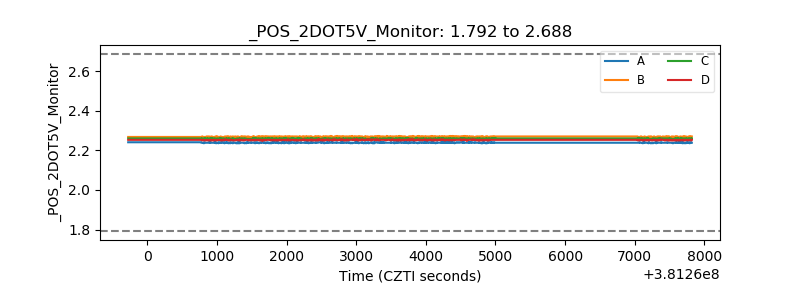 |
| +5 Volts monitor | 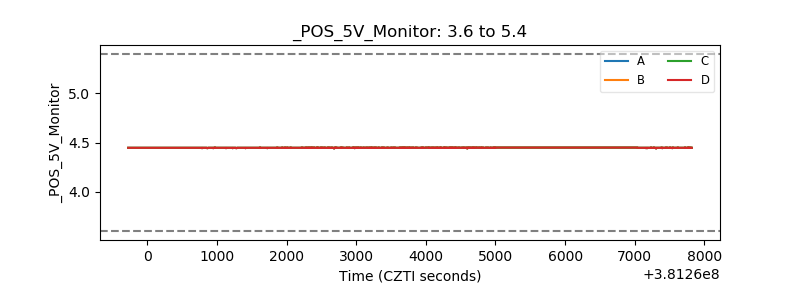 |
| _ROLL_ROT | 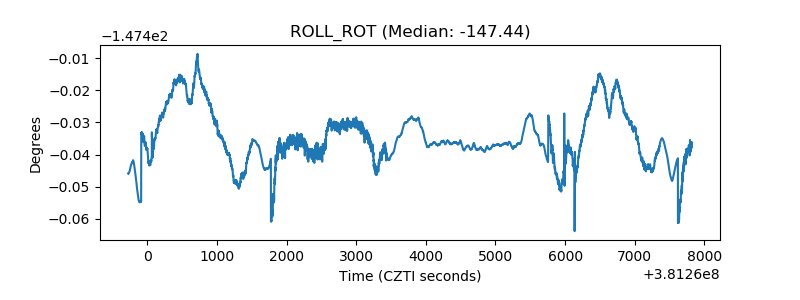 |
| _Roll_DEC | 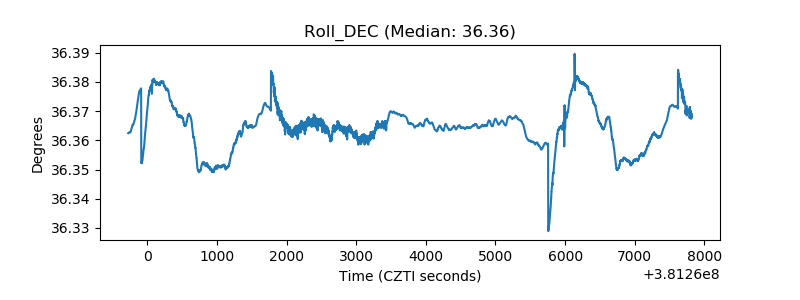 |
| _Roll_RA | 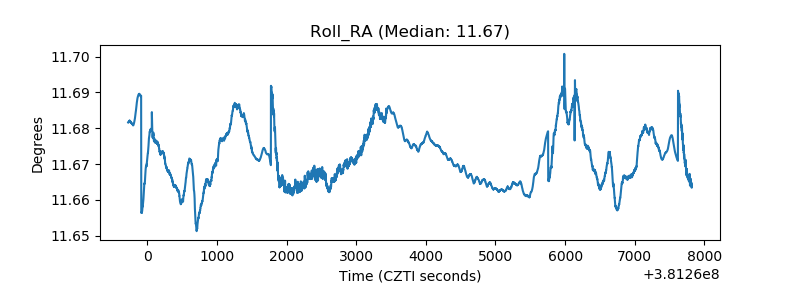 |
| Veto Counter | 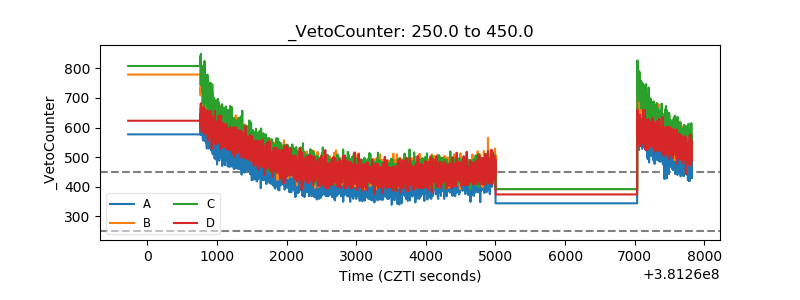 |