| Param | Original file | Final file |
|---|---|---|
| Filename | modeM0/AS1T04_086T01_9000004890_34277cztM0_level2.evt | modeM0/AS1T04_086T01_9000004890_34277cztM0_level2_quad_clean.evt |
| Size (bytes) | 480,300,480 | 63,852,480 |
| Size | 458.1 MB | 60.9 MB |
| Events in quadrant A | 2,537,046 | 406,654 |
| Events in quadrant B | 3,794,665 | 398,659 |
| Events in quadrant C | 2,882,046 | 416,491 |
| Events in quadrant D | 4,998,266 | 365,813 |
| Mode M0 | |||
|---|---|---|---|
| Quadrant | BADHDUFLAG | Total packets | Discarded packets |
| A | 0 | 10526 | 3 |
| B | 0 | 14367 | 2 |
| C | 0 | 11362 | 2 |
| D | 0 | 18186 | 2 |
| Mode SS | |||
|---|---|---|---|
| Quadrant | BADHDUFLAG | Total packets | Discarded packets |
| A | 0 | 100 | 0 |
| B | 0 | 100 | 0 |
| C | 0 | 100 | 0 |
| D | 0 | 100 | 0 |
| Mode M9 | |||
|---|---|---|---|
| Quadrant | BADHDUFLAG | Total packets | Discarded packets |
| A | 0 | 28 | 0 |
| B | 0 | 28 | 0 |
| C | 0 | 28 | 0 |
| D | 0 | 29 | 0 |
| Quadrant | Total seconds | Saturated seconds | Saturation percentage |
|---|---|---|---|
| A | 4927 | 6 | 0.121778% |
| B | 4927 | 456 | 9.255125% |
| C | 4927 | 56 | 1.136594% |
| D | 4927 | 520 | 10.554090% |
Noise dominated data is calculated using 1-second bins in cleaned event files. If a bin has >2000 counts, and if more than 50% of those come from <1% of pixels, then it is considered to be noise-dominated and hence unusable.
| Quadrant | # 1 sec bins | Bins with >0 counts | Bins with >2000 counts | High rate bins dominated by noise | Noise dominated (total time) | Noise dominated (detector-on time) | Marked lightcurve |
|---|---|---|---|---|---|---|---|
| A | 6990 | 4928 | 1 | 1 | 0.01% | 0.02% | 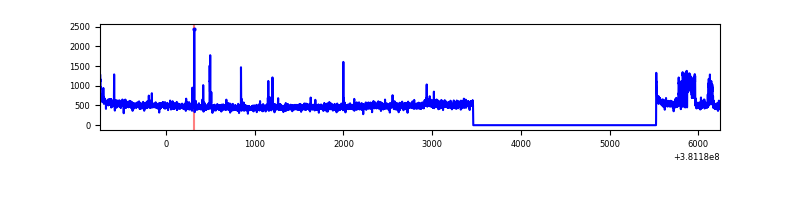 |
| B | 6990 | 4928 | 307 | 307 | 4.39% | 6.23% | 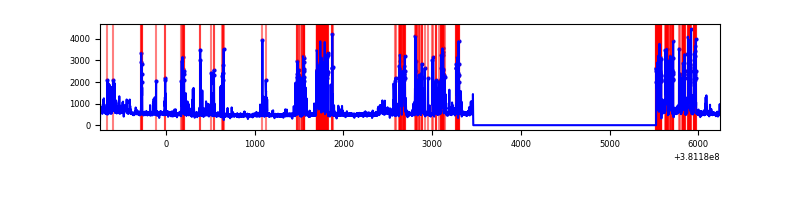 |
| C | 6990 | 4928 | 39 | 39 | 0.56% | 0.79% | 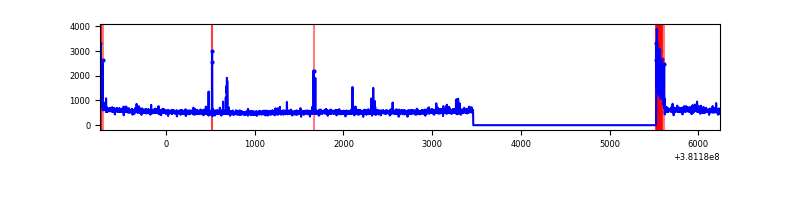 |
| D | 6990 | 4928 | 502 | 502 | 7.18% | 10.19% | 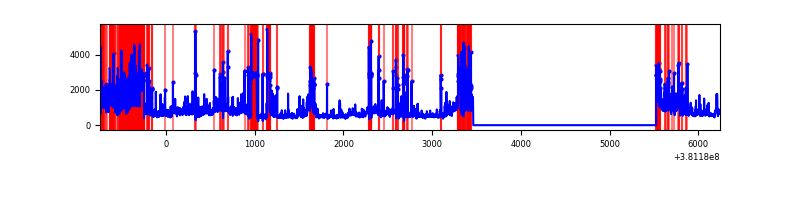 |
Top three noisy pixels from each quadrant. If the there are fewer than three noisy pixels in the level2.evt file, extra rows are filled as -1
| Pixel properties | Quadrant properties | ||||||
|---|---|---|---|---|---|---|---|
| Quadrant | DetID | PixID | Counts | Sigma | Mean | Median | Sigma |
| A | 15 | 47 | 101049 | 824.55 | 611 | 600 | 121.8 |
| A | 9 | 143 | 27441 | 220.33 | 611 | 600 | 121.8 |
| A | 10 | 83 | 26413 | 211.89 | 611 | 600 | 121.8 |
| B | 5 | 172 | 1268322 | 11242.06 | 598 | 584 | 112.8 |
| B | 0 | 182 | 58435 | 513.01 | 598 | 584 | 112.8 |
| B | 0 | 229 | 48965 | 429.03 | 598 | 584 | 112.8 |
| C | 15 | 214 | 214532 | 1517.74 | 613 | 620 | 140.9 |
| C | 0 | 10 | 155973 | 1102.26 | 613 | 620 | 140.9 |
| C | 14 | 254 | 59427 | 417.25 | 613 | 620 | 140.9 |
| D | 7 | 223 | 1234533 | 8011.8 | 575 | 567 | 154.0 |
| D | 12 | 235 | 576422 | 3738.87 | 575 | 567 | 154.0 |
| D | 8 | 195 | 447036 | 2898.8 | 575 | 567 | 154.0 |
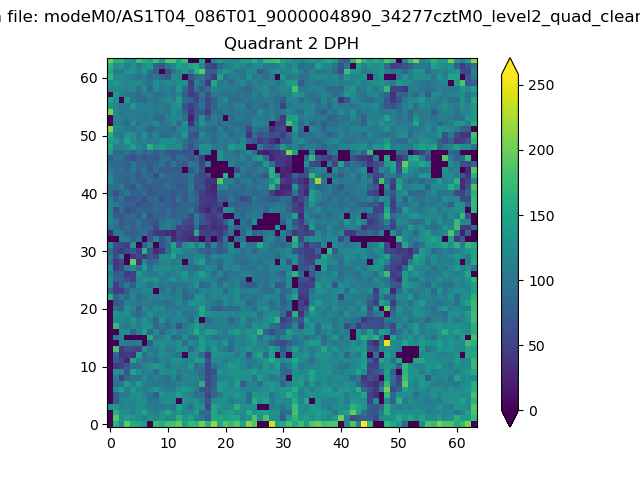
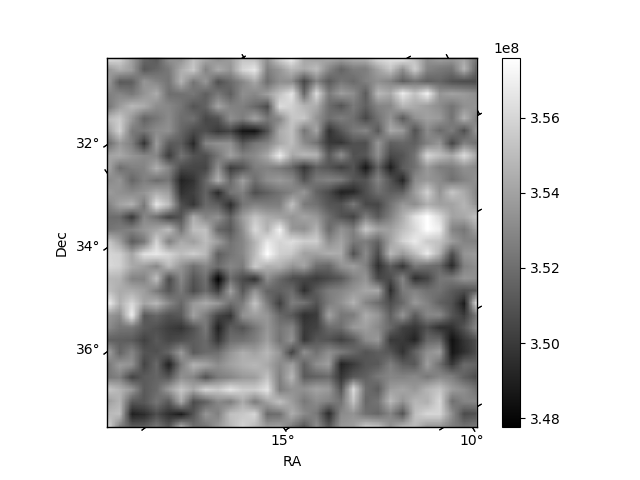
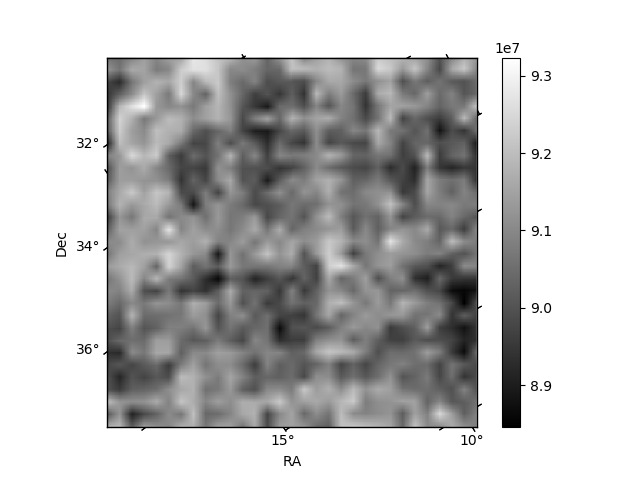
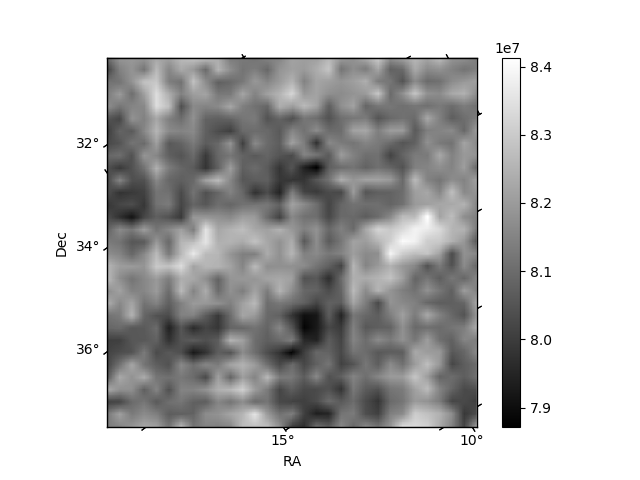
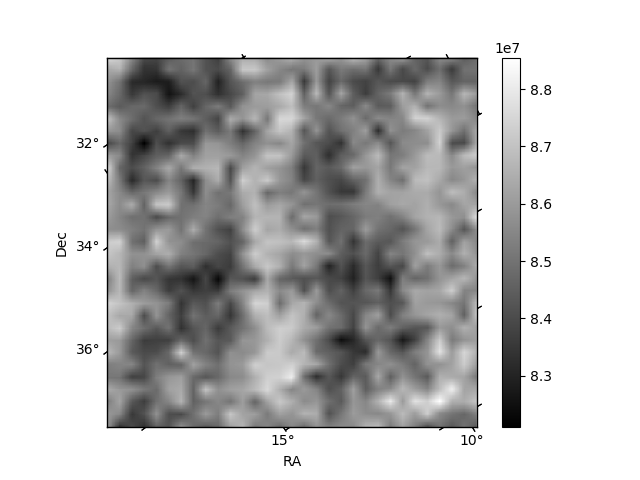
Histogram calculated using DETX and DETY for each event in the final _common_clean file
| Quadrant A | 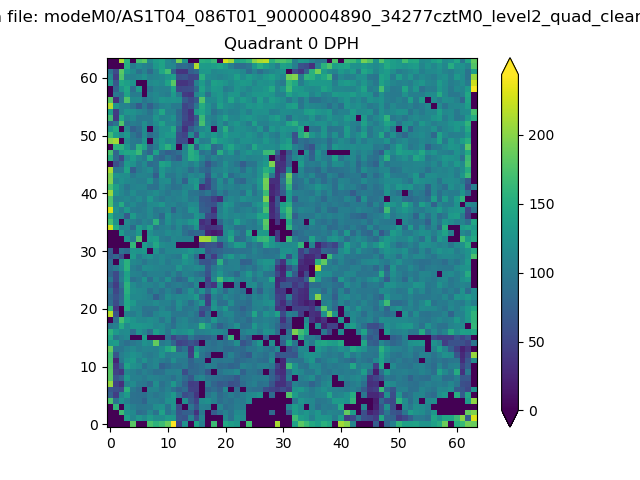 |
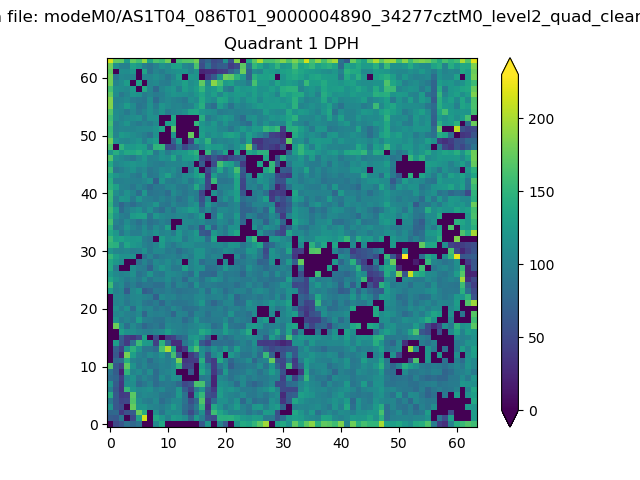 |
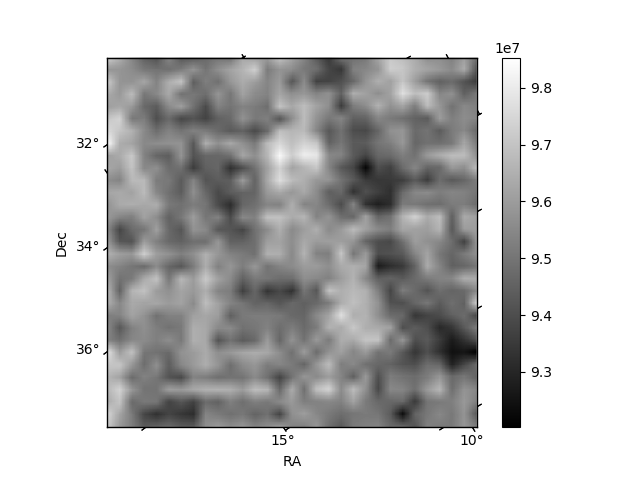
Quadrant B |
|---|---|---|---|
| Quadrant D | 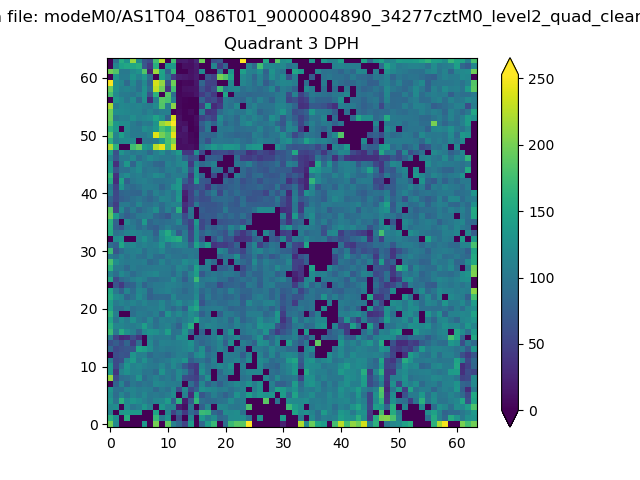 |
 |
Quadrant C |
| Plot type | Count rate plots | Images |
|---|---|---|
| Comparison with Poisson distribution Blue bars denote a histogram of data divided into 1 sec bins. Red curve is a Poisson curve with rate = median count rate of data. |
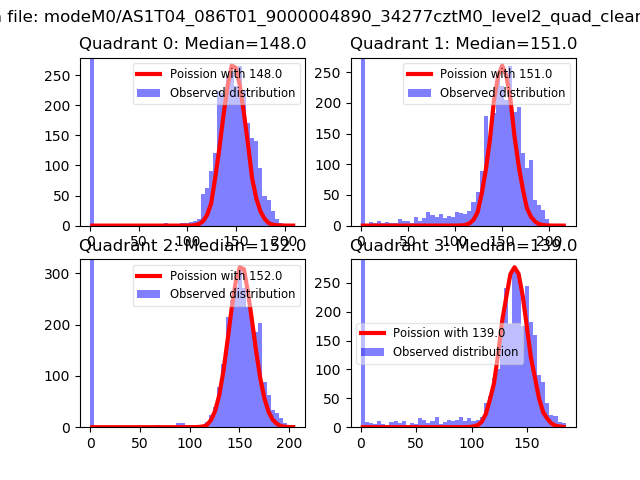 |
 |
| Quadrant-wise count rates Data is divided into 100 sec bins |
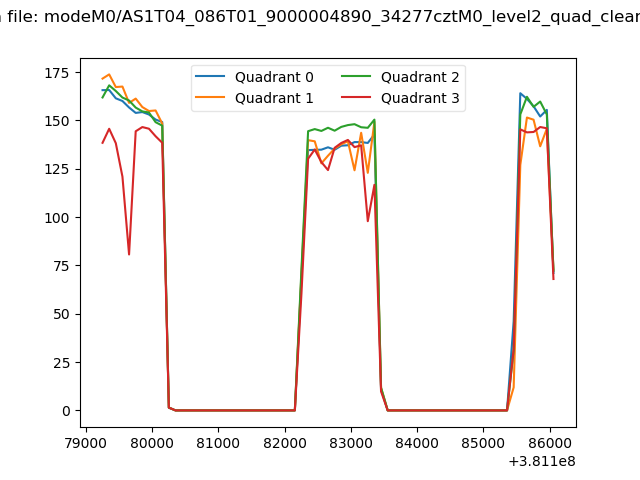 |
|
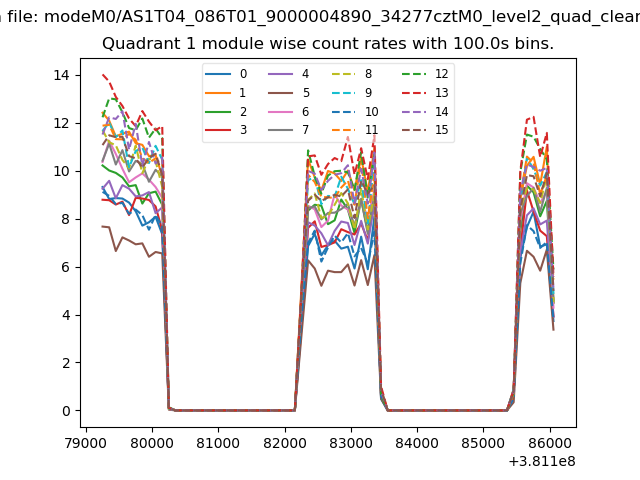
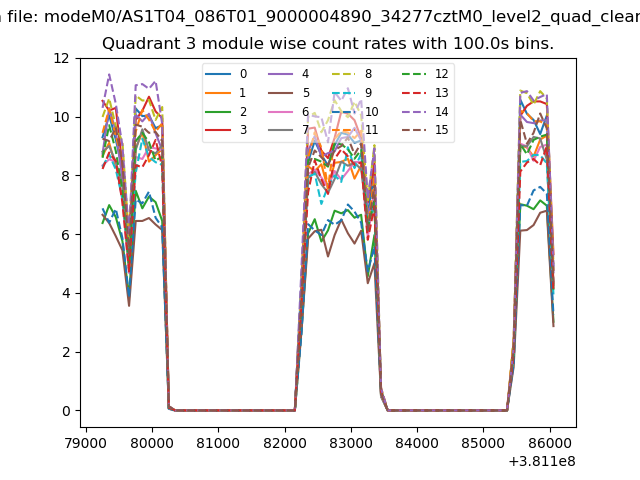
| Module-wise count rates for Quadrant A Data is divided into 100 sec bins |
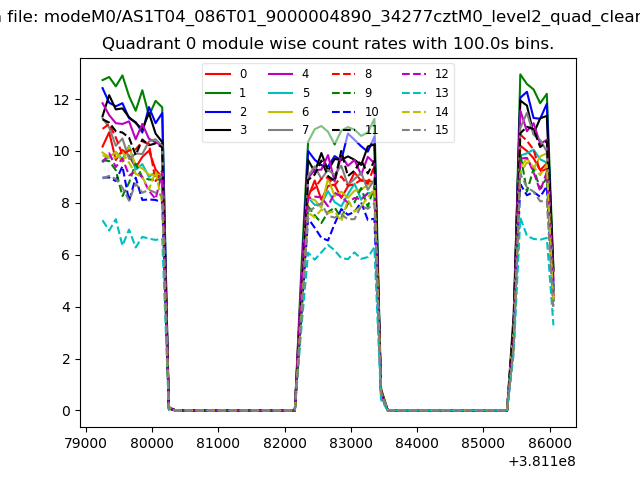 |
 |
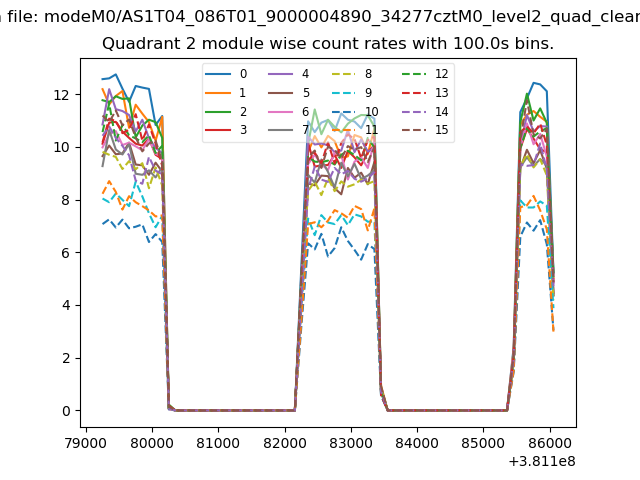
| Module-wise count rates for Quadrant B Data is divided into 100 sec bins |
 |
 |
| Module-wise count rates for Quadrant C Data is divided into 100 sec bins |
 |
 |
| Module-wise count rates for Quadrant D Data is divided into 100 sec bins |
 |
 |
| Parameter | Plot |
|---|---|
| CZT HV Monitor | 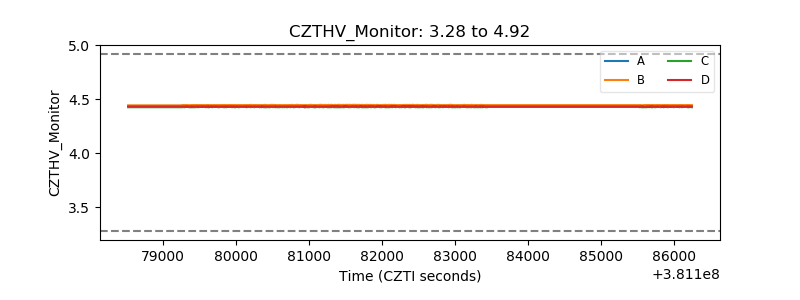 |
| D_VDD | 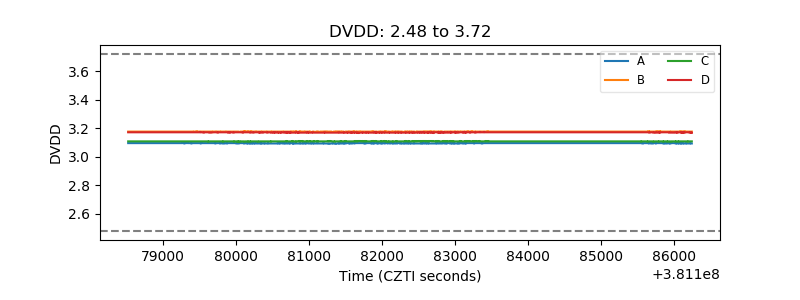 |
| Temperature 1 | 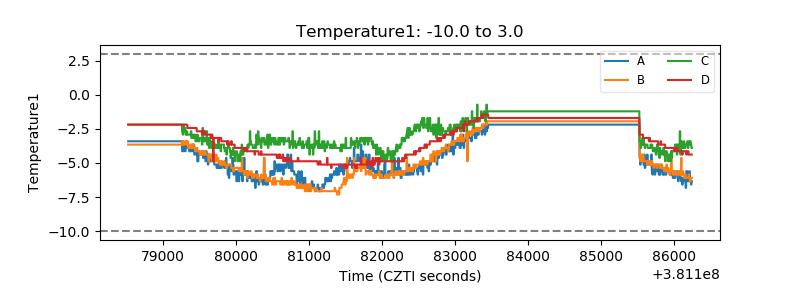 |
| Veto HV Monitor | 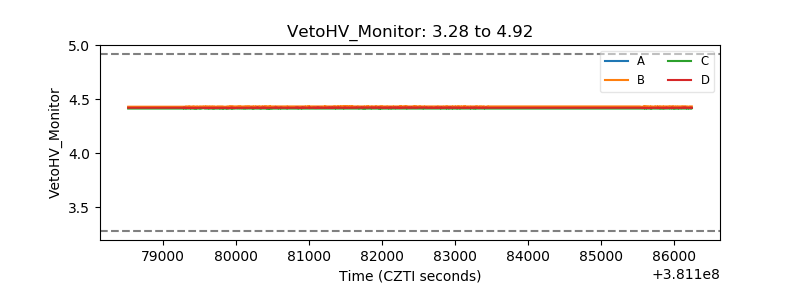 |
| Veto LLD | 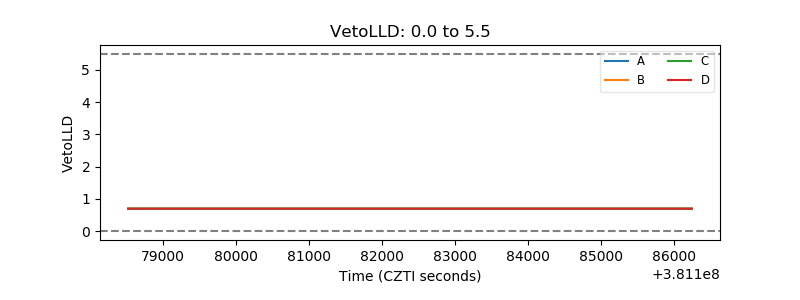 |
| Alpha Counter | 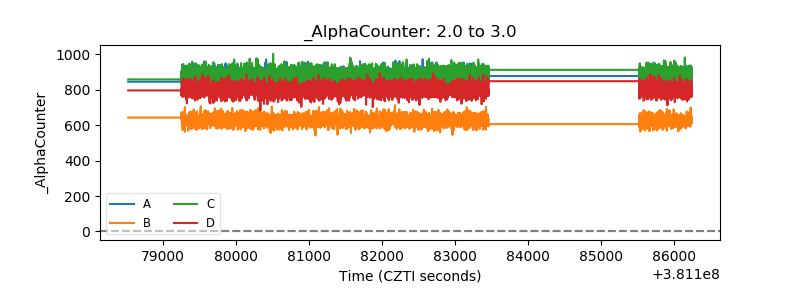 |
| _CPM_Rate | 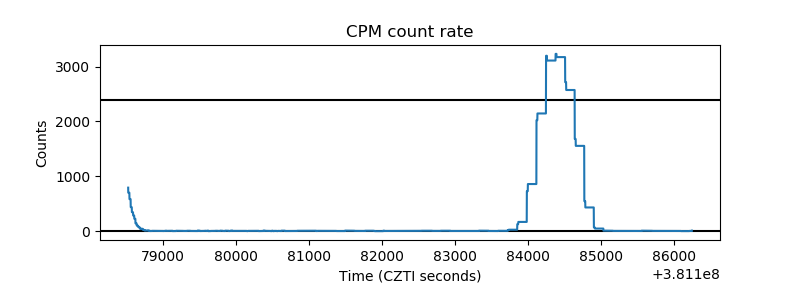 |
| CZT Counter | 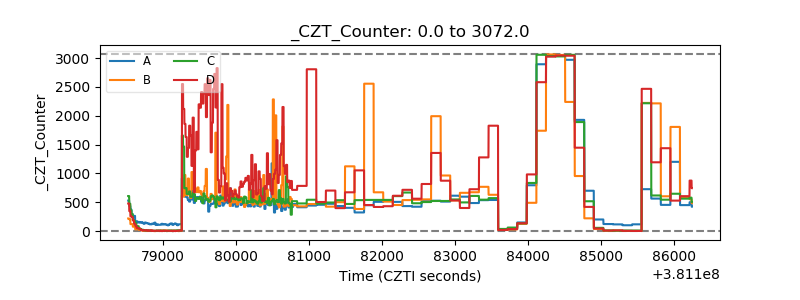 |
| +2.5 Volts monitor | 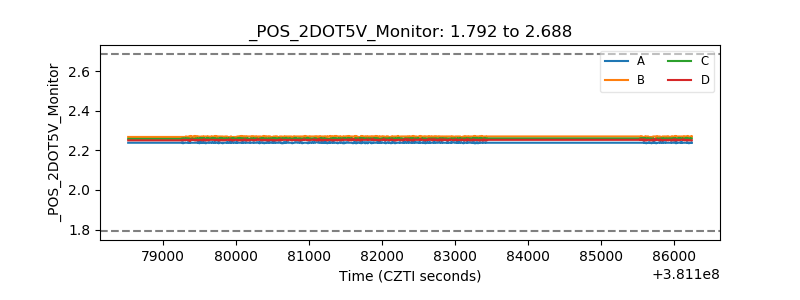 |
| +5 Volts monitor | 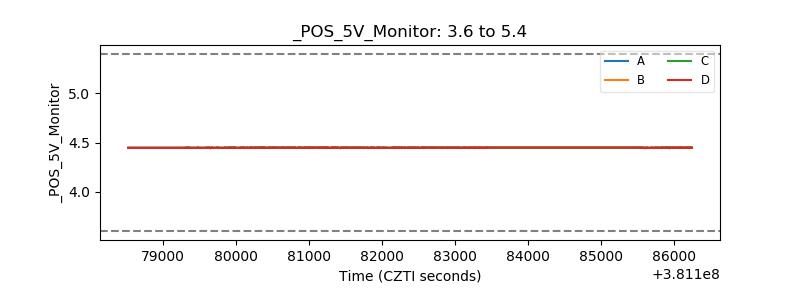 |
| _ROLL_ROT | 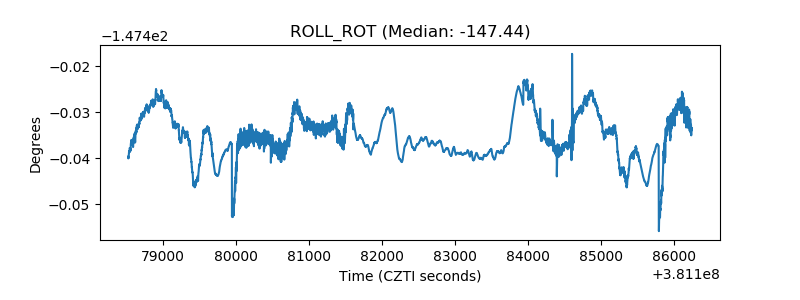 |
| _Roll_DEC | 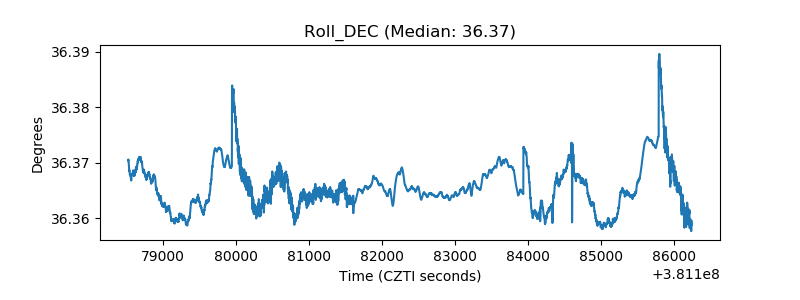 |
| _Roll_RA | 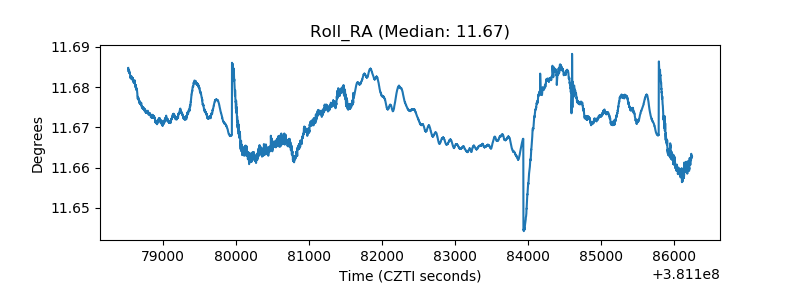 |
| Veto Counter | 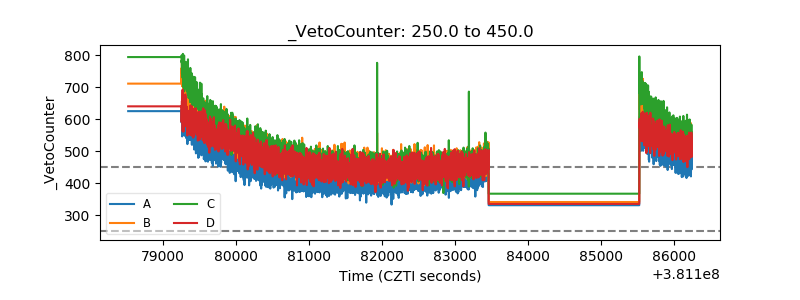 |