| Param | Original file | Final file |
|---|---|---|
| Filename | modeM0/AS1T04_086T01_9000004890_34272cztM0_level2.evt | modeM0/AS1T04_086T01_9000004890_34272cztM0_level2_quad_clean.evt |
| Size (bytes) | 92,056,320 | 18,276,480 |
| Size | 87.8 MB | 17.4 MB |
| Events in quadrant A | 484,537 | 121,342 |
| Events in quadrant B | 943,433 | 115,113 |
| Events in quadrant C | 582,033 | 123,083 |
| Events in quadrant D | 708,041 | 117,352 |
| Mode M0 | |||
|---|---|---|---|
| Quadrant | BADHDUFLAG | Total packets | Discarded packets |
| A | 0 | 2031 | 2 |
| B | 0 | 3515 | 1 |
| C | 0 | 2280 | 1 |
| D | 0 | 2715 | 1 |
| Mode SS | |||
|---|---|---|---|
| Quadrant | BADHDUFLAG | Total packets | Discarded packets |
| A | 0 | 22 | 0 |
| B | 0 | 22 | 0 |
| C | 0 | 22 | 0 |
| D | 0 | 22 | 0 |
| Mode M9 | |||
|---|---|---|---|
| Quadrant | BADHDUFLAG | Total packets | Discarded packets |
| A | 0 | 16 | 0 |
| B | 0 | 16 | 0 |
| C | 0 | 16 | 0 |
| D | 0 | 16 | 0 |
| Quadrant | Total seconds | Saturated seconds | Saturation percentage |
|---|---|---|---|
| A | 983 | 2 | 0.203459% |
| B | 983 | 132 | 13.428281% |
| C | 983 | 23 | 2.339776% |
| D | 983 | 21 | 2.136317% |
Noise dominated data is calculated using 1-second bins in cleaned event files. If a bin has >2000 counts, and if more than 50% of those come from <1% of pixels, then it is considered to be noise-dominated and hence unusable.
| Quadrant | # 1 sec bins | Bins with >0 counts | Bins with >2000 counts | High rate bins dominated by noise | Noise dominated (total time) | Noise dominated (detector-on time) | Marked lightcurve |
|---|---|---|---|---|---|---|---|
| A | 2597 | 984 | 0 | 0 | 0.00% | 0.00% | 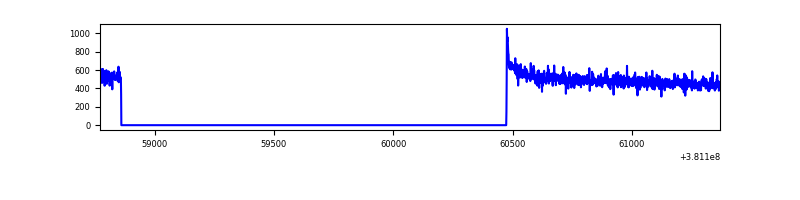 |
| B | 2597 | 984 | 80 | 80 | 3.08% | 8.13% | 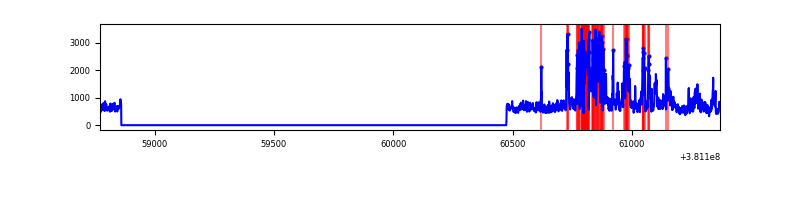 |
| C | 2597 | 984 | 15 | 15 | 0.58% | 1.52% | 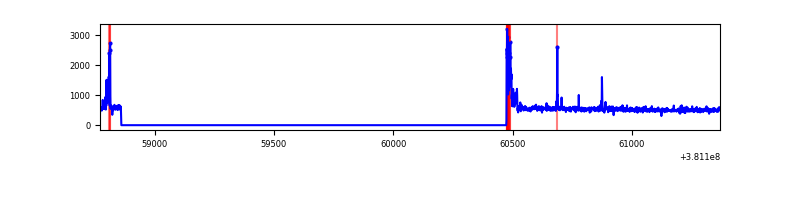 |
| D | 2597 | 984 | 18 | 18 | 0.69% | 1.83% | 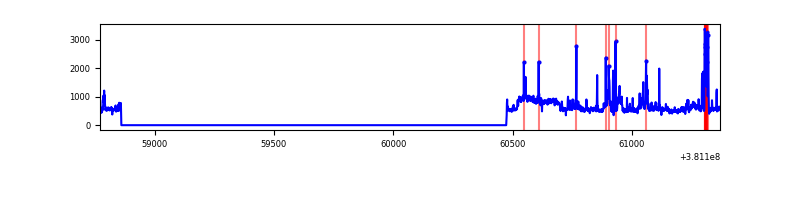 |
Top three noisy pixels from each quadrant. If the there are fewer than three noisy pixels in the level2.evt file, extra rows are filled as -1
| Pixel properties | Quadrant properties | ||||||
|---|---|---|---|---|---|---|---|
| Quadrant | DetID | PixID | Counts | Sigma | Mean | Median | Sigma |
| A | 10 | 83 | 11715 | 443.06 | 121 | 119 | 26.2 |
| A | 13 | 254 | 1593 | 56.32 | 121 | 119 | 26.2 |
| A | 3 | 137 | 1221 | 42.1 | 121 | 119 | 26.2 |
| B | 5 | 172 | 367736 | 15479.42 | 113 | 110 | 23.7 |
| B | 4 | 251 | 103734 | 4363.24 | 113 | 110 | 23.7 |
| B | 0 | 190 | 15239 | 637.03 | 113 | 110 | 23.7 |
| C | 15 | 214 | 46389 | 1620.17 | 116 | 117 | 28.6 |
| C | 0 | 10 | 43879 | 1532.28 | 116 | 117 | 28.6 |
| C | 14 | 254 | 21839 | 760.57 | 116 | 117 | 28.6 |
| D | 8 | 195 | 119672 | 3940.98 | 119 | 115 | 30.3 |
| D | 14 | 52 | 61892 | 2036.37 | 119 | 115 | 30.3 |
| D | 2 | 250 | 20900 | 685.14 | 119 | 115 | 30.3 |
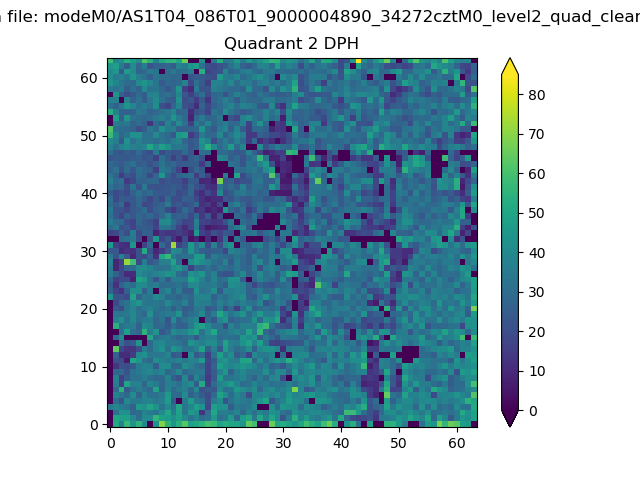
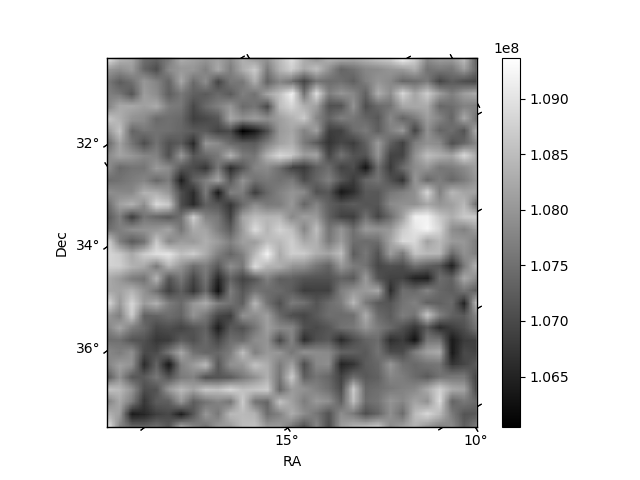
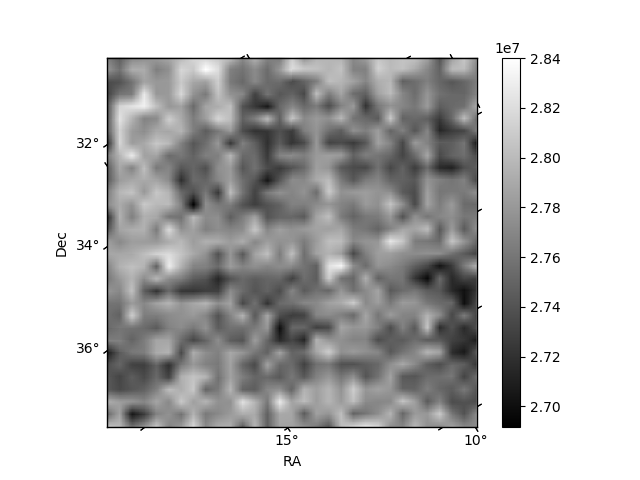
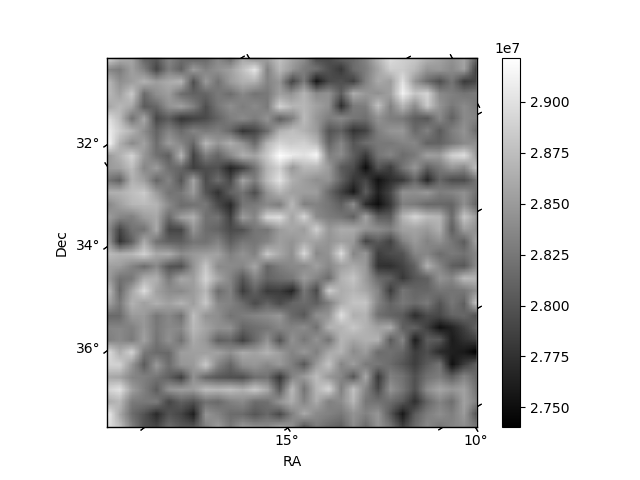
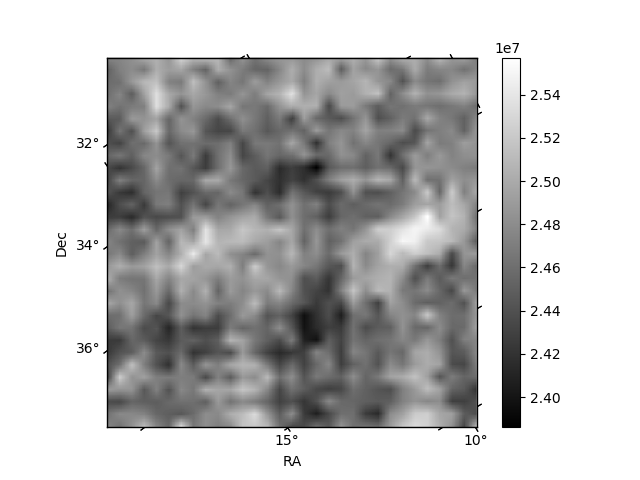
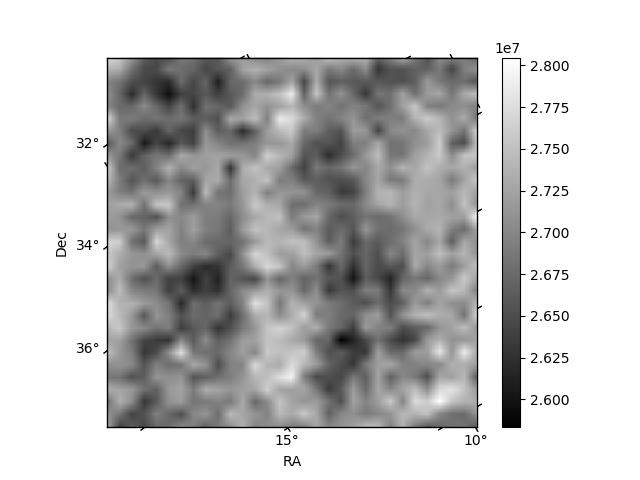
Histogram calculated using DETX and DETY for each event in the final _common_clean file
| Quadrant A | 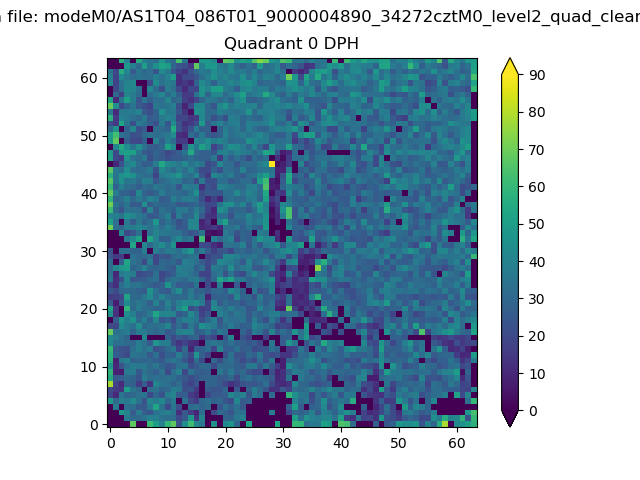 |
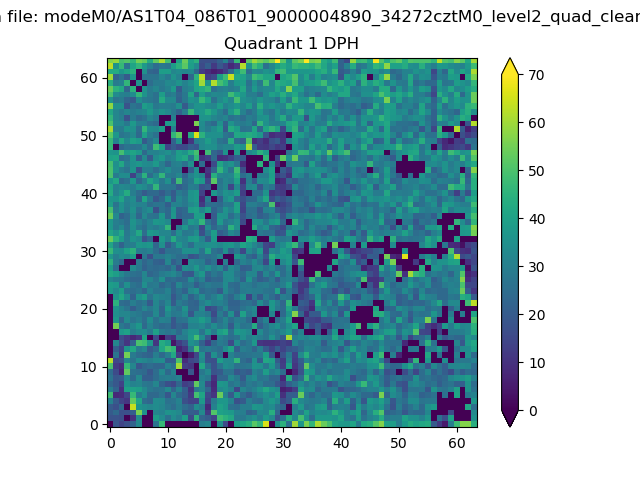 |
Quadrant B |
|---|---|---|---|
| Quadrant D | 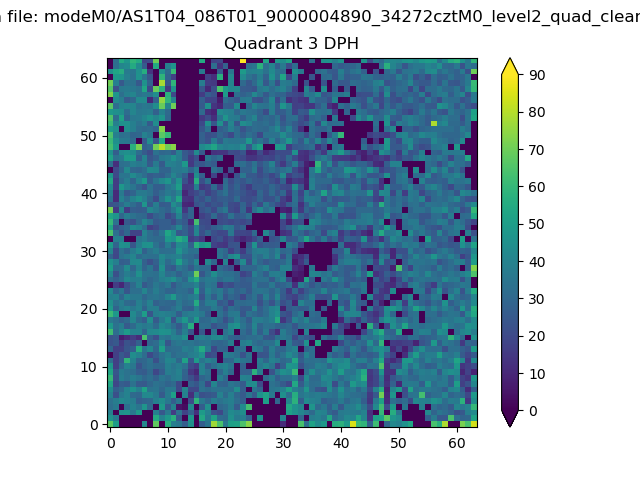 |
 |
Quadrant C |
| Plot type | Count rate plots | Images |
|---|---|---|
| Comparison with Poisson distribution Blue bars denote a histogram of data divided into 1 sec bins. Red curve is a Poisson curve with rate = median count rate of data. |
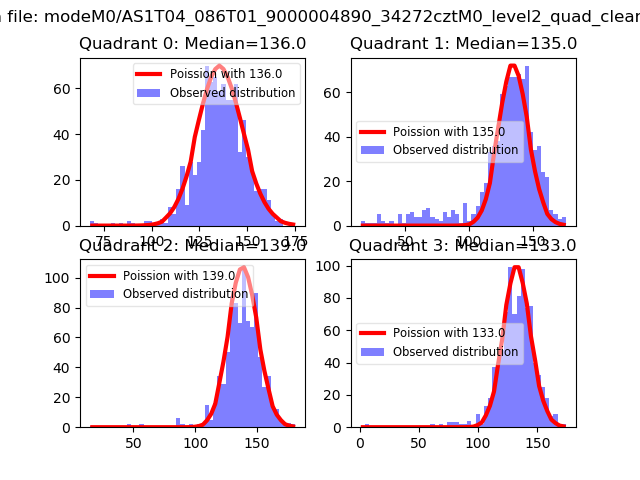 |
 |
| Quadrant-wise count rates Data is divided into 100 sec bins |
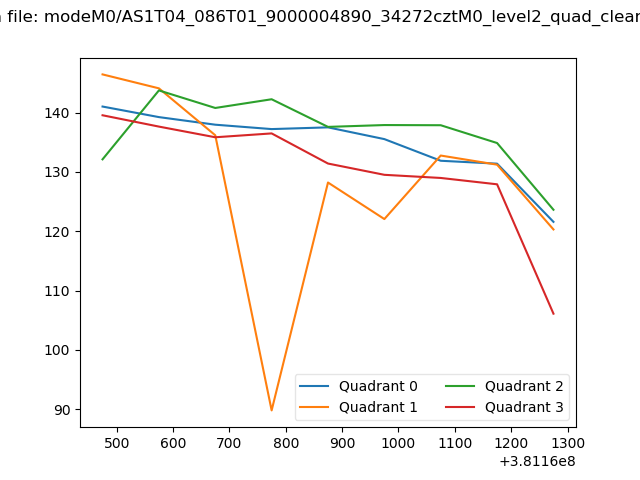 |
|
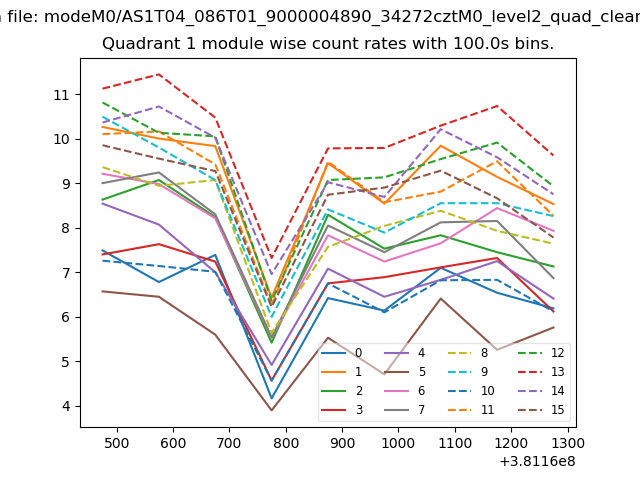
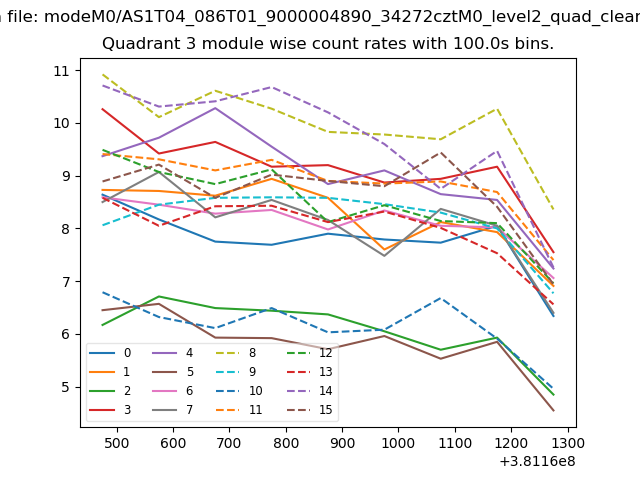
| Module-wise count rates for Quadrant A Data is divided into 100 sec bins |
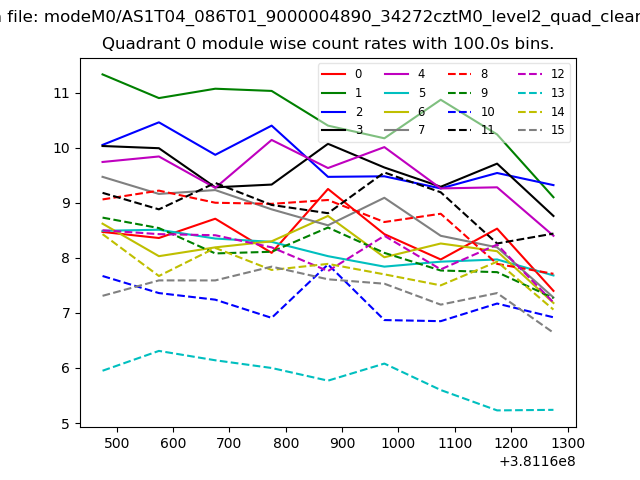 |
 |
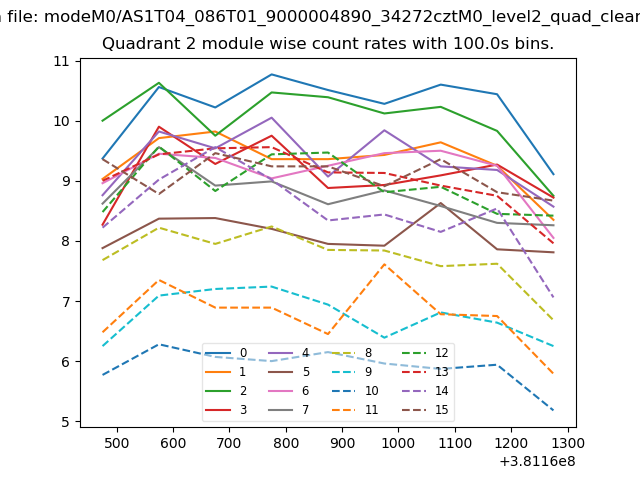
| Module-wise count rates for Quadrant B Data is divided into 100 sec bins |
 |
 |
| Module-wise count rates for Quadrant C Data is divided into 100 sec bins |
 |
 |
| Module-wise count rates for Quadrant D Data is divided into 100 sec bins |
 |
 |
| Parameter | Plot |
|---|---|
| CZT HV Monitor | 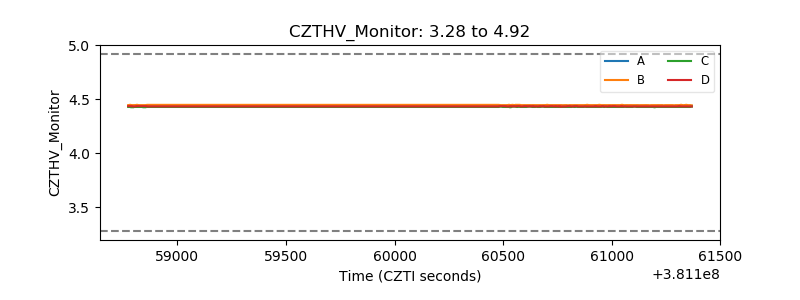 |
| D_VDD | 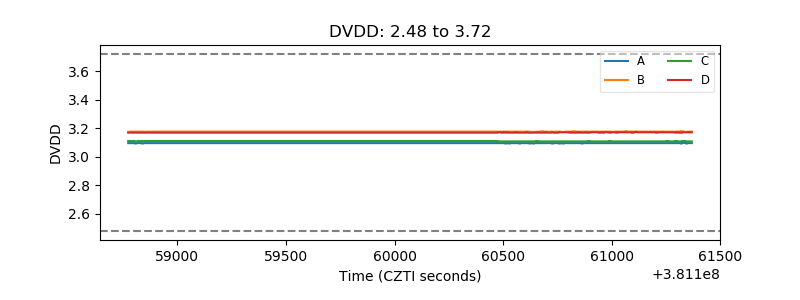 |
| Temperature 1 | 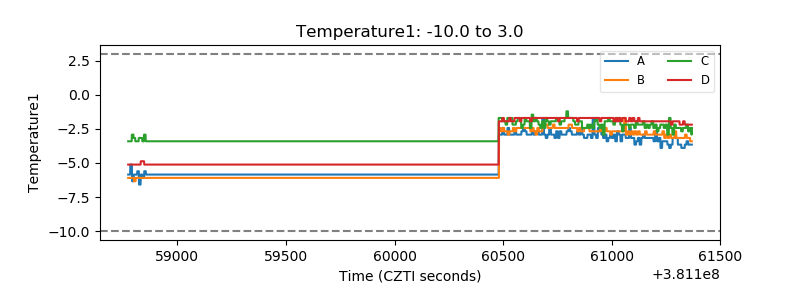 |
| Veto HV Monitor | 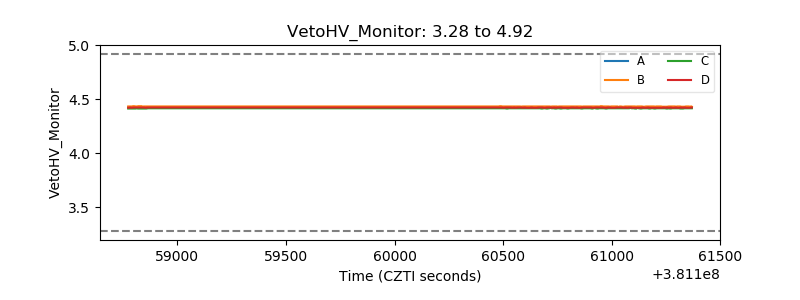 |
| Veto LLD | 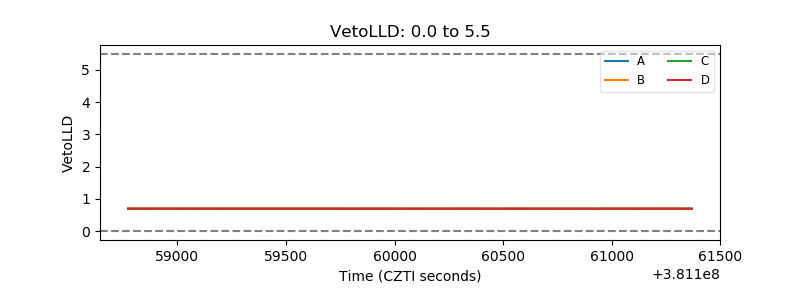 |
| Alpha Counter | 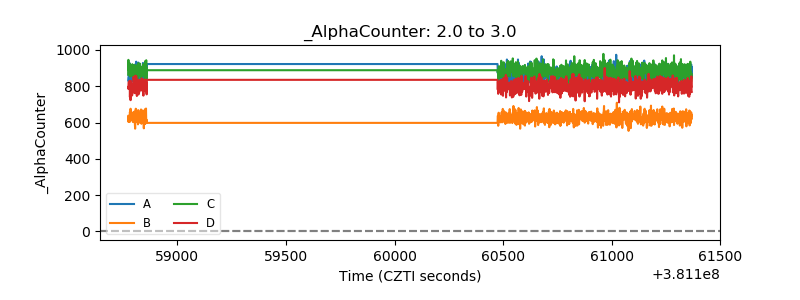 |
| _CPM_Rate | 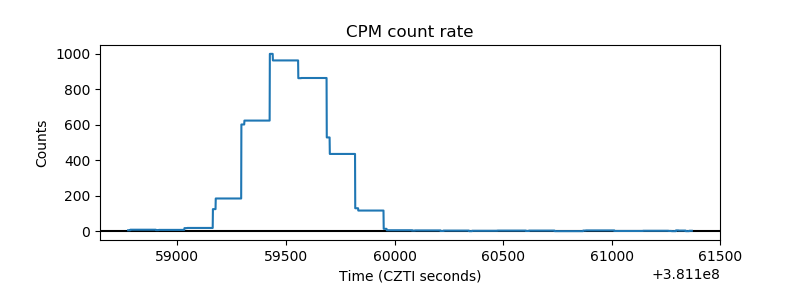 |
| CZT Counter | 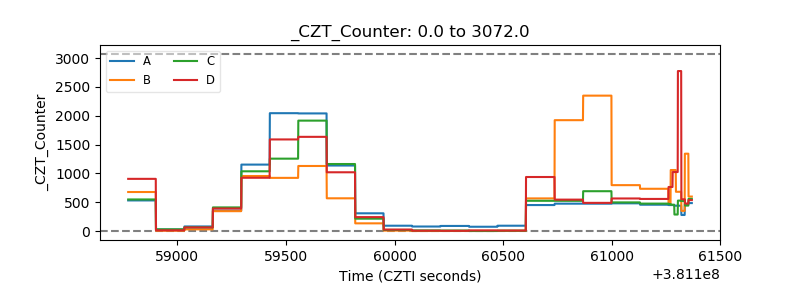 |
| +2.5 Volts monitor | 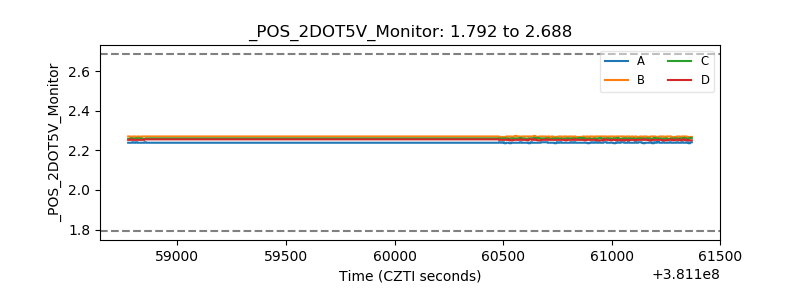 |
| +5 Volts monitor | 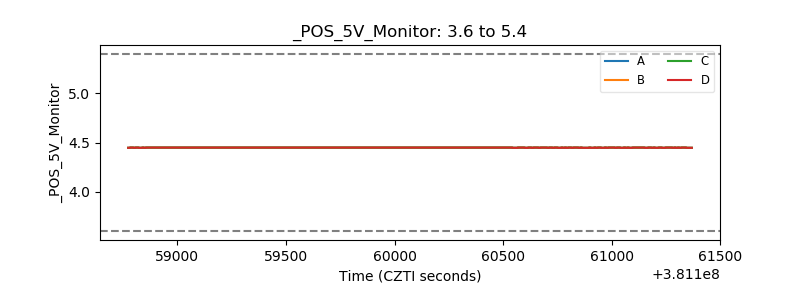 |
| _ROLL_ROT | 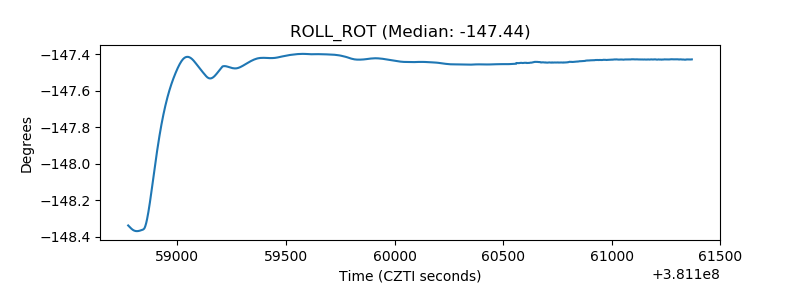 |
| _Roll_DEC | 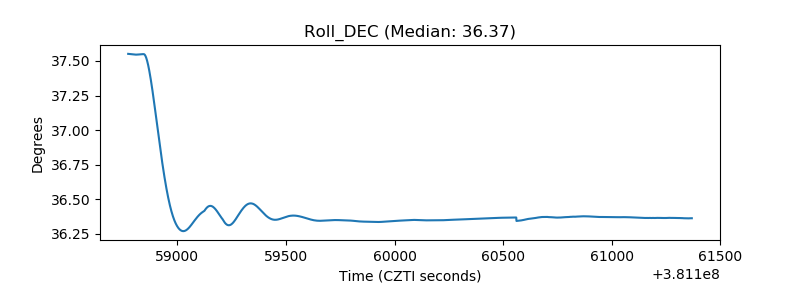 |
| _Roll_RA | 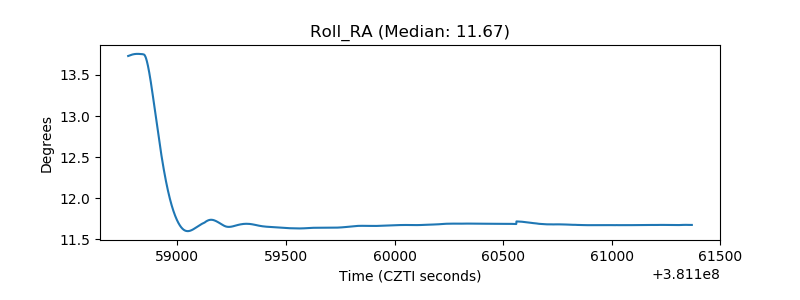 |
| Veto Counter | 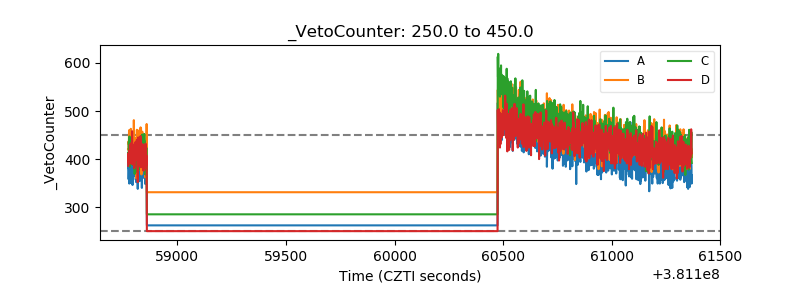 |